2619
Diffusion metrics correlate with the relaxometric constant Dr of the χ-separation model1Department of Brain and Behavioral Sciences, University of Pavia, Pavia, Italy, 2NMR Research unit, Queen Square Multiple Sclerosis Centre, Department of Neuroinflammation, Queen Square Institute of Neurology, University College London, London, United Kingdom, 3Department of Medical Physics and Biomedical Engineering, Centre for Medical Image Computing (CMIC), University College London, London, United Kingdom, 4E-Health Center, Universitat Oberta de Catalunya, Barcelona, Spain, 5Radiomics Group, Vall d’Hebron Institute of Oncology, Vall d’Hebron Barcelona Hospital Campus, Barcelona, Spain, 6Digital Neuroscience Centre, IRCCS Mondino Foundation, Pavia, Italy, 7Neurology-Neuroimmunology Department Multiple Sclerosis Centre of Catalonia (Cemcat), Vall d’Hebron Barcelona Hospital Campus, Barcelona, Spain
Synopsis
Keywords: Susceptibility/QSM, Microstructure, Modelling, chi-separation method
Motivation: χ-separation method relies on assuming a certain relaxometric constant (Dr) calculated as the mean of a group of healthy subjects. Recently, we demonstrated that it is subject-specific.
Goal(s): The goal of this study was to evaluate the correlation between Dr and microstructural metrics obtained from diffusion tensor and diffusion kurtosis imaging (DTI and DKI).
Approach: We regressed between Dr against DTI and DKI diffusion metrics in a cohort of healthy controls.
Results: Results showed a positive correlation with fractional anisotropy and axial diffusivity, and a negative correlation with mean and radial kurtosis.
Impact: Understanding how the relaxometric constant of the χ-separation method (Dr) depends on microstructural diffusion metrics will define its personalization. This, in turn, will impact on how we assess the presence of different magnetic susceptibility sources in the brain.
INTRODUCTION
Different magnetic susceptibility separation methods have been recently developed to disentangle the contribution of positive (e.g. iron) and negative (e.g. myelin)1-3 susceptibility sources in the brain, which jointly contribute to the quantitative susceptibility map (QSM).One of these methods is called the χ-separation method4 and estimates the individual concentration of the two sources starting from a local field map and a R2’=1/T2’ map. It relies on the calculation of a certain relaxometric constant (Dr = $$$\frac{R2'}{QSM}$$$) as the mean over deep gray matter (dGM) nuclei of a group of healthy subjects. Recently, it was shown that Dr is subject dependent and that changing the value of Dr impacts on resulting maps5. Given that the diffusion process is linked with the T2 relaxation time6,7,8 we hypothesize that the subjectivity of Dr could be due to a subject-specific dGM tissue microstructure.
The main aim of this work was, therefore, to investigate the influence of water diffusion on Dr by correlating Dr with metrics calculated using diffusion tensor (DTI)9 and diffusion kurtosis imaging (DKI)10. We then assessed the impact of a standard or personal Dr on susceptibility maps.
METHODS
Subjects & AcquisitionA retrospective cohort of 24 healthy controls (HC, 12 females; 38±12y) was considered.
MRI data were acquired with a 3T Philips Ingenia CX scanner with a 32-channel head coil.
The protocol included:
1) Diffusion weighted images (DWI) acquired with a spin-echo EPI sequence (2×2×2mm3; TE/TR=96/6287ms, FA=90°, b-values={0,1000, 2000,2800 s/mm2}, directions={4, 20, 20, 36}; 9’41”). b0 with reversed phase encoding was also acquired;
2) Multi-slice single-shot inversion recovery (IR-EPI) with the same EPI readout as in 1) with a 2x2x2mm3 voxel, TE/TR=59/6885ms, 12 inversion times from 50ms to 1910ms;
3) Multi-echo 3D tilted sagittal spoiled gradient-echo (SPGR) (1x1x1mm3, TE1/ΔTE=2.3/3.3ms, TR=28.5ms, 8 echoes, FA=24°) for QSM and T2* calculations;
4) 3D sagittal T1-weighted (3DT1) MPRAGE (1x1x1mm3, TE/TR=3.2/6.9ms, FA=8°) for tissue segmentation.
Preprocessing
DTI and DKI models were fitted to DWI data (Dipy toolbox11) obtaining maps of fractional anisotropy (FA), mean diffusivity (MD), axial and radial diffusivity (AD, RD respectively), kurtosis FA (kFA), axial, radial and mean kurtosis (AK, RK, MK respectively).
Quantitative T2 maps were obtained from two images with different TEs and same EPI readout: i) T2-weighted S0 image from the fit of the IR-EPI, ii) b0 volume from the DWI acquisition. T2* was calculated from the magnitude of SPGR data (MyRelax toolbox13). T2 and T2* were used to compute the R2’ map.
QSM and local field maps were reconstructed from the complex SPGR data (Morphology Enabled Dipole Inversion (MEDI)12 toolbox).
Figure1 displays a set of all the maps used for the analysis.
Brain parcellation was performed on the 3DT1 volume (Geodesic Information Flows, GIF)14 and regions of interest (ROIs), such as the putamen (Put), nucleus accumbens (NA), globus pallidus (GP), caudate nucleus (CN), and ventral diencephalon (vDC), were extracted bilaterally. Red nuclei (RN) and substantia nigra (SN) were manually segmented on HCs and registered to MNI space to obtain a mean mask.
T2 maps were registered to SPGR space of each subject (NiftyReg15) and ROIs were resampled both to SPGR (NiftyReg15) and DWI space (non-affine transformation, FSL16) (Figure2).
Statistical analysis
Robust means of diffusion metrics and Dr were computed using the interquartile range rule17 in all ROIs. A linear regression model (covariates: age; gender) was fitted in the R studio framework18 to explore the relation between Dr and microstructural diffusion metrics. The metrics that significantly explained variation of Dr were analyzed together to refine the statistical model and to identify which metrics best explained Dr values.
RESULTS
FA and kFA in the NA, Put and vDC, together with AD in the RN, positively correlated with Dr, while MK and RK in the RN negatively correlate with Dr (Figure3). P-values and R2 values are reported in Figure4.Among all significant metrics, FA in the vDC and AD in the RN together built the best model explaining the value of Dr, with R2=0.325 (Figure5).
DISCUSSION & CONCLUSIONS
Here we demonstrated the dependence of the relaxometric constant of the χ-separation method (Dr) on microstructural DTI and DKI metrics in a cohort of HC. Our results show that higher FA, kFA and AD are associated with higher Dr, while lower MK and RK are associated with lower Dr, supporting the strong dependency of Dr on tissue microstructure. We therefore believe that this subject-specific microstructure explains why Dr is subject dependent. Future studies are warranted to explore whether Dr could be computed independently of microstructure, for example excluding regions such as vDC and RN.Acknowledgements
EG receives funding from TDC Technology Dedicated to Care. FG receives the support of a fellowship from “la Caixa” Foundation (ID 100010434). The fellowship code is “LCF/BQ/PR22/11920010”. FPr received a Guarantors of Brain fellowship 2017–2020. FPr is supported by the National Institute for Health Research (NIHR), the Biomedical Research Centre initiative at University College London Hospitals (UCLH). RS receives funding from the BRC (BRC1130/HEI/RS/11041). H2020 Research and Innovation Action Grants Human Brain Project 785907 and 945539 (SGA2 and SGA3) to ED'A. Moreover, the project was supported by the MNL Project “Local Neuronal Microcircuits” of the Centro Fermi (Rome, Italy) to ED'A. This work was also supported by #NEXTGENERATIONEU (NGEU) and funded by the Ministry of University and Research (MUR), National Recovery and Resilience Plan (NRRP), project MNESYS (PE0000006) - A Multiscale integrated approach to the study of the nervous system in health and disease (DN. 1553 11.10.2022). FP receives funding from H2020 Research and Innovation Action Grants Human Brain Project (#785907, SGA2 and #945539, SGA3). CGWK receives funding from Horizon2020 (Human Brain Project SGA3, Specific Grant Agreement No. 945539), BRC (#BRC704/CAP/CGW), MRC (#MR/S026088/1), Ataxia UK, Rosetrees Trust (#PGL22/100041 and #PGL21/10079). CGWK is a shareholder in Queen Square Analytics Ltd.
References
[1] Schweser, F., Deistung, A., Lehr, B. W., Sommer, K., & Reichenbach, J. R. (2011, May). SEMI-TWInS: simultaneous extraction of myelin and iron using a T2*-weighted imaging sequence. In Proceedings of the 19th Meeting of the International Society for Magnetic Resonance in Medicine (p. 120).[2] Jingjia Chen et al. “Decompose quantitative susceptibility mapping (QSM) to sub-voxel diamagnetic and paramagnetic components based on gradient-echo MRI data”. In: NeuroImage 242 (2021), p. 118477.
[3] Julian Emmerich et al. “On the separation of susceptibility sources in quantitative susceptibility mapping: Theory and phantom validation with an in vivo application to multiple sclerosis lesions of different age”. In: Journal of Magnetic Resonance 330 (2021), p. 107033.
[4] Shin,H.G, Lee, J. et al., χ-separation: Magnetic susceptibility source separation toward iron and myelin mapping in the brain, NeuroImage, Volume 240, 2021, 118371, ISSN 1053-8119, https://doi.org/10.1016/j.neuroimage.2021.118371.
[5] Grosso et al., Subject-specific -separation method: the effect of introducing a personalised relaxometric constant Dr, ISMRM Annual meeting 2023
[6] Pfefferbaum A, Adalsteinsson E, Rohlfing T, Sullivan EV. Diffusion tensor imaging of deep gray matter brain structures: Effects of age and iron concentration. Neurobiol Aging. 2010; 31: 482–93. doi: 10. 1016/j.neurobiolaging.2008.04.013 PMID: 18513834
[7] Rulseh AM, Keller J, Tintěra J, Kožíšek M, Vymazal J. Chasing shadows: what determines DTI metrics in gray matter regions? An in vitro and in vivo study. J Magn Reson Imaging. 2013 Nov;38(5):1103-10. doi: 10.1002/jmri.24065. Epub 2013 Feb 25. PMID: 23440865.
[8] Syka M, Keller J, Klempíř J, Rulseh AM, Roth J, et al. (2015) Correlation between Relaxometry and Diffusion Tensor Imaging in the Globus Pallidus of Huntington’s Disease Patients. PLoS ONE 10(3): e0118907. doi:10.1371/journal. pone.0118907
[9] Alexander AL, Lee JE, Lazar M, Field AS. Diffusion tensor imaging of the brain. Neurotherapeutics. 2007 Jul;4(3):316-29. doi: 10.1016/j.nurt.2007.05.011. PMID: 17599699; PMCID: PMC2041910.
[10] Jensen JH, Helpern JA, Ramani A, Lu H, Kaczynski K. Diffusional kurtosis imaging: the quantification of non-Gaussian water diffusion by means of MRI. Magn Reson Med 2005; 1432 to 1440.
[11] Garyfallidis E, Brett M, Amirbekian B, Rokem A, van der Walt S, Descoteaux M, Nimmo-Smith I and Dipy Contributors (2014). DIPY, a library for the analysis of diffusion MRI data. Frontiers in Neuroinformatics, vol.8, no.8.
[12] Liu T, Liu J, de Rochefort L, et al., Morphology enabled dipole inversion (MEDI) from a single angle acquisition: comparison with COSMOS in human brain imaging. Magn Reson Med. 2011 Apr 4. doi: 10.1002/mrm.22816 / PMID: 21465541
[13] Francesco Grussu. (2021) .fragrussu/MyRelax:Public API 1.0.0 (1.0.0). Zenodo. https://doi.org/10.5281/zenodo.4561898
[14] Cardoso MJ, Modat M, et al., Geodesic Information Flows: Spatially-Variant Graphs and Their Application to Segmentation and Fusion. IEEE Trans Med Imaging. 2015 Sep;34(9):1976-88. doi: 10.1109/TMI.2015.2418298. Epub 2015 Apr 14. PMID: 25879909.
[15] Marc Modat, David M. Cash, Pankaj Daga, Gawin P. Winston, John S. Duncan, Sébastien Ourselin, "A symmetric block-matching framework for global registration," Proc. SPIE 9034, Medical Imaging 2014: Image Processing, 90341D (21 March 2014); https://doi.org/10.1117/12.2043652
[16] M. Jenkinson, C. F. Beckmann, T. E. J. Behrens, M. W. Woolrich, and S. M. Smith, “FSL,” Neuroimage, vol. 62, pp. 782–790, 2012, doi: 10.1016/j.neuroimage.2011.09.015.
[17] H P, Vinutha & Poornima, B. & Sagar, B., (2018). Detection of Outliers Using Interquartile Range Technique from Intrusion Dataset. 10.1007/978-981-10-7563
[18] Rstudio Team (2020). Rstudio: Integrated Development for R. Rstudio, PBC, Boston, MA URL: http://www.rstudio.com/.
Figures
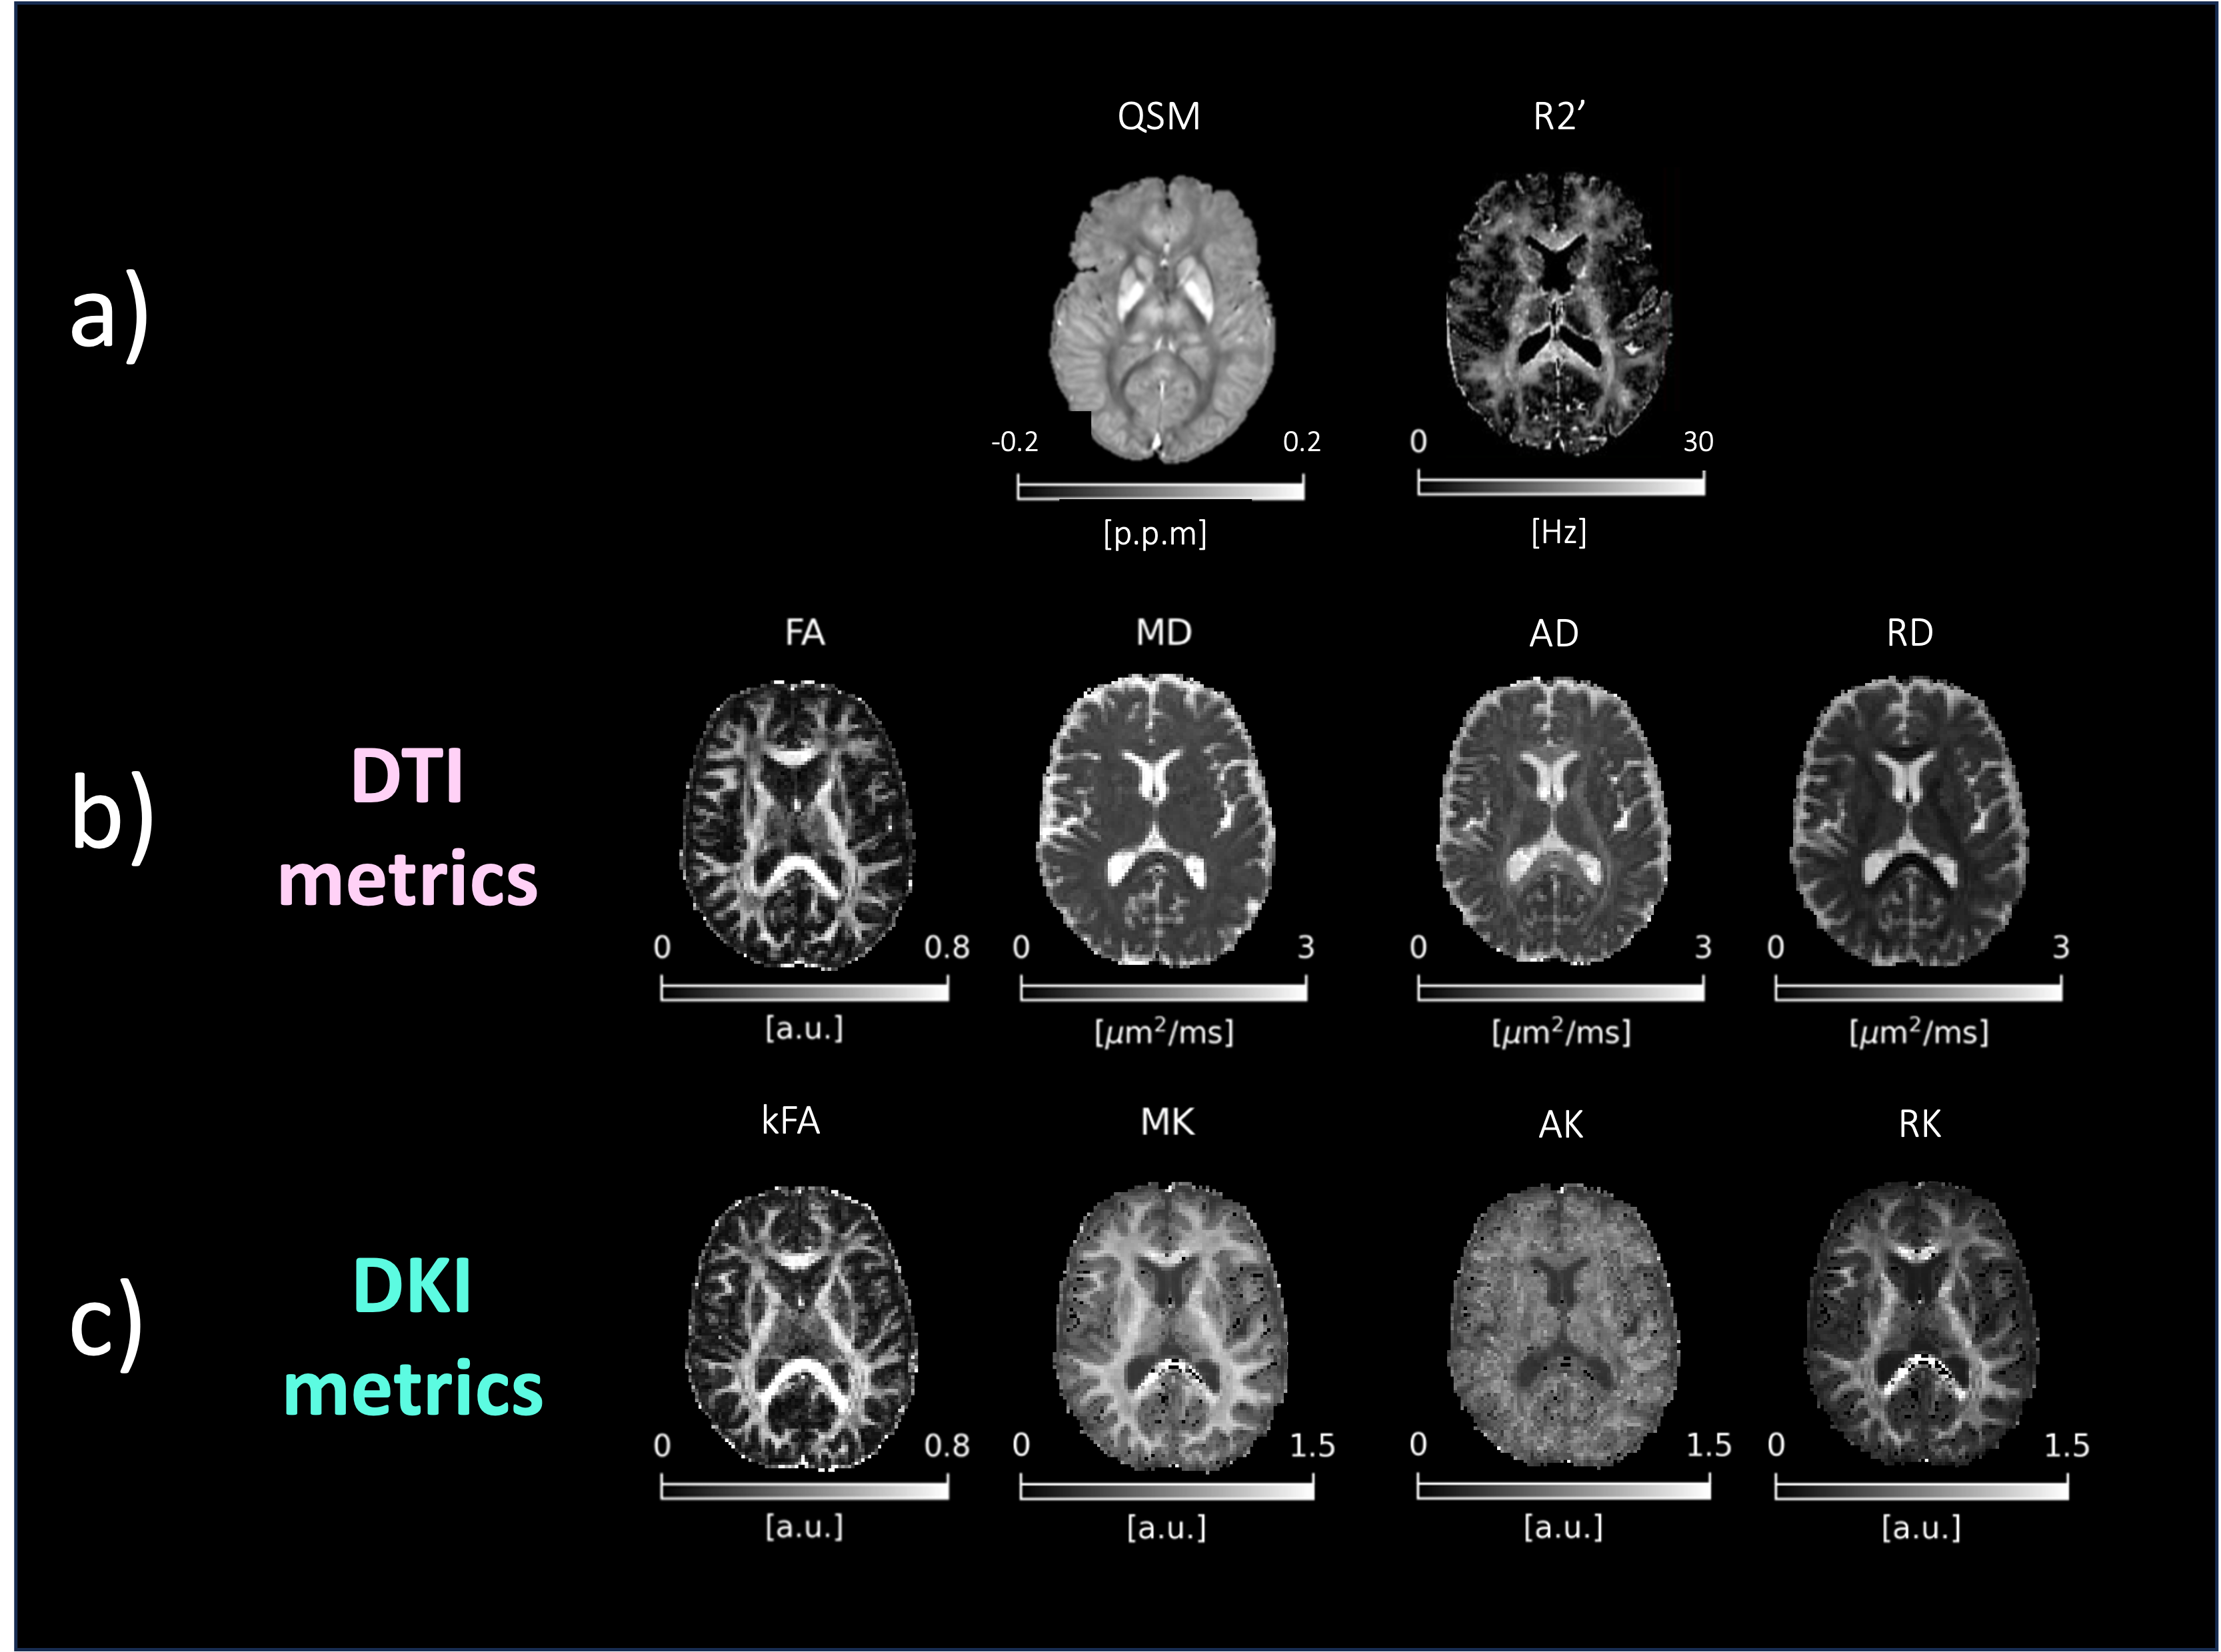
Figure 1| Maps overview. Quantitative Susceptibility map (QSM) and R2’ map used to compute the relaxometric constant Dr (a); microstructural diffusion metrics obtained with Diffusion Tensor Imaging (DTI) (b) and Diffusion Kurtosis Imaging (DKI) (c) models. DTI and DKI metrics were correlated with Dr.
DTI metrics: fractional anisotropy (FA), mean diffusivity (MD), axial diffusivity (AD), radial diffusivity (RD). DKI metrics: kurtosis fractional anisotropy (kFA), mean kurtosis (MK), axial kurtosis (AK), radial kurtosis (RK).
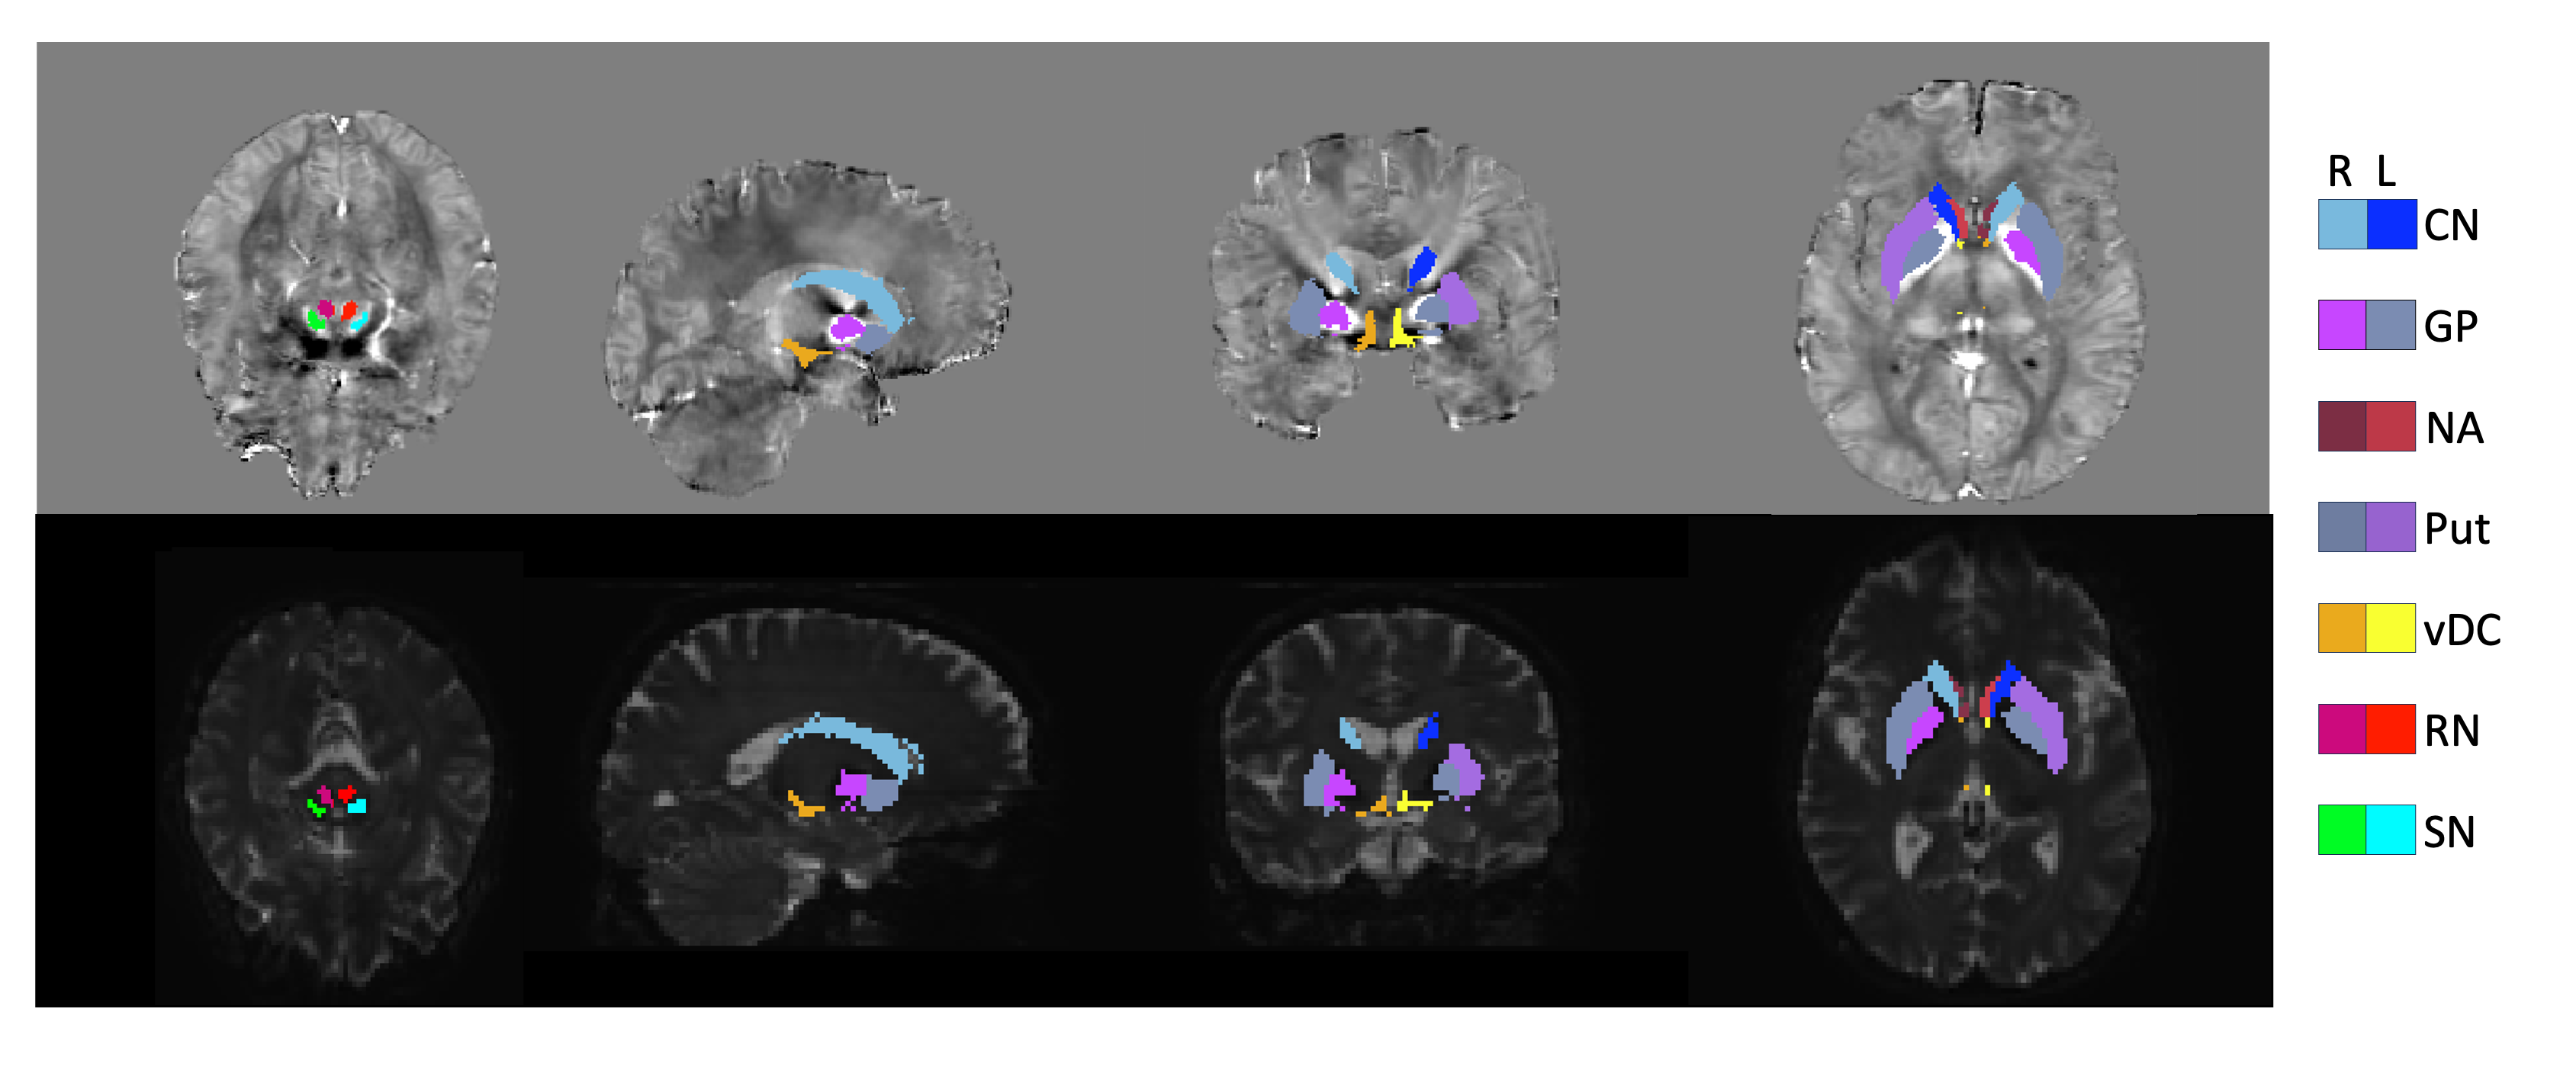
Figure 2| Deep gray matter nuclei parcellation. Deep gray matter nuclei in SPGR space, overlayed on a QSM map (top), and in diffusion space, overlaid on a b0 image (bottom). Nuclei shown here are: caudate nuclei (CN), globus pallidus (GP), nucleus accumbens (NA), putamen (Put), ventral diencephalon (vDC), red nuclei (RN) and substantia nigra (SN). R=right, L=left.
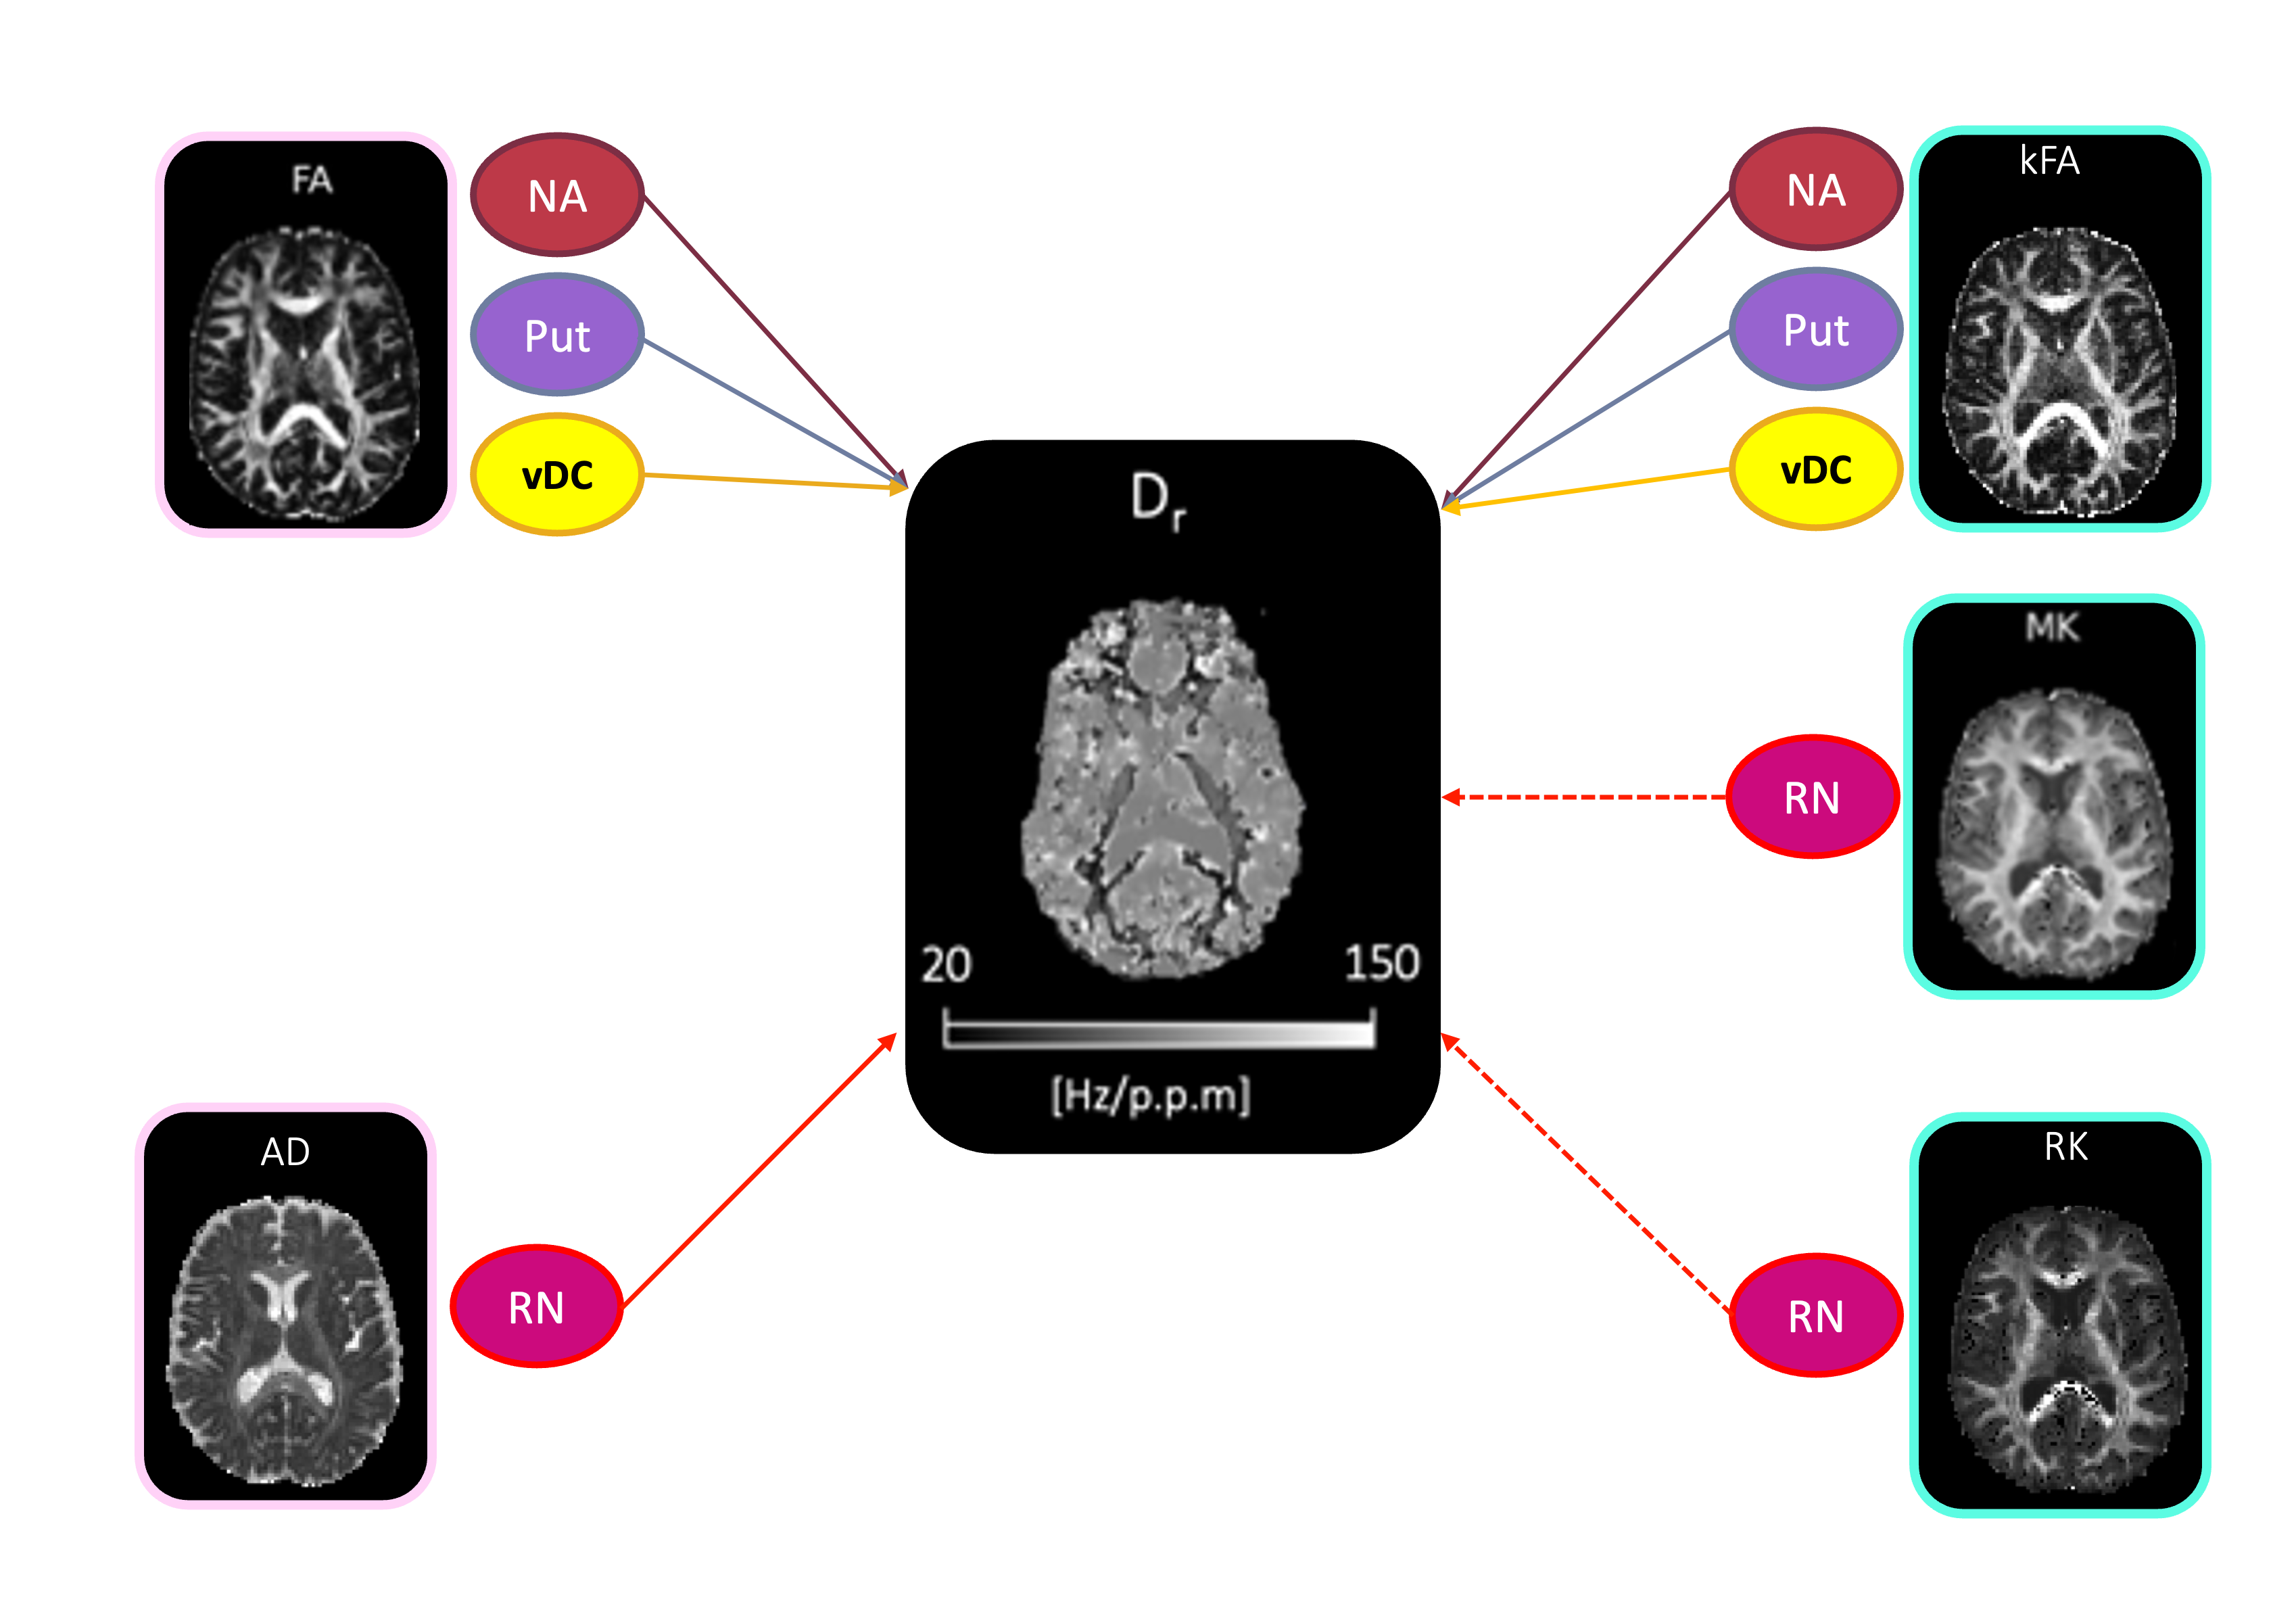
Figure 3| Dependence of the relaxometric constant Dr on diffusion metrics. All the significant (p<0.05) relations between diffusion metrics (fractional anisotropy - FA, axial diffusivity – AD, kurtosis fractional anisotropy – kFA, mean kurtosis – MK and radial kurtosis - RK) and Dr are reported. Positive correlations are represented with straight arrows, negative ones are reported with dotted arrows. NA = nucleus accumbens; RN = red nuclei; vDC = ventral diencephalon; Put = putamen.
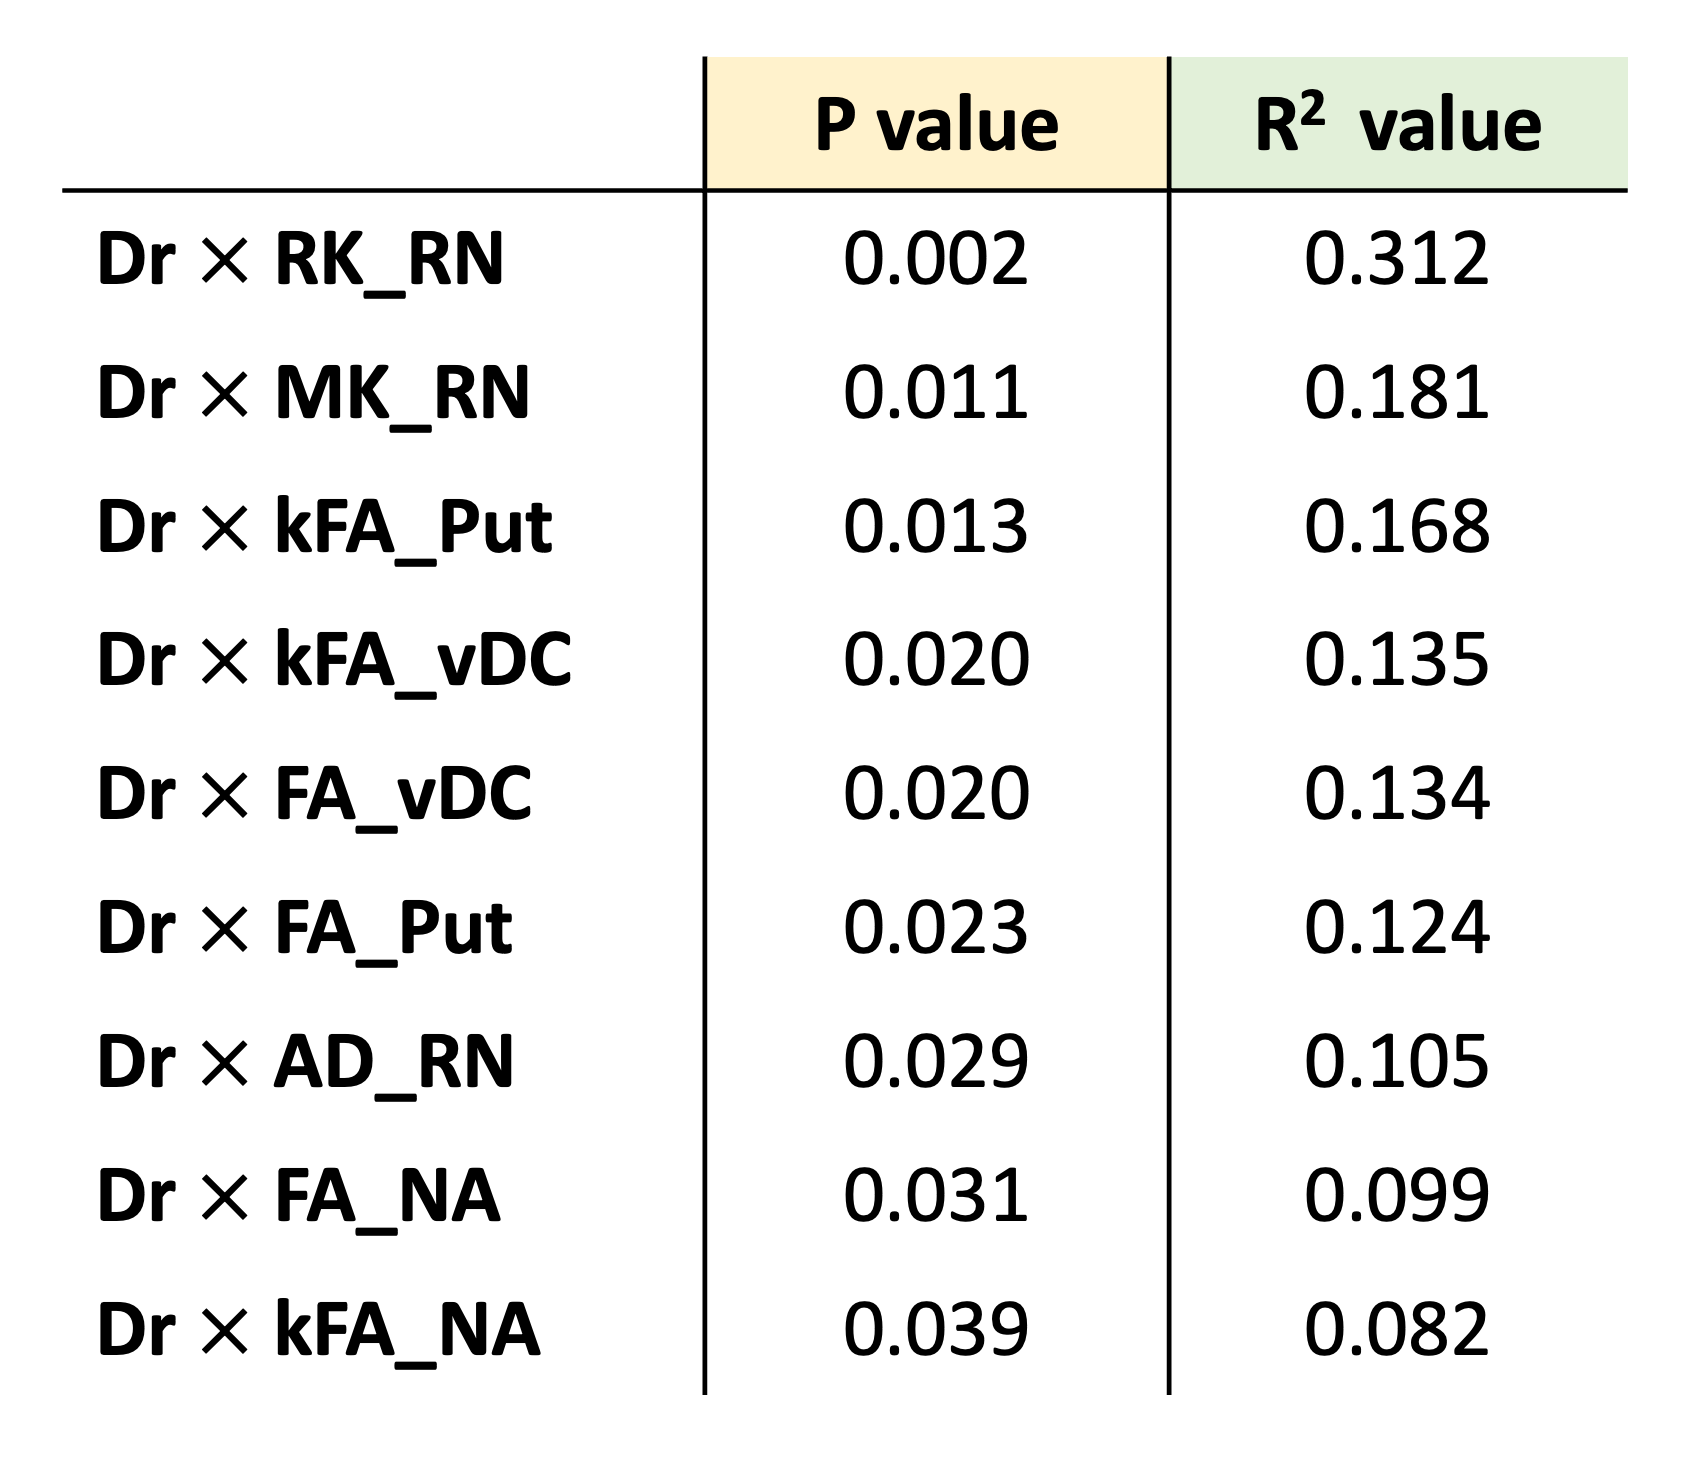
Figure 4| P-values and R2 values for correlations between the relaxometric constant Dr and diffusion metrics. Only significant correlations (p<0.05) are reported in the table, sorted in descending order with respect to R2 values that represent the goodness of fit. RK = radial kurtosis; MK = mean kurtosis; kFA = kurtosis fractional anisotropy; FA = fractional anisotropy; AD = axial diffusivity; RN = red nuclei; Put = putamen; vDC = ventral diencephalon; NA = nucleus accumbens.
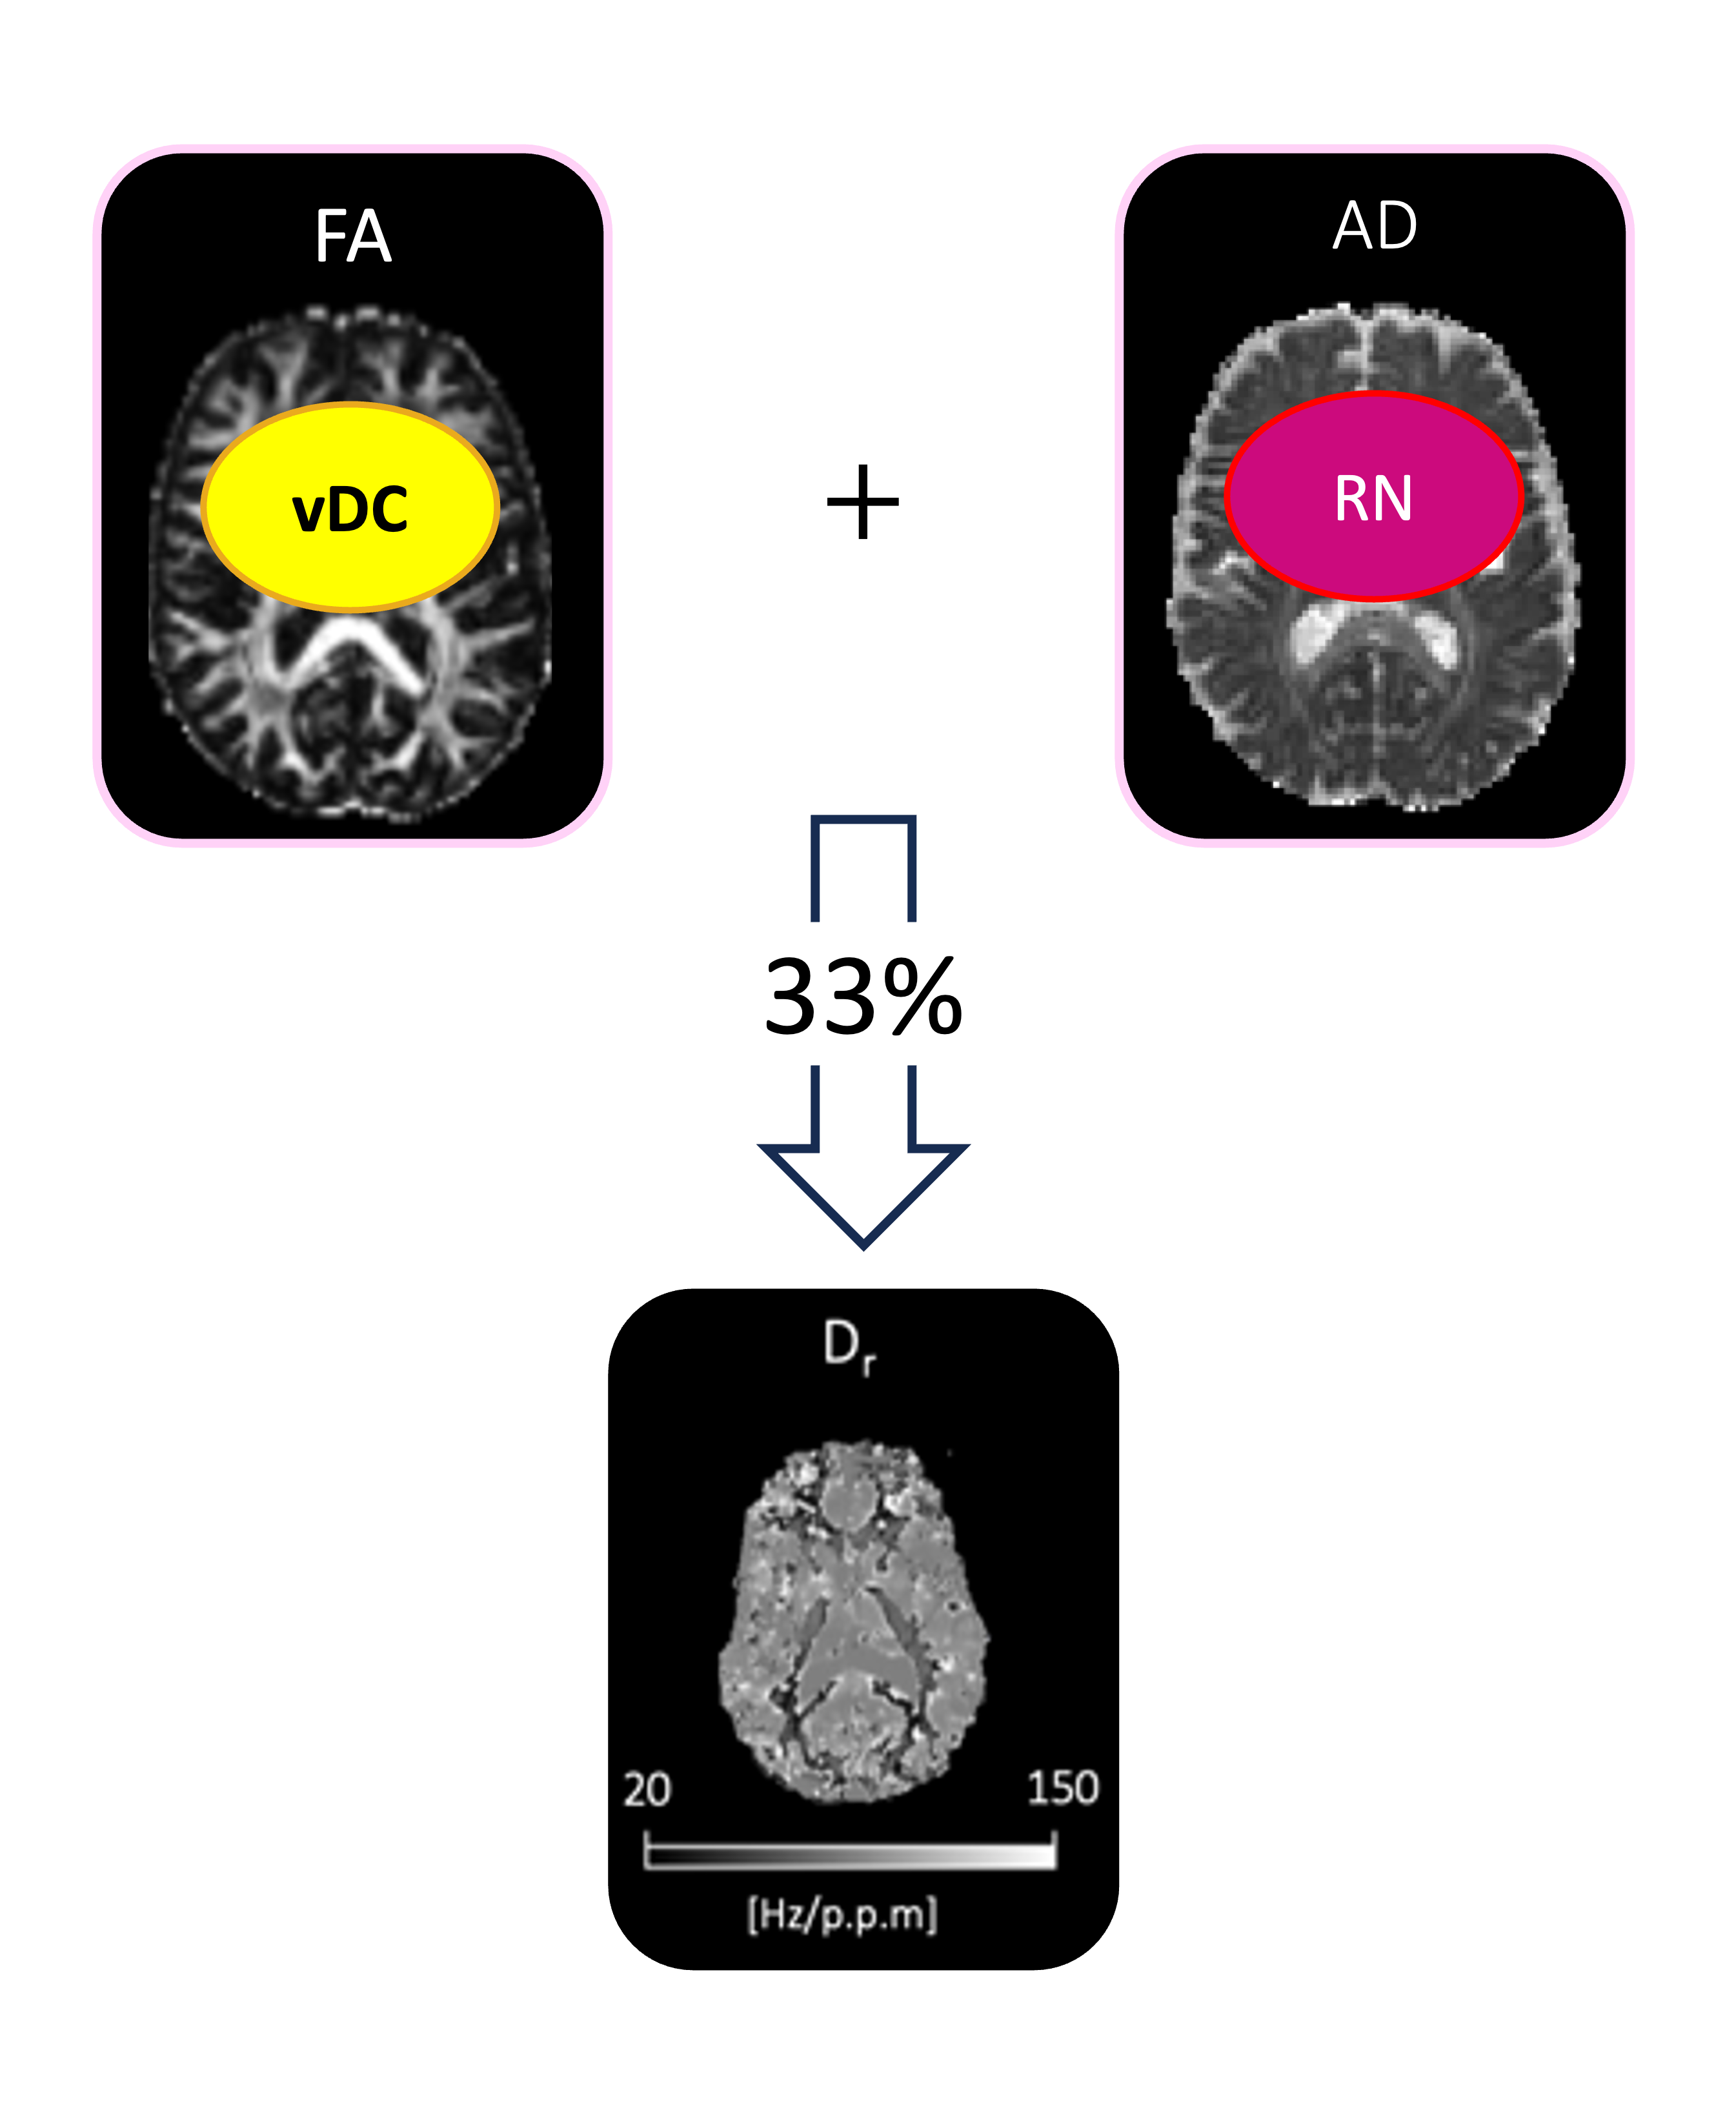
Figure 5| Best correlation model. Fractional anisotropy (FA) in the ventral diencephalon (vDC) and axial diffusivity (AD) in the red nuclei (RN) are the metrics that best explain Dr’s value, with R2=0.325.