2618
Investigating Relationships Between Brain Magnetic Susceptibility, Transfusion Treatments, and Fine Motor Function in Sickle Cell Disease1Department of Medical Physics and Biomedical Engineering, University College London, London, United Kingdom, 2Developmental Neurosciences Section, Institute of Child Health, University College London, London, United Kingdom
Synopsis
Keywords: Susceptibility/QSM, Genetic Diseases, Haematology
Motivation: Sickle cell disease (SCD) can lead to cognitive difficulties, but transfusion treatment presents a risk of iron overload which may lead to neurodegeneration. Better understanding of the impact of SCD and transfusions is needed.
Goal(s): To use quantitative susceptibility mapping (QSM) to assess iron deposition in the brain in SCD with and without transfusions.
Approach: Brain susceptibility was quantified in 28 SCD patients and 16 healthy controls using QSM and related to fine motor function by a general linear model.
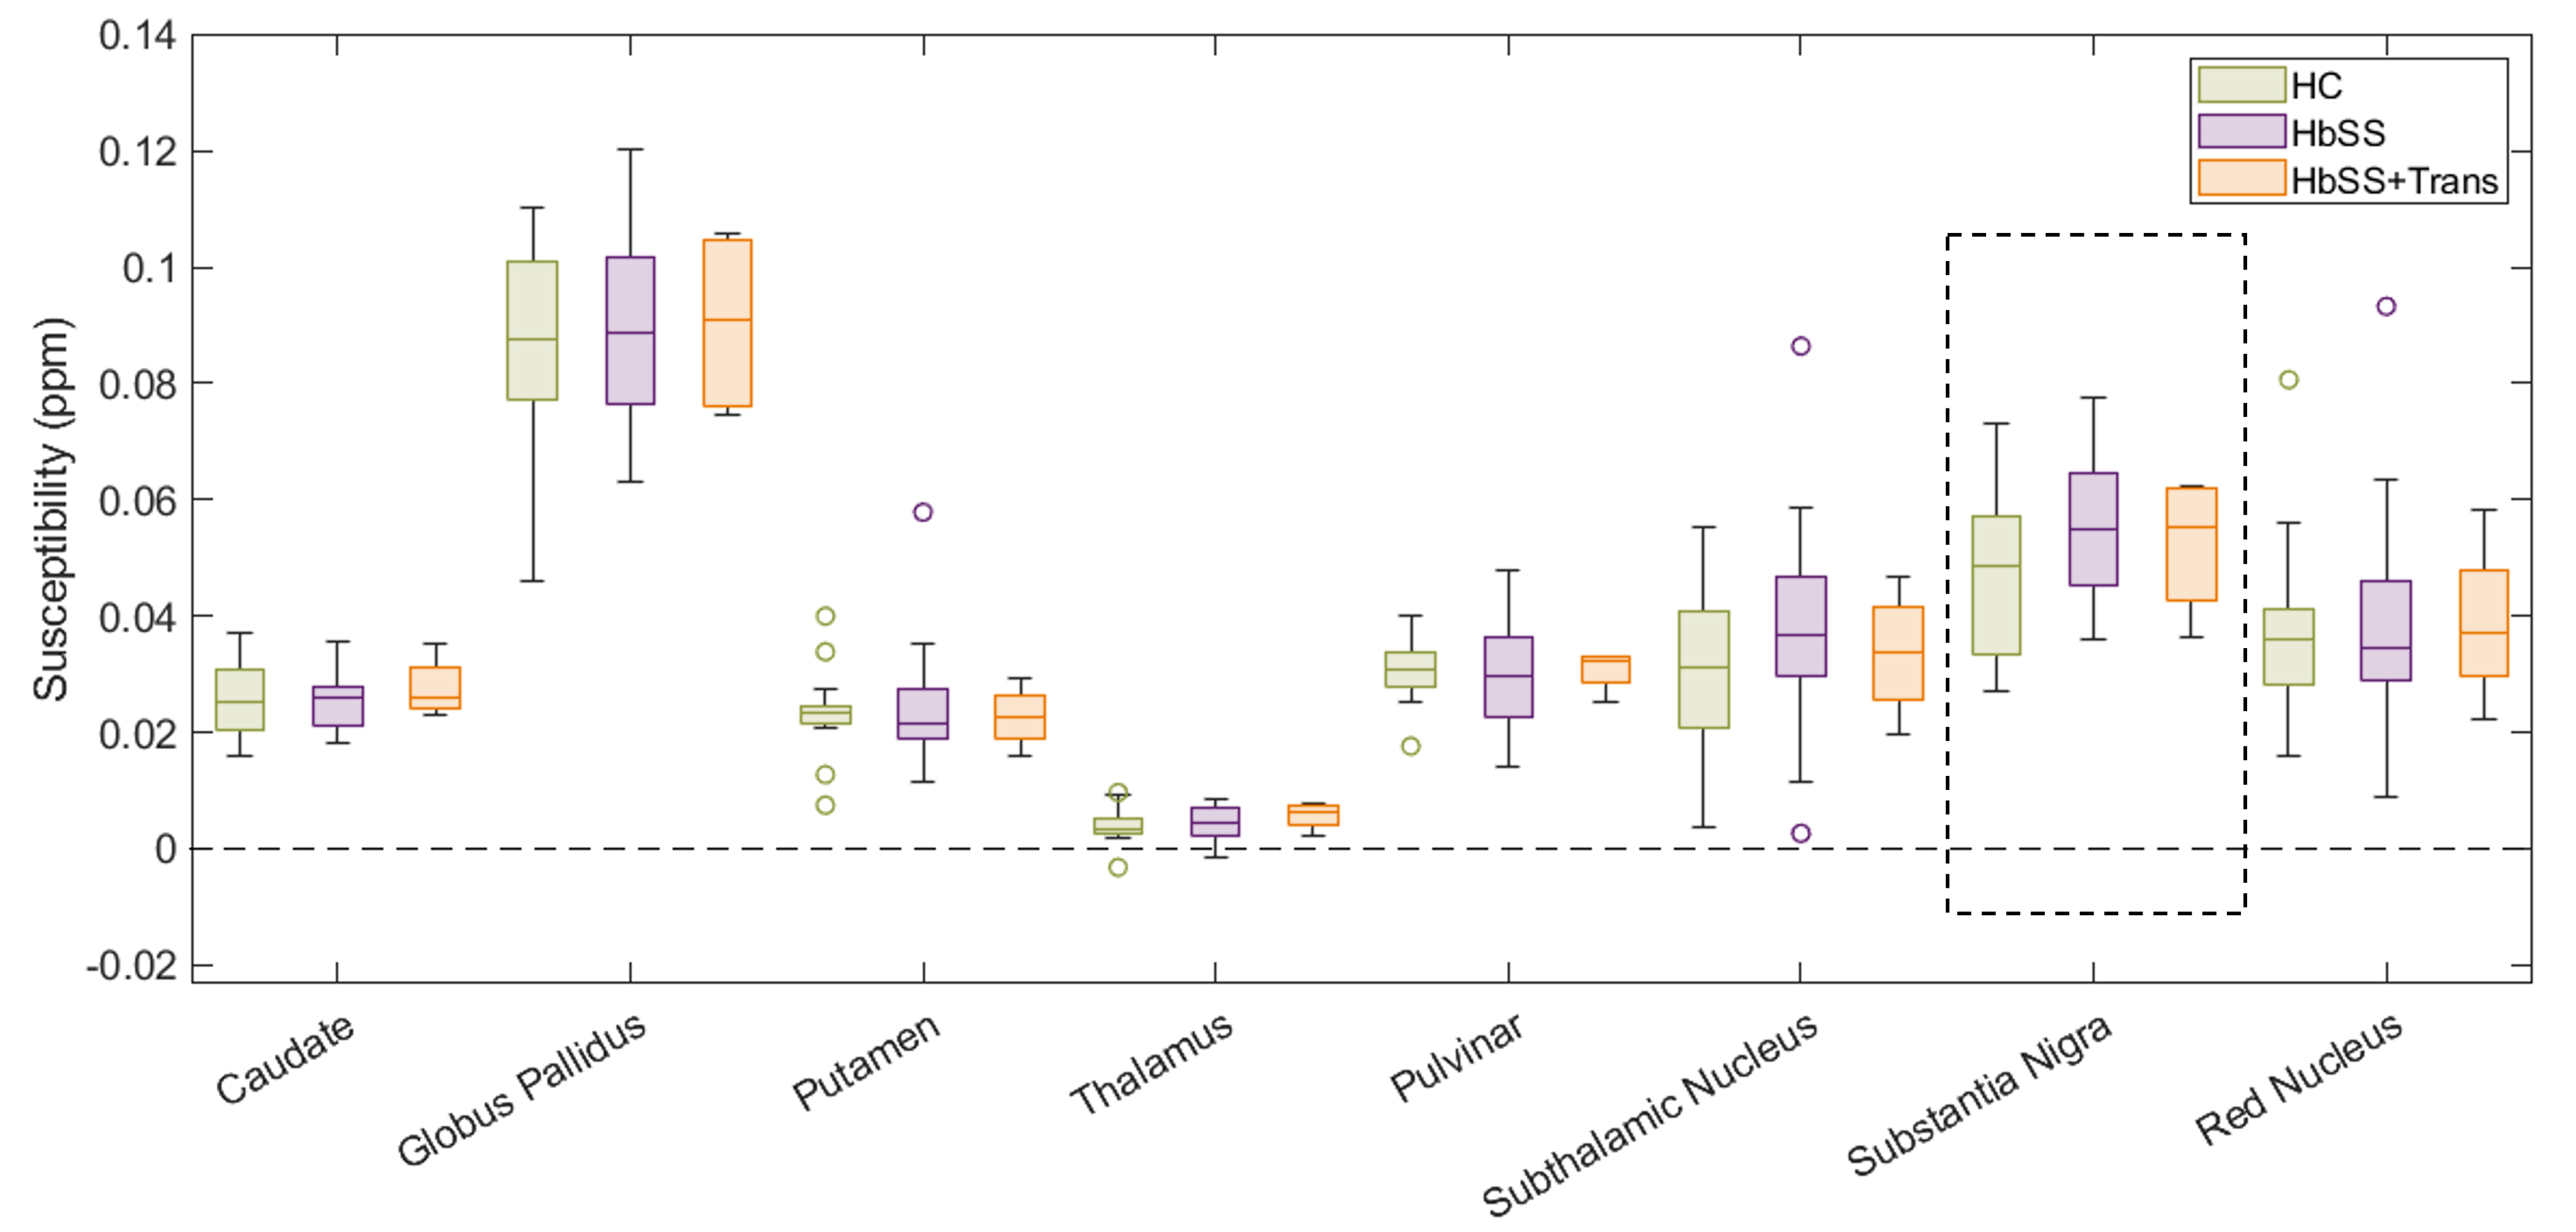
Results: Susceptibilities in deep brain structures were not correlated with transfusions, SCD status (except in substantia nigra), or motor function (except in pulvinar).
Impact: Using an up-to-date QSM reconstruction pipeline reduced noise and artefacts and revealed correlations of susceptibility with age which were not found previously in these data, confirming the importance of correct coil combination for QSM studies.
Introduction
Homozygous sickle cell anaemia (HbSS) is the most common and severe form of sickle cell disease (SCD)1 and may cause pain, anaemia, repeated infections, stroke, and progressive cognitive difficulties.2,3 HbSS patients are often treated with regular blood transfusions; however, this presents a risk of iron overload which can lead to neurodegeneration.4,5 Quantitative susceptibility mapping (QSM)6,7 has been validated as a means to measure tissue iron content,8-11 and has been used in assessing iron overload in SCD patients.5 Previous work has shown susceptibility ($$$\chi$$$) differences in deep-brain regions in HbSS patients relative to healthy controls12-14 and an association between cognitive ability and brain iron content measured by QSM.15 However, little work has been done investigating relationships between $$$\chi$$$ and cognitive function in SCD under different treatment conditions.16 We optimized a QSM reconstruction pipeline and investigated the relationship between $$$\chi$$$ in deep-brain ROIs and SCD status and treatment.Methods
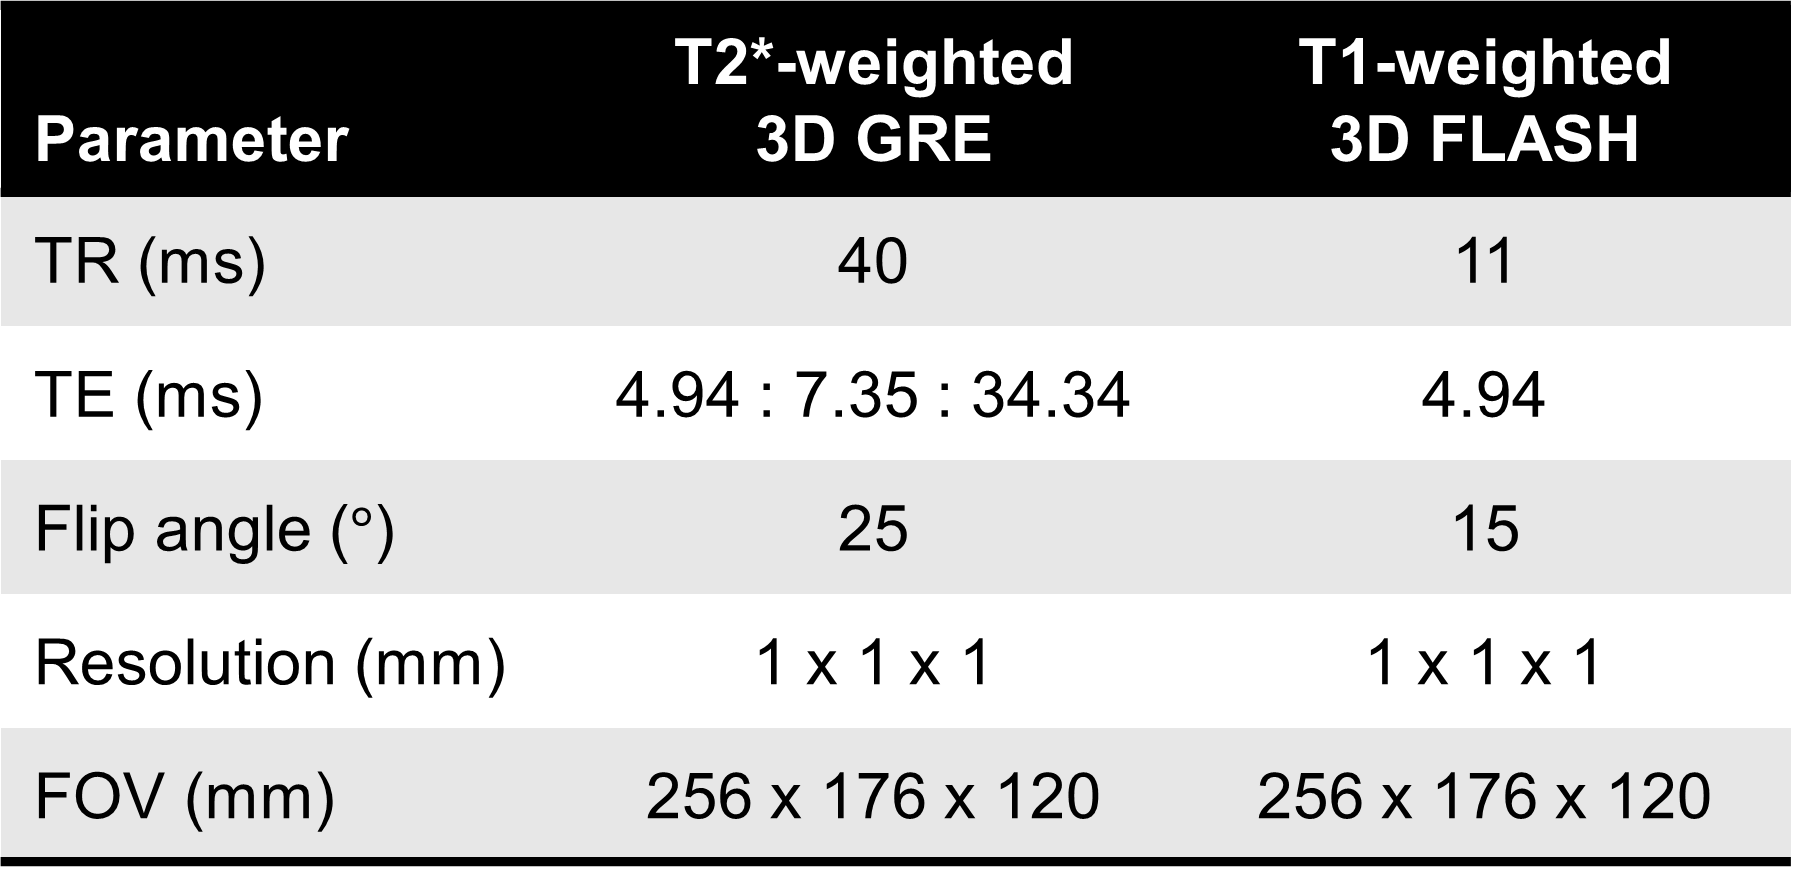
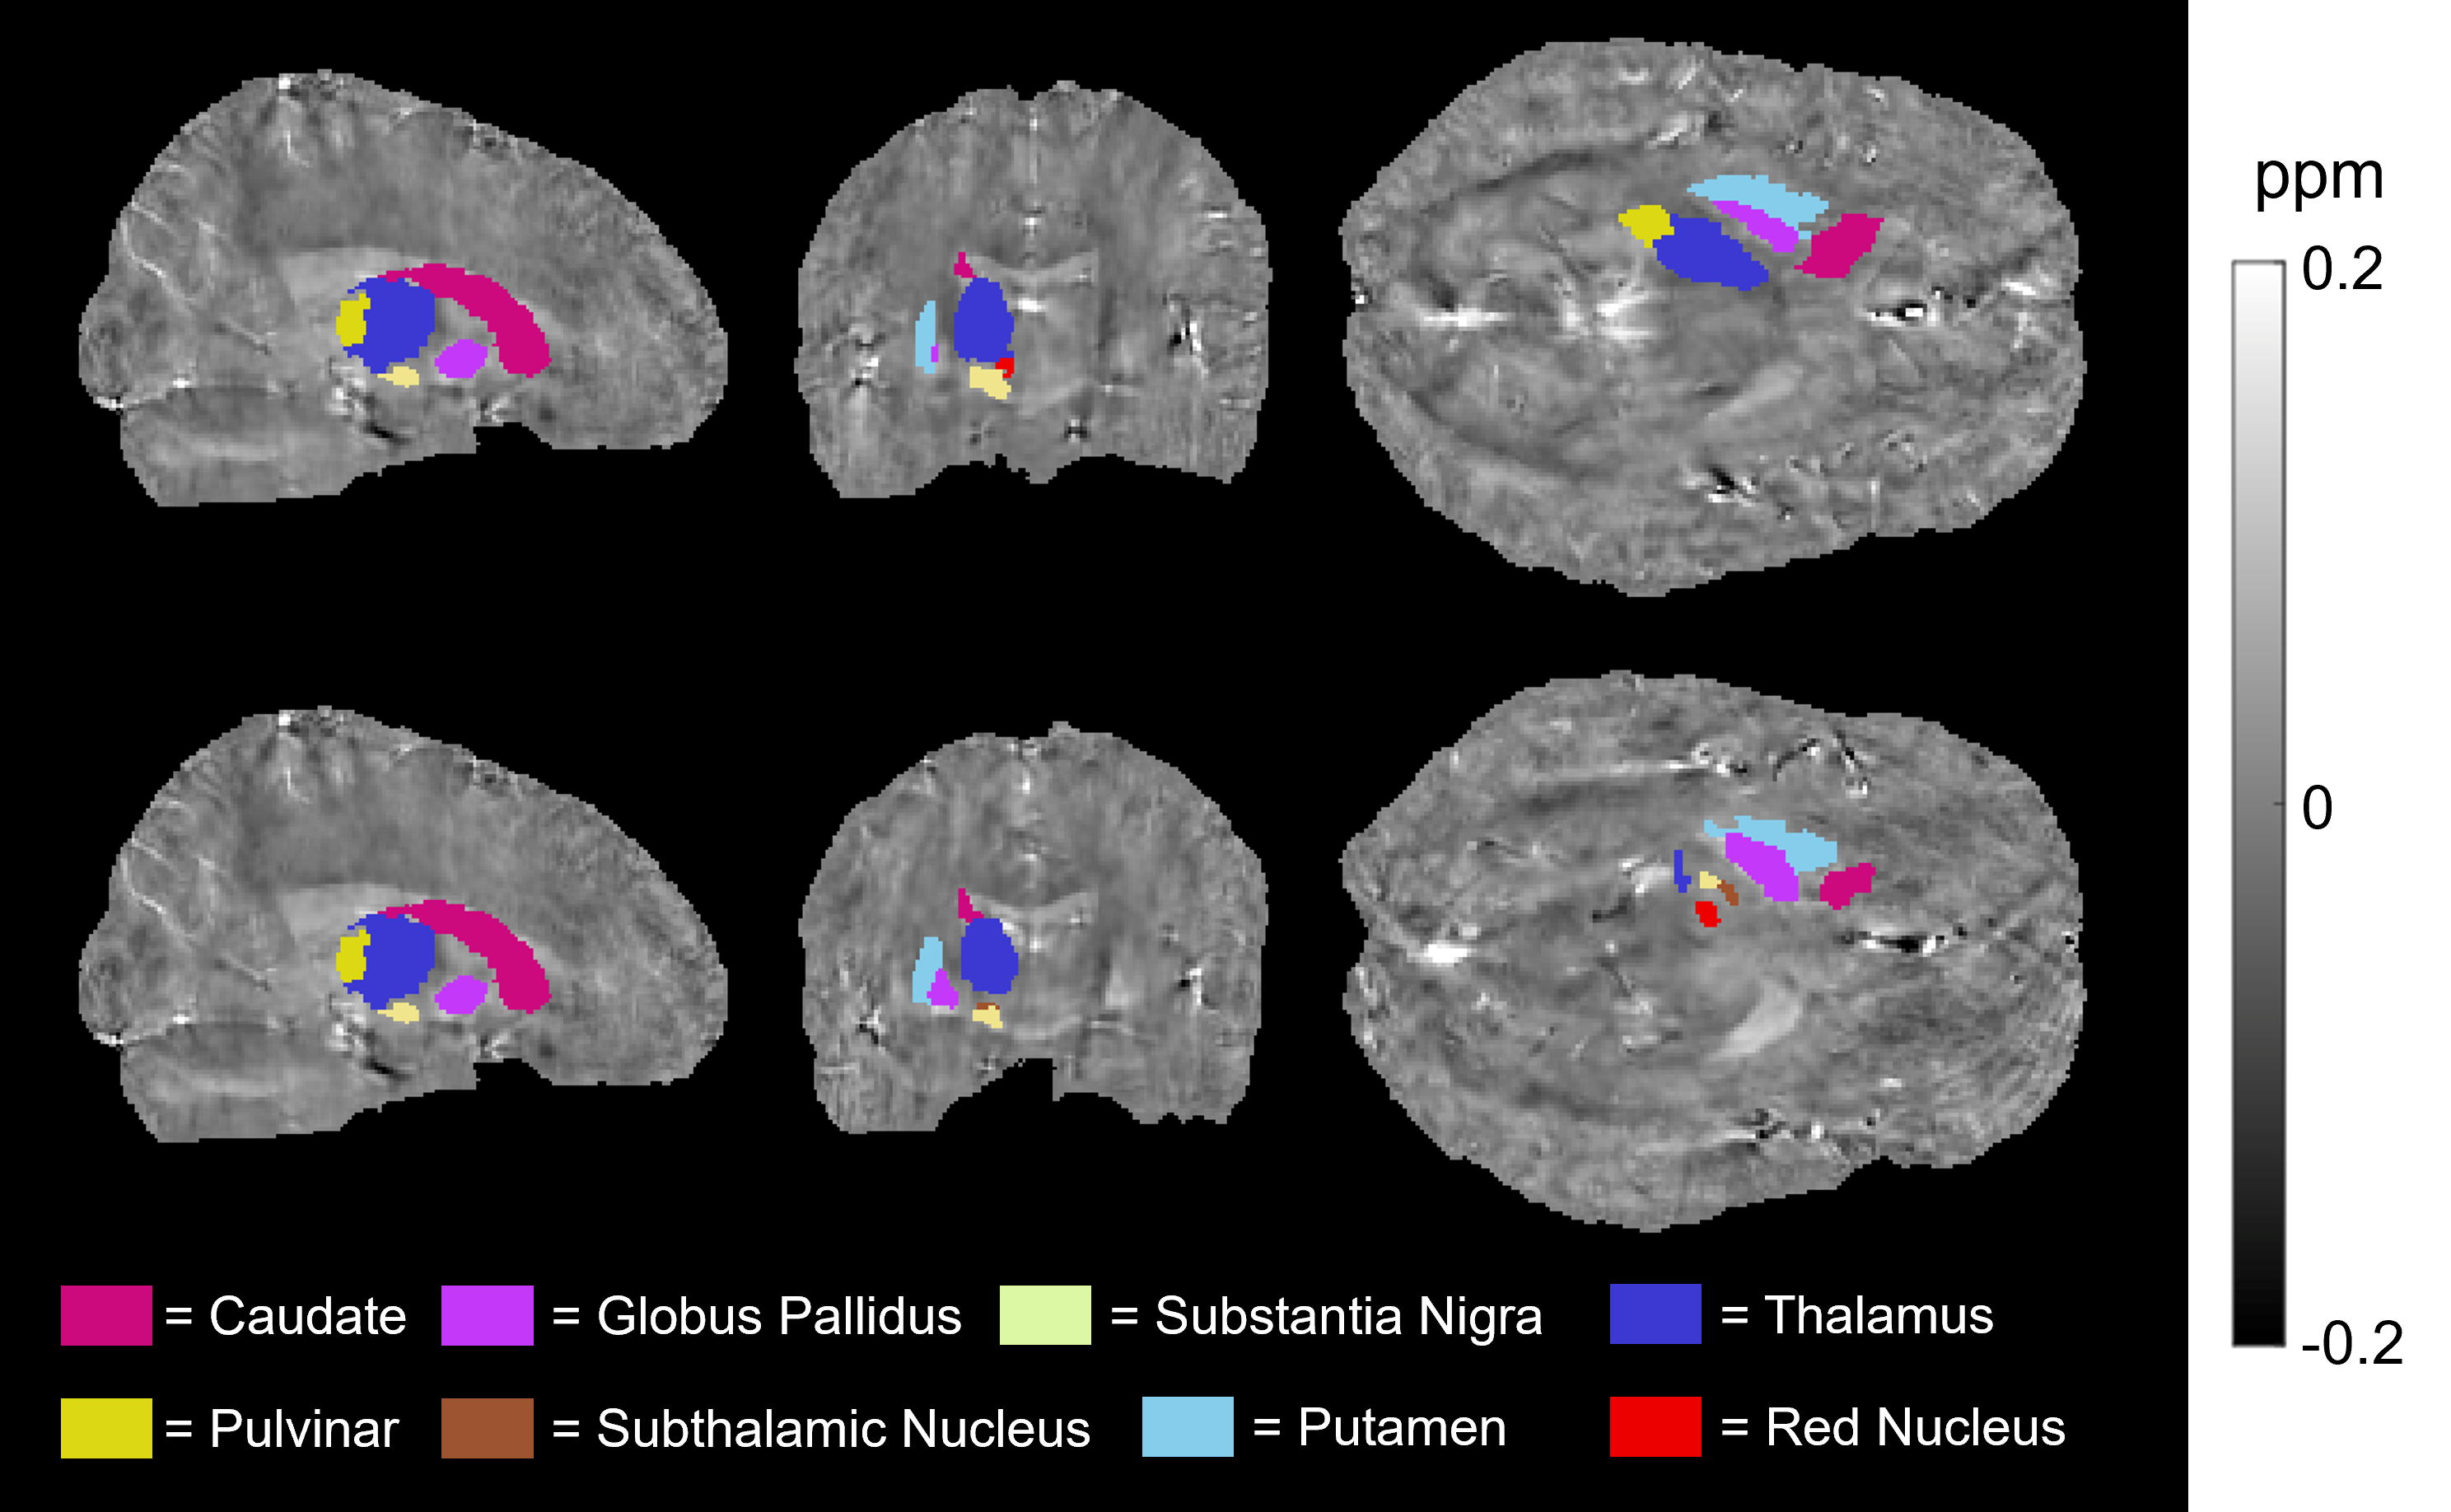
Data were acquired under local ethics committee approval as part of a previous study.12 The cohort consisted of 29 children and young adults with HbSS (of which 4 were receiving regular transfusions) and 18 sibling and familial controls (HC). One HbSS and two HC subjects were excluded due to severe image artefacts. A T2*-weighted multi-echo 3D GRE and a T1-weighted 3D FLASH were acquired on a 1.5 T Siemens system (Erlangen, Germany), with parameters shown in Figure 1. As a measure of fine motor function, subjects completed the pegboard subtest of the Zurich Neuromotor Assessment,17 with two trials per hand.QSMs were calculated from 3D-GRE data using the following pipeline. To remove phase singularities18 due to incorrect coil combination evident in a previous study,12 raw k-space data were reconstructed offline for each coil and combined using ASPIRE.19 Phase inconsistencies were corrected.20 and complex data were de-noised using MP-PCA21 before non-linear fitting20 and unwrapping using SEGUE.22 A brain mask was created from the GRE magnitude data using FSL BET23 and eroded by 2 voxels. Background fields were removed using V-SHARP.24 QSMs were calculated using an iterative Tikhonov-regularized algorithm,25 with regularization parameter $$$\alpha=0.05$$$ (determined through L-curve analysis). Within-ROI $$$\chi$$$ standard deviations ($$$SD_{\chi}$$$) were compared with those from the previously reported pipeline12 as a measure of reliability. Mean $$$\chi$$$ values in 8 bilateral ROIs (Figure 2) were extracted from QSMs using MRIcloud,26,27 informed by the T1-weighted images.
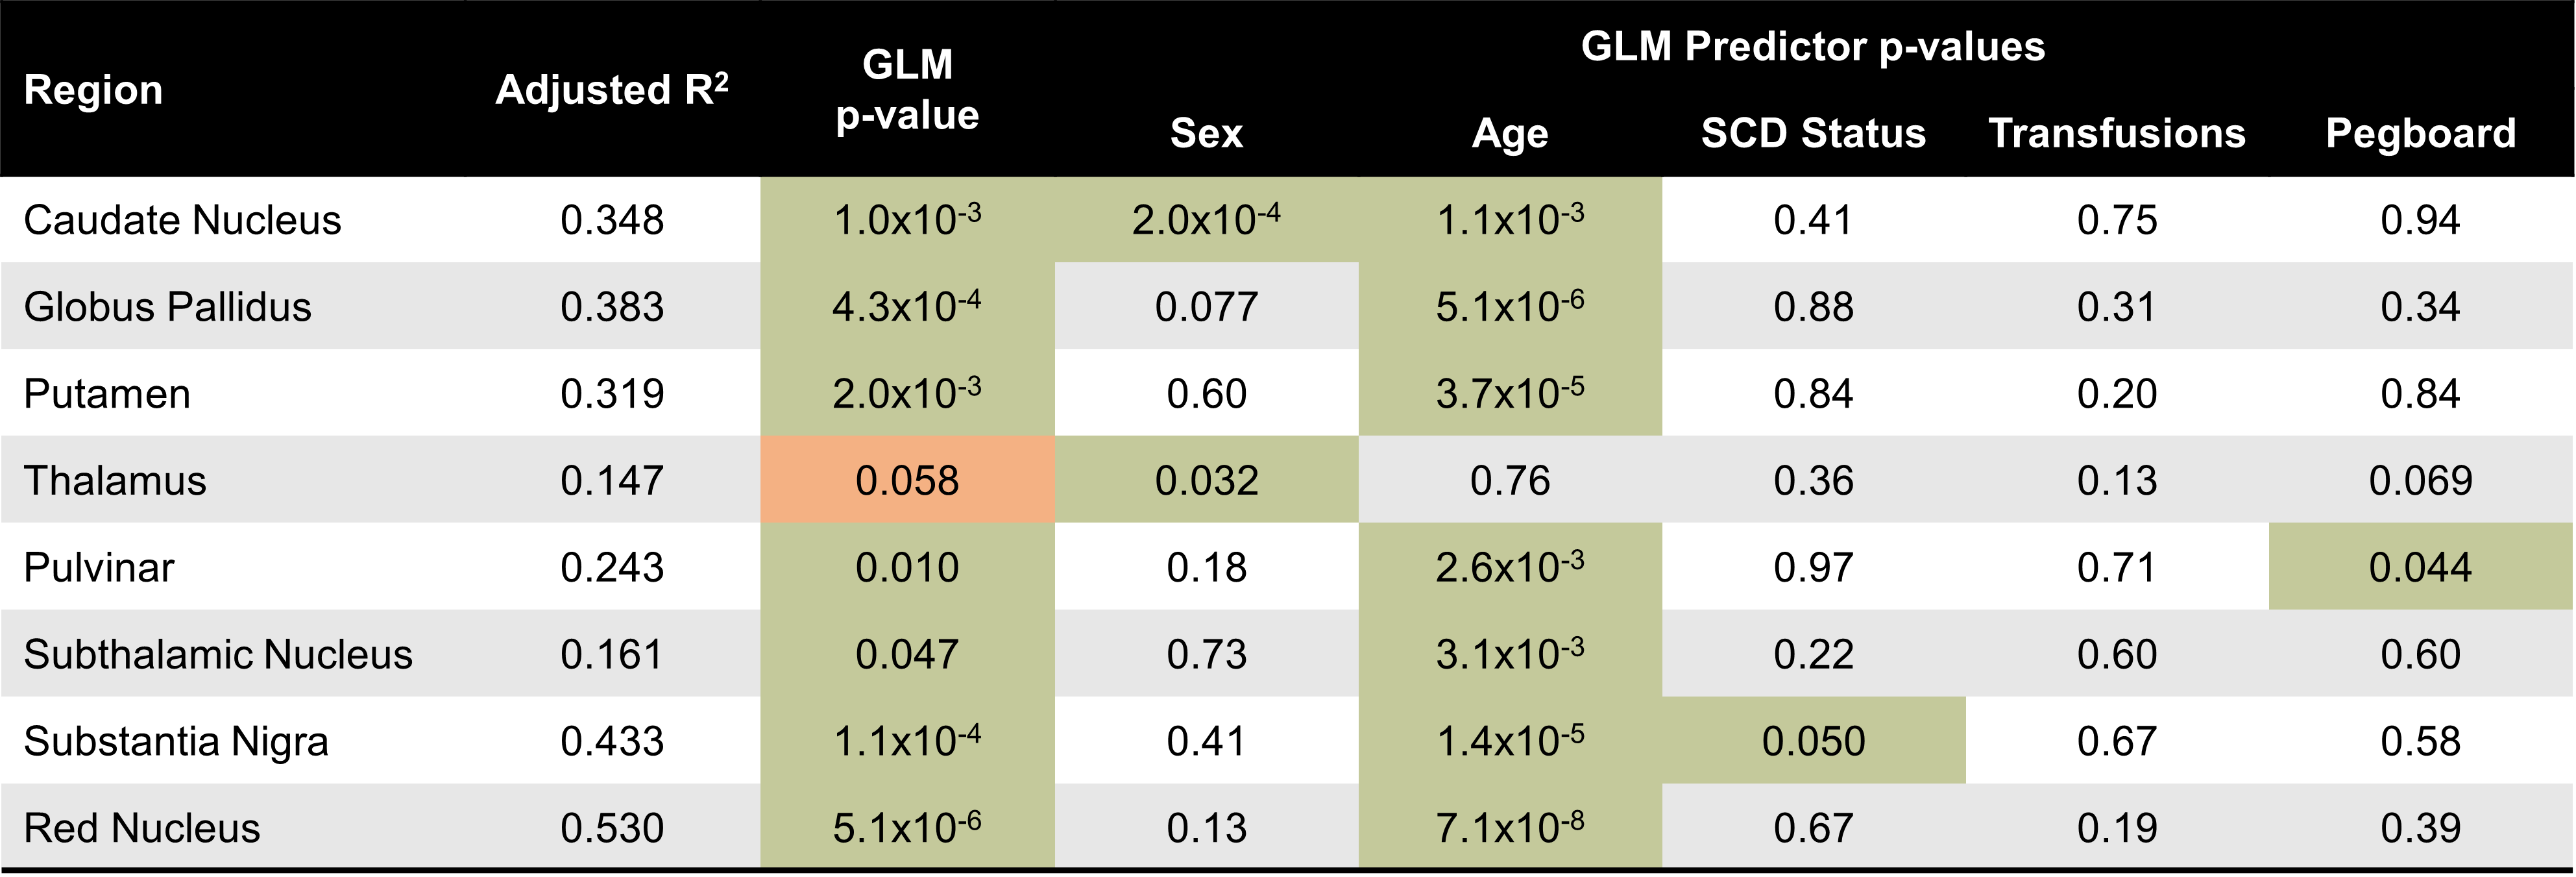
A general linear model (GLM) was used to model mean ROI $$$\chi$$$ as a function of fixed covariates {age, SCD status (including transfusions), pegboard test score}. Goodness of fit was evaluated with an F-test, and t-tests were performed on each coefficient to identify those contributing significantly to each model. All analyses were performed in MATLAB (MathWorks, Natick, MA).
Results
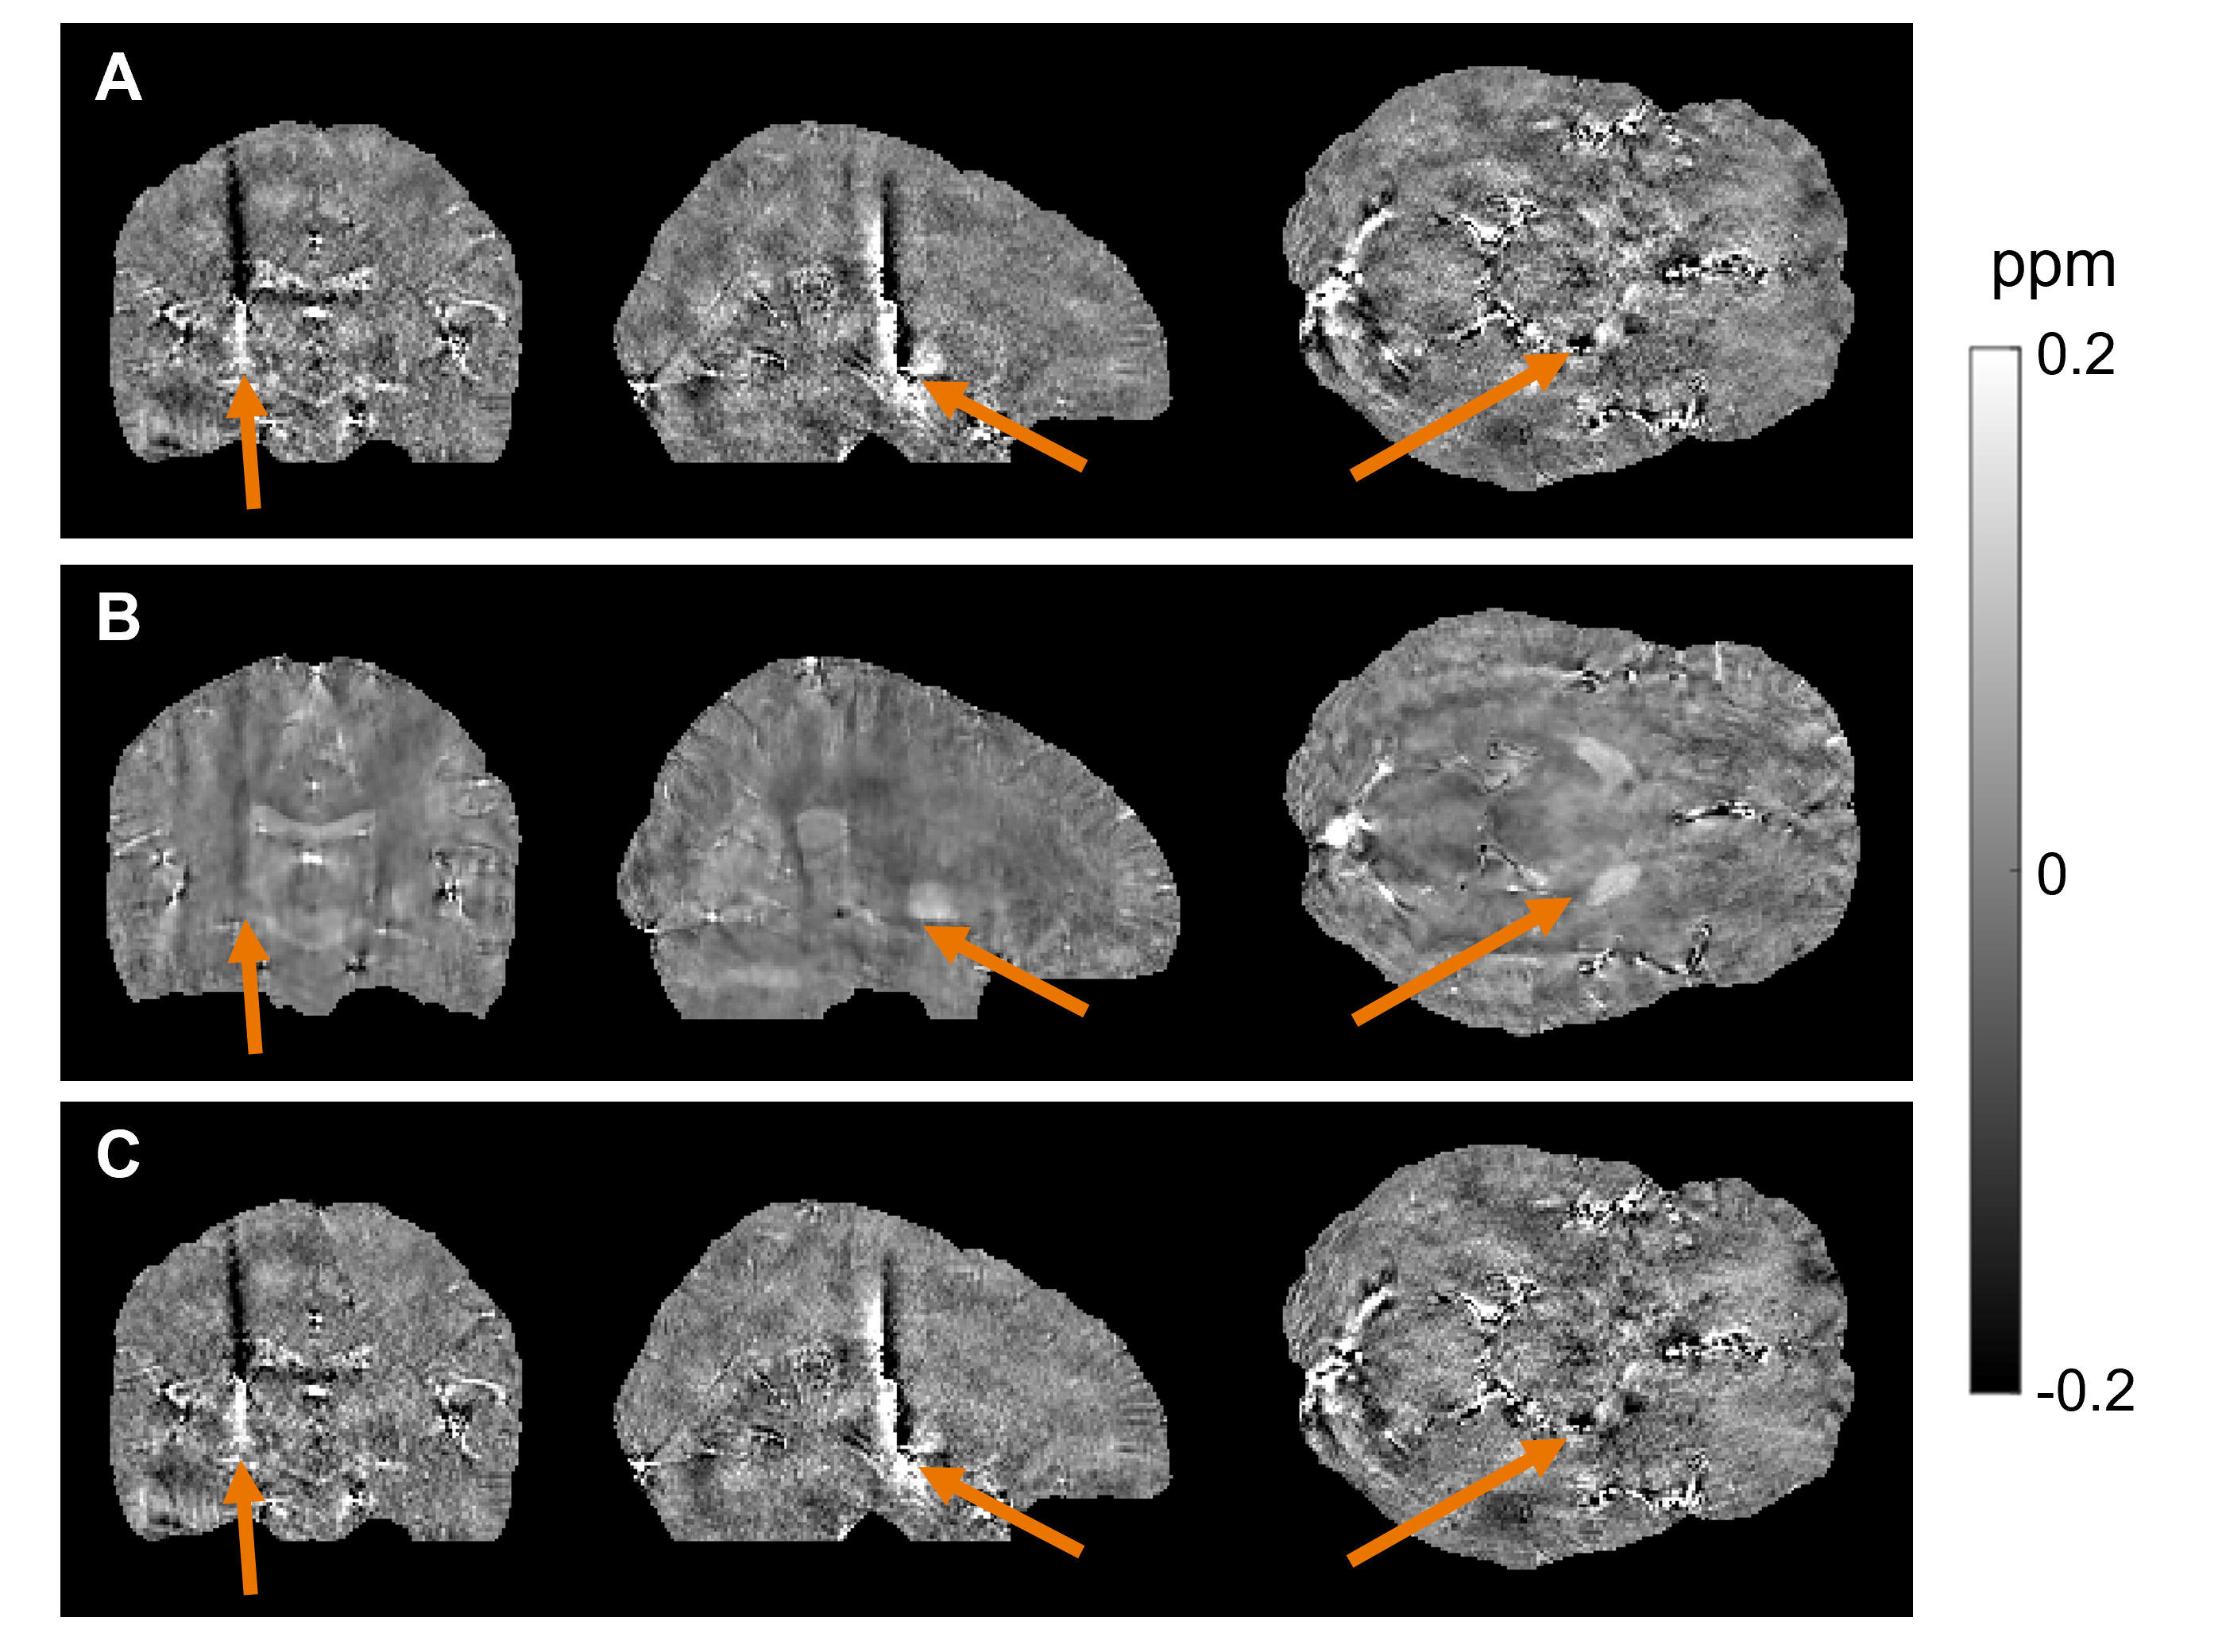
Deep brain structures had an average $$$SD_{\chi}=0.032\pm0.012$$$ppm compared to $$$0.058\pm0.010$$$ppm using the previously reported pipeline.12 Figure 3 shows example QSMs from both pipelines from a single subject.Figure 4 shows the distribution of uncorrected mean $$$\chi$$$ values in 8 ROIs across HC, HbSS, and HbSS with transfusions groups. The GLM was statistically significant (p<0.01) in every ROI but one (thalamus). In the remaining 7 ROIs, age was the most significant covariate, and only in the substantia nigra was SCD status also a positive significant predictor of $$$\chi$$$ (p<0.05). Sex was a significant predictor of $$$\chi$$$ in the caudate, and a significant negative correlation between pegboard score and $$$\chi$$$ was found in the pulvinar. In all other cases, SCD status, transfusions, and pegboard score were not significant covariates.
Discussion & Conclusion
An optimized QSM reconstruction pipeline was applied to data from HbSS patients and healthy controls, resulting in QSMs with significantly (p<0.001) lower variance of $$$\chi$$$ within deep-brain ROIs than the previously reported pipeline.12 The new QSMs are less noisy and contain fewer artefacts, suggesting that they provide more reliable results.GLM analyses showed that SCD status was not a significant predictor of deep-brain $$$\chi$$$ values, except in the substantia nigra, nor was treatment by transfusion. This is different from previous studies which found that, in SCD patients, $$$\chi$$$ was significantly different in the caudate nucleus,5,14 globus pallidus,12-14 putamen,13 and red nucleus.14 There was a significant relationship between fine motor skill and susceptibility in the pulvinar, consistent with other work.15 Further work is needed to validate the utility of QSM in assessing the impact of SCD and its treatments on the brain.
As expected,28-30 age was found to be a statistically significant covariate of $$$\chi$$$ in every ROI. This relationship was not detected in the same data reconstructed using an older pipeline,12 highlighting the impact of QSM reconstruction artefacts on later analyses.
Acknowledgements
MTC is funded by CRUK multidisciplinary award 24348. KS is funded by ERC consolidator grant DiSCo MRI SFN 770939.References
- Streetly A., Latinovic R., Henthorn J. (2010). “Positive screening and carrier results for the England-wide universal newborn sickle cell screening programme by ethnicity and area for 2005-07.” J. Clin. Pathol. 63(7), 626-629.
- Kawadler J.M., Clayden J.D., Clark C.A., Kirkham F.J. (2016). “Intelligence quotient in paediatric sickle cell disease: a systematic review and meta-analysis.” Dev. Med. Child Neurol. 58 (7), 672-679. doi:10.1111/dmcn.13113
- Debaun M. R., Kirkham F. J. (2016). “Central Nervous System Complications and Management in Sickle Cell Disease.” Blood 127 (7), 829–838. doi:10.1182/blood-2015-09-618579
- Wood J.C. (2015). “Estimating tissue iron burden: current status and future prospects.” Br. J. Haematol. 170(1), 15-28. doi:10.1111/bjh.13374
- Miao X., Choi S., Tamrazi B., Chai Y., Vu C., Coates T. D., Wood J. C. (2018). “Increased brain iron deposition in patients with sickle cell disease: an MRI quantitative susceptibility mapping study.” Blood, 132(15), 1618-1621. doi:10.1182/blood-2018-04-840322.
- Shmueli K. (2020). Quantitative Susceptibility Mapping. Quantitative Magnetic Resonance Imaging. 1st ed. Amsterdam: Elsevier.
- Wang Y., Spincemaille P., Liu Z., Dimov A., Deh K., et al. (2017). “Clinical Quantiative Susceptibility Mapping (QSM) – Biometal Imaging and its Emerging Roles in Patient Care.” J. Magn. Reson. Imaging 46(4): 951-971. doi:10.1002/jmri.25693
- Schweser F., Deistung A., Lehr B.W., Reichenbach J.R. (2011). “Quantitative imaging of intrinsic magnetic tissue properties using MRI signal phase: an approach to in vivo brain iron metabolism.” NeuroImage 54(4), 2789-2807. doi:10.1016/j.neuroimage.2010.10.070.
- Langkammer C., Schweser F., Krebs N., Deistung A., Goessler W., et al. (2012). “Quantitative susceptibility mapping (QSM) as a means to measure brain iron? A post mortem validation study.” NeuroImage, 62(3), 1593-1599. doi:10.1016/j.neuroimage.2012.05.049
- Zheng W., Nichol H., Liu S., Cheng Y.C., Haacke E.M. (2013). “Measuring iron in the brain using quantitative susceptibility mapping and X-ray fluorescence imaging.” NeuroImage, 78, 68–74. doi:10.1016/j.neuroimage.2013.04.022
- Duyn, J. H., and Schenck, J. (2017). “Contributions to magnetic susceptibility of brain tissue.” NMR Biomed. 30, 3546. doi:10.1002/nbm.3546.
- Shmueli K., Kawadler J. M., Carmichael D., Clark C. A., Kirkham F. J. (2015). “Susceptibility Mapping in Sickle Cell Anaemia Patients With and Without Chronic Blood Transfusions.” Proc ISMRM, Toronto, ON, Canada, 23, 286.
- Murdoch R. (2022). Developing MRI Quantitative Susceptibility Mapping to Investigate the Effect of Sickle Cell Anaemia on Brain Magnetic Susceptibility [Doctoral thesis]. University College London
- Lee M., Murdoch R., Jakob M., Kirkham F., Shmueli K. (2023). “Investigating Regional Changes in Brain Magnetic Susceptibility in Tanzanian Children with Sickle Cell Anaemia at 1.5 Tesla.” Proc ISMRM, Toronto, ON, Canada, 31, 3367.
- Carpenter K.L.H., Li W., Wei H., Wu B., Xiao X., Liu C., Worley G., Egger H.L. (2016). “Magnetic susceptibility of brain iron is associated with childhood spatial IQ.” NeuroImage, 132, 167-174. doi:10.1016/j.neuroimage.2016.02.028
- Stotesbury H., Kawadler J. M., Saunders D. E., Kirkham F. J. (2021). “MRI Detection of Brain Abnormality in Sickle Cell Disease.” Expert Rev. Hematol. 14 (5), 473–491. doi:10.1080/17474086.2021.1893687
- Largo R.H., Rousson V., Caflisch J.A., Jenni O.G. (2007). Zurich Neuromotor Assessment. AWE Verlag: Zurich.
- Jellus V., Kannengiesser S.A.R. (2014). “Adaptive Coil Combination Using a Body Coil Scan as Phase Reference.” Proc ISMRM, Milan, Italy, 22, 4406.
- Eckstein K, Dymerska B, Bachrata B, et al. (2018). “Computationally Efficient Combination of Multi-channel Phase Data From Multi-echo Acquisitions (ASPIRE).” Magn. Reson. Med. 79(6):2996-3006. doi:10.1002/mrm.26963
- Liu T., Wisnieff C., Lou M., Chen W., Spincemaille P., Wang Y. (2013). “Nonlionear formulation of the magnetic field to source relationship for robust quantitative susceptibility mapping.” Magn. Reson. Med. 69, 467-76. doi:10.1002/mrm.24272
- Doniza L., Stern N., Radunsky D., Helft C., Fuchs P., Karsa A., Shmueli K., Ben-Eliezer N. (2023). “MP-PCA image denoising technique for high resolution quantitative susceptibility mapping (QSM) of the human brain in vivo.” Proc. ISMRM, Toronto, ON, Canada, 32, 2948
- Karsa A., Shmueli K. (2019). “SEGUE: A Speedy rEgion-Growing Algorithm for Unwrapping Estimated Phase.” IEEE Trans Med Imaging, 38(6):1347-1357. doi:10.1109/TMI.2018.2884093
- Smith S. M. (2002). “Fast robust automated brain extraction.” Human Brain Mapping, 17(3): 143-155.
- Wu B., Li W., Guidon A., Liu C., 2011. “Whole brain susceptibility mapping using compressed sensing.” Magn. Reson. Med. 24, 1129-36. doi:10.1002/mrm.23000
- Karsa A., Punwani S., Shmueli K. (2020). “An Optimized and Highly Repeatable MRI Acquisition and Processing Pipeline for Quantitative Susceptibility Mapping in the Head-And-Neck Region.” Magn. Reson. Med. 84, 3206-3222. doi:10.1002/mrm.28377
- Mori S., Wu D., Ceritoglu C., Li Y., Kolasny A., Vaillant M.A., Faria A.V., Oishi K., Miller M.I. (2016). “MRICloud: Delivering High-Throughput Neuroinformatics as Cloud-Based Software as a Service.” Computing in Science and Engineering, 18(5), 21-35.
- Li X., Chen L, Kutten K., Ceritoglu C., Li Y., et al. (2019). “Multi-atlas tool for automated segmentation of brain gray matter nuclei and quantification of their magnetic susceptibility.” NeuroImage, 2019, 191, 337-349.
- Liu M., Liu S., Ghassaban K., Zheng W., Dicicco D., Miao Y., Habib C., Jazmati T. and Haacke E.M. (2016). “Assessing global and regional iron content in deep gray matter as a function of age using susceptibility mapping.” J. Magn. Reson. Imaging, 44: 59-71. doi:10.1002/jmri.25130
- Acosta-Cabronero J., Betts M.J., Cardenas-Blanco A., Yang S., Nestor P.J. (2016). “In Vivo MRI Mapping of Brain Iron Deposition across the Adult Lifespan.” J. Neurosci. 36(2), 364-374. doi:10.1523/jneurosci.1907-15.2016
- Li G., Tong R., Zhang M., Gillen K.M., Jiang W., Du Y., Wang Y., Li J. (2023). “Age-dependent changes in brain iron deposition and volume in deep gray matter nuclei using quantitative susceptibility mapping.” NeuroImage, 269, 119923. doi:10.1016/j.neuromage.2023.119923
Figures