2617
Statistics of Referencing Susceptibility Maps in the Context of Clinical QSM Studies1Medical Physics and Biomedical Engineering, University College London, London, United Kingdom, 2Developmental Neurosciences, UCL GOS Institute of Child Health, University College London, London, United Kingdom, 3School for Electrical Engineering, Pontificia Universidad Catolica de Valparaiso, Valparaiso, Chile
Synopsis
Keywords: Susceptibility/QSM, Susceptibility, Clinical,Statistics,Referencing
Motivation: In QSM, there is no well-established susceptibility baseline . This can be determined a-posteriori by referencing to a specific tissue but this may impact statistics in clinical studies.
Goal(s): To derive an expression for a t-test under referencing, and to investigate the effect of commonly used reference regions on a temporal lobe epilepsy study.
Approach: Reference regions were compared: three anatomical structures and three derived from global thresholds. Changes in covariances, t-test results, and regional susceptibility distributions are presented.
Results: Referencing to small regions has a bigger impact on statistical analyses than large references. Reference regions should have a low variance across groups.
Impact: Referencing QSM susceptibility values is essential, but highly contested in practice, particularly in clinical applications. We clarify the statistical theory, and investigate the impact of referencing susceptibility measurements to different regions to facilitate practical implementation and clinical applications.
Introduction
In quantitative susceptibility mapping (QSM), the reconstructed magnetic susceptibility maps have no well-established absolute reference value. This is because phase data only reflects field inhomogeneities due to relative susceptibility differences. Therefore, to obtain comparable susceptibility maps between measurements, subtracting a reference susceptibility value may be considered necessary1. Typically, this reference is chosen as an anatomical region2. For example, CSF values are considered unlikely to be affected by pathology and ageing3. Alternatively, the entire brain can be used4.To aid the choice of reference region, we describe the statistics underpinning referencing and investigate the impact of reference regions on statistical testing routinely used in clinical research.
Theoretical Background
In clinical studies the goal is to investigate a difference between healthy controls and patients, and if that difference is statistically significant. This is usually done by comparing mean values of a region of interest across the cohorts with a two-sample t-test, with test statistic$$t=\frac{\bar{X}-\bar{Y}}{S_d} \tag{1}$$
for the null hypothesis $$$H_0:μ_X=μ_Y$$$. Here, $$$\bar{X}$$$ and $$$\bar{Y}$$$ are unbiased estimates of the cohort means ($$$μ_X$$$and $$$μ_Y$$$ ), and $$$S_d^2$$$ is an unbiased estimate of the sample variance
$$S_d^2= \text{Var}(X-Y)=\frac{\text{Var}(X)}{n} + \frac{\text{Var}(Y)}{m},\tag{2}$$
with $$$n$$$ subjects in cohort $$$X$$$ and $$$m$$$ in $$$Y$$$.
With referencing, the distributions change to $$$X-R_X$$$ and $$$Y-R_Y$$$, the null hypothesis for which becomes $$$H_0:μ_X-μ_{R_X}=μ_Y-μ_{R_Y}$$$. Whether this hypothesis is equivalent to the original (and by extension $$$μ_{R_X}=μ_{R_Y}$$$ , or in other words, the referencing bias is similar in both cohorts) or not, in either case the referencing impacts the sample variance, and therefore the precision of the hypothesis test.
Assuming the susceptibilities within an ROI are Gaussian (guaranteed through the central limit theorem for sufficiently large ROIs). The sample variance after referencing can be written as
$$\text{Var}(X-R_X)=\text{Var}(X)+\text{Var}(R_X)-2\text{Cov}(X,R_X).\tag{3}$$
Since the variance is strictly non-negative ($$$\text{Var}(⋅)≥0$$$) this is reduced if
$$2\text{Cov}(X,R_X)≥\text{Var}(R_X),\tag{4}$$
or in other words
$$\frac{2\text{Cov}(X,R_X)}{\text{Var}(R_X)} ≥1.\tag{5}$$
Methods
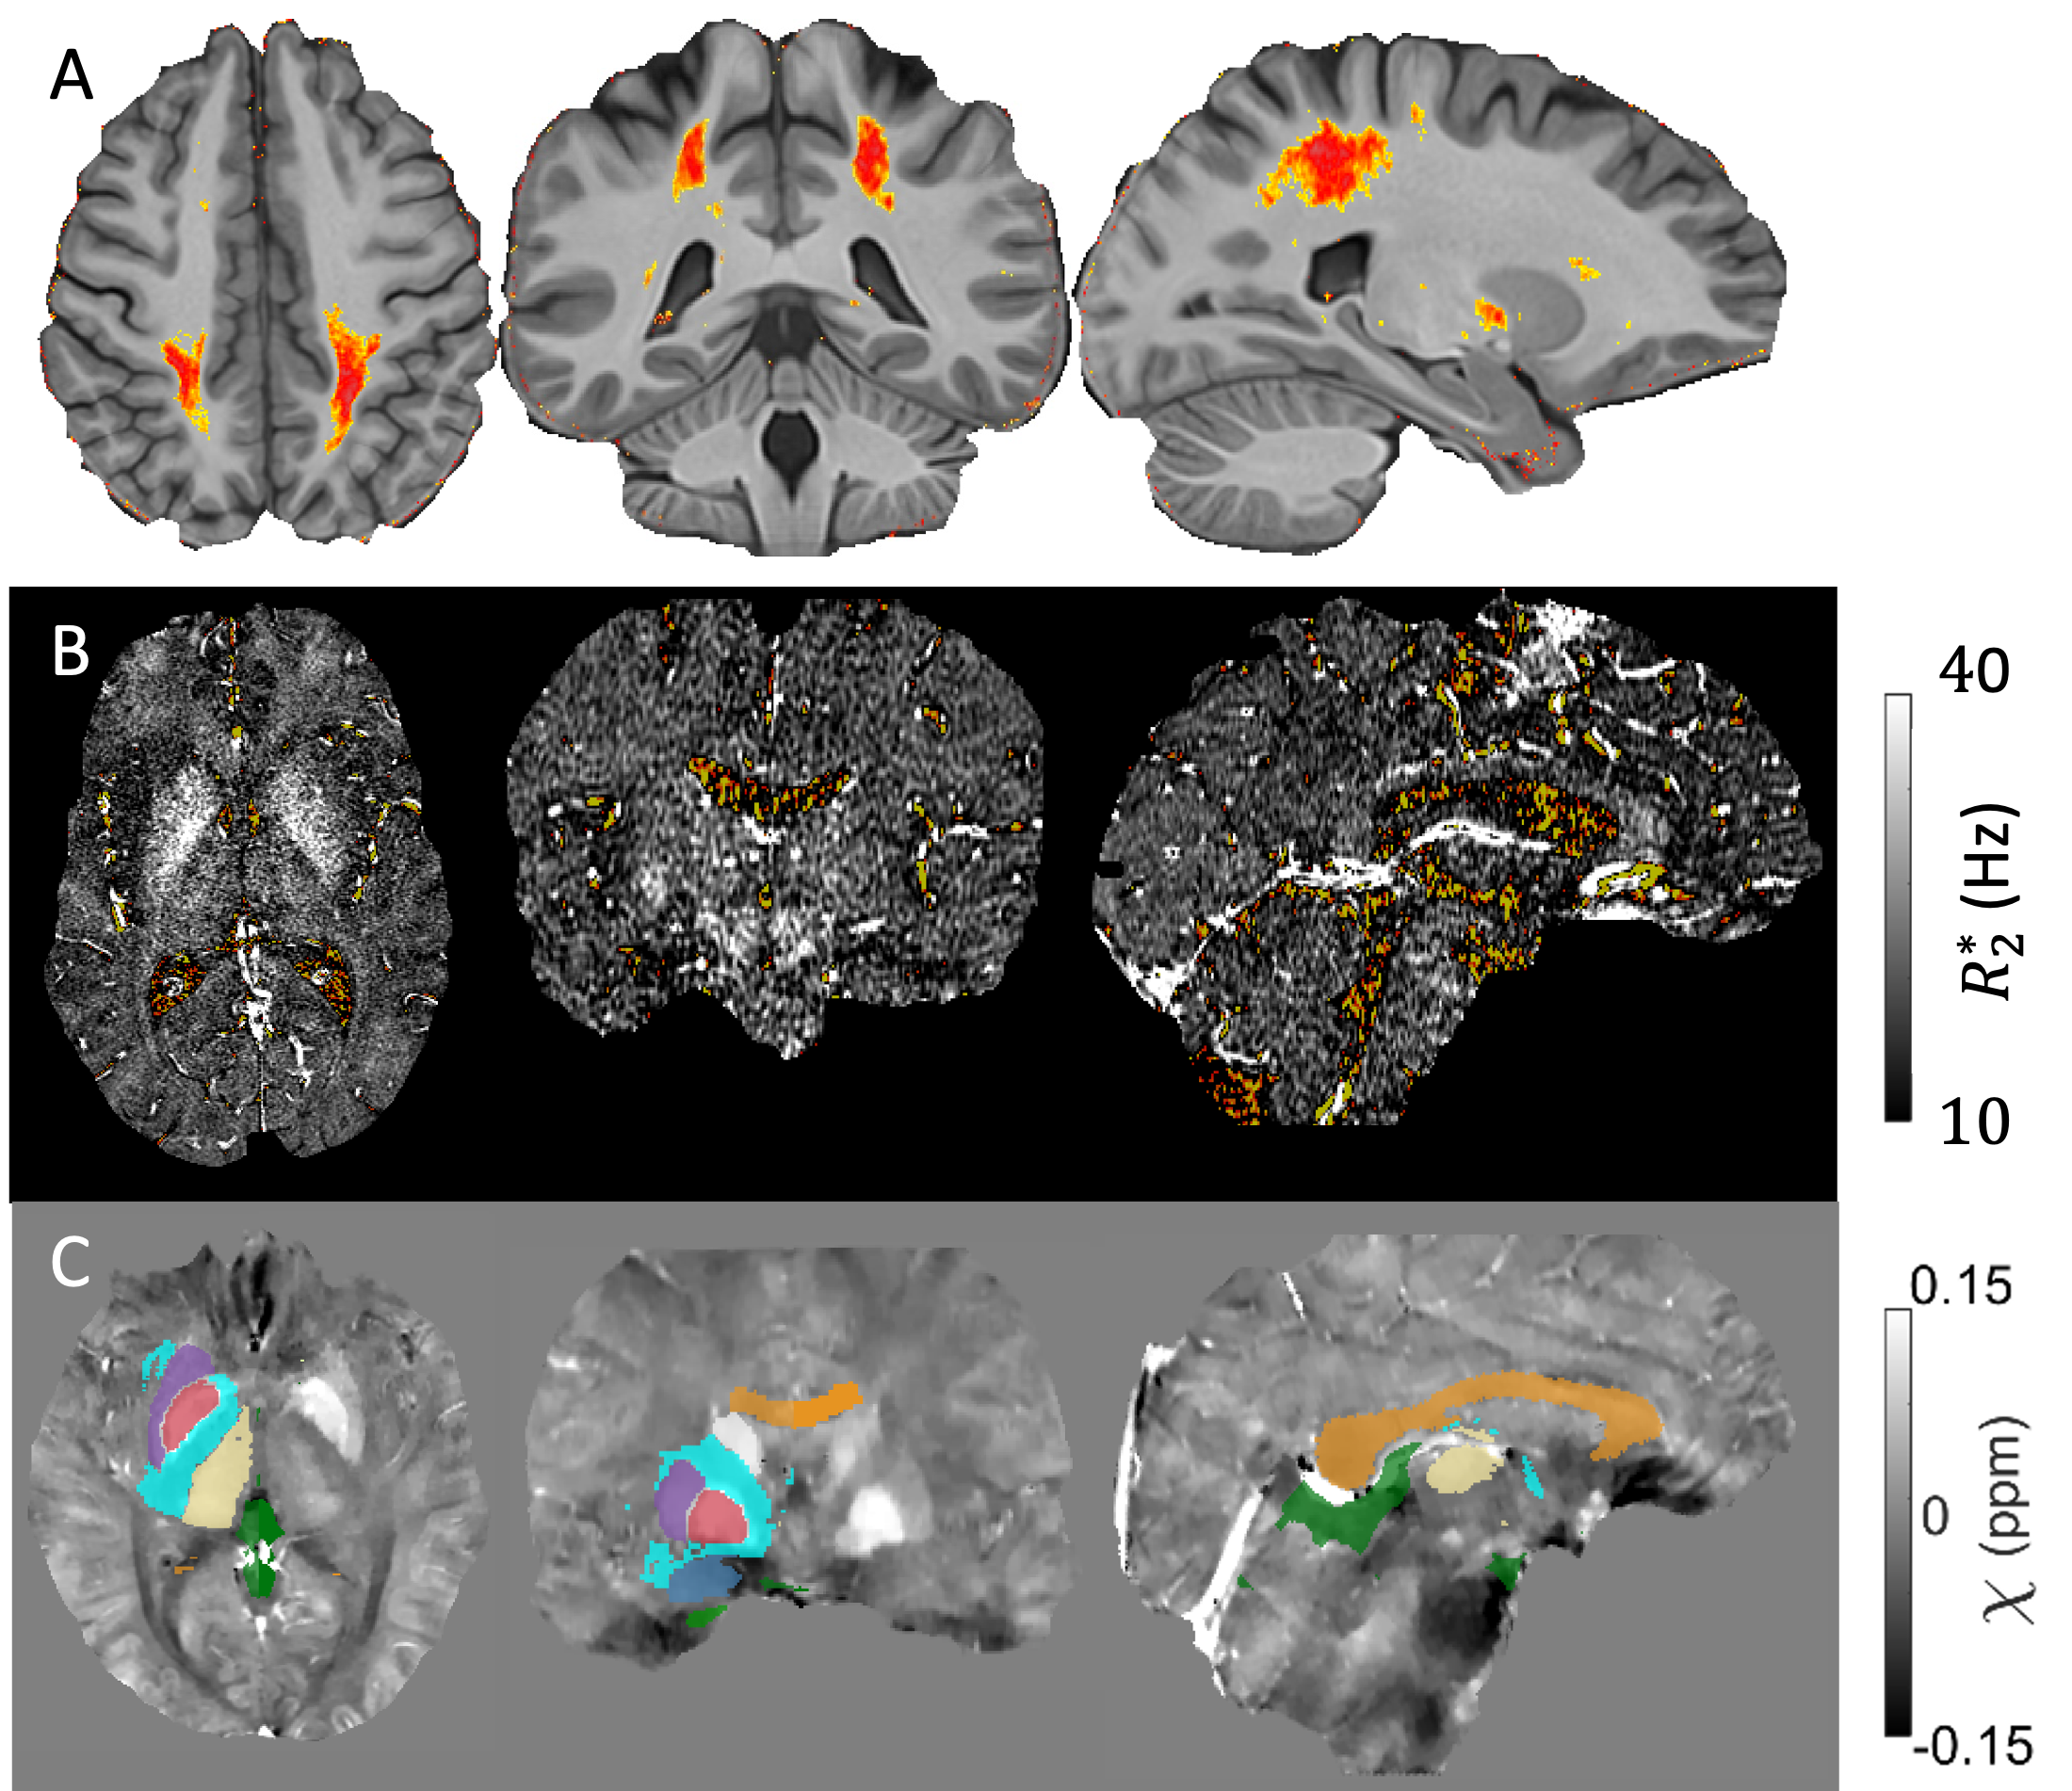
We calculated the normalized covariance in Equation 5 using data from a published study on temporal lobe epilepsy (TLE)5. The regions used, obtained through various segmentations5, are described in Figure 1 and referencing was performed by subtracting the mean susceptibility in the reference region (before age correction).Another concern with referencing is introducing additional correlation between groups through referencing to a region with disease (group) dependent susceptibility values. We investigated the disease dependence of susceptibilities in reference regions in the TLE study using an analysis of variance (ANOVA) test.
Results
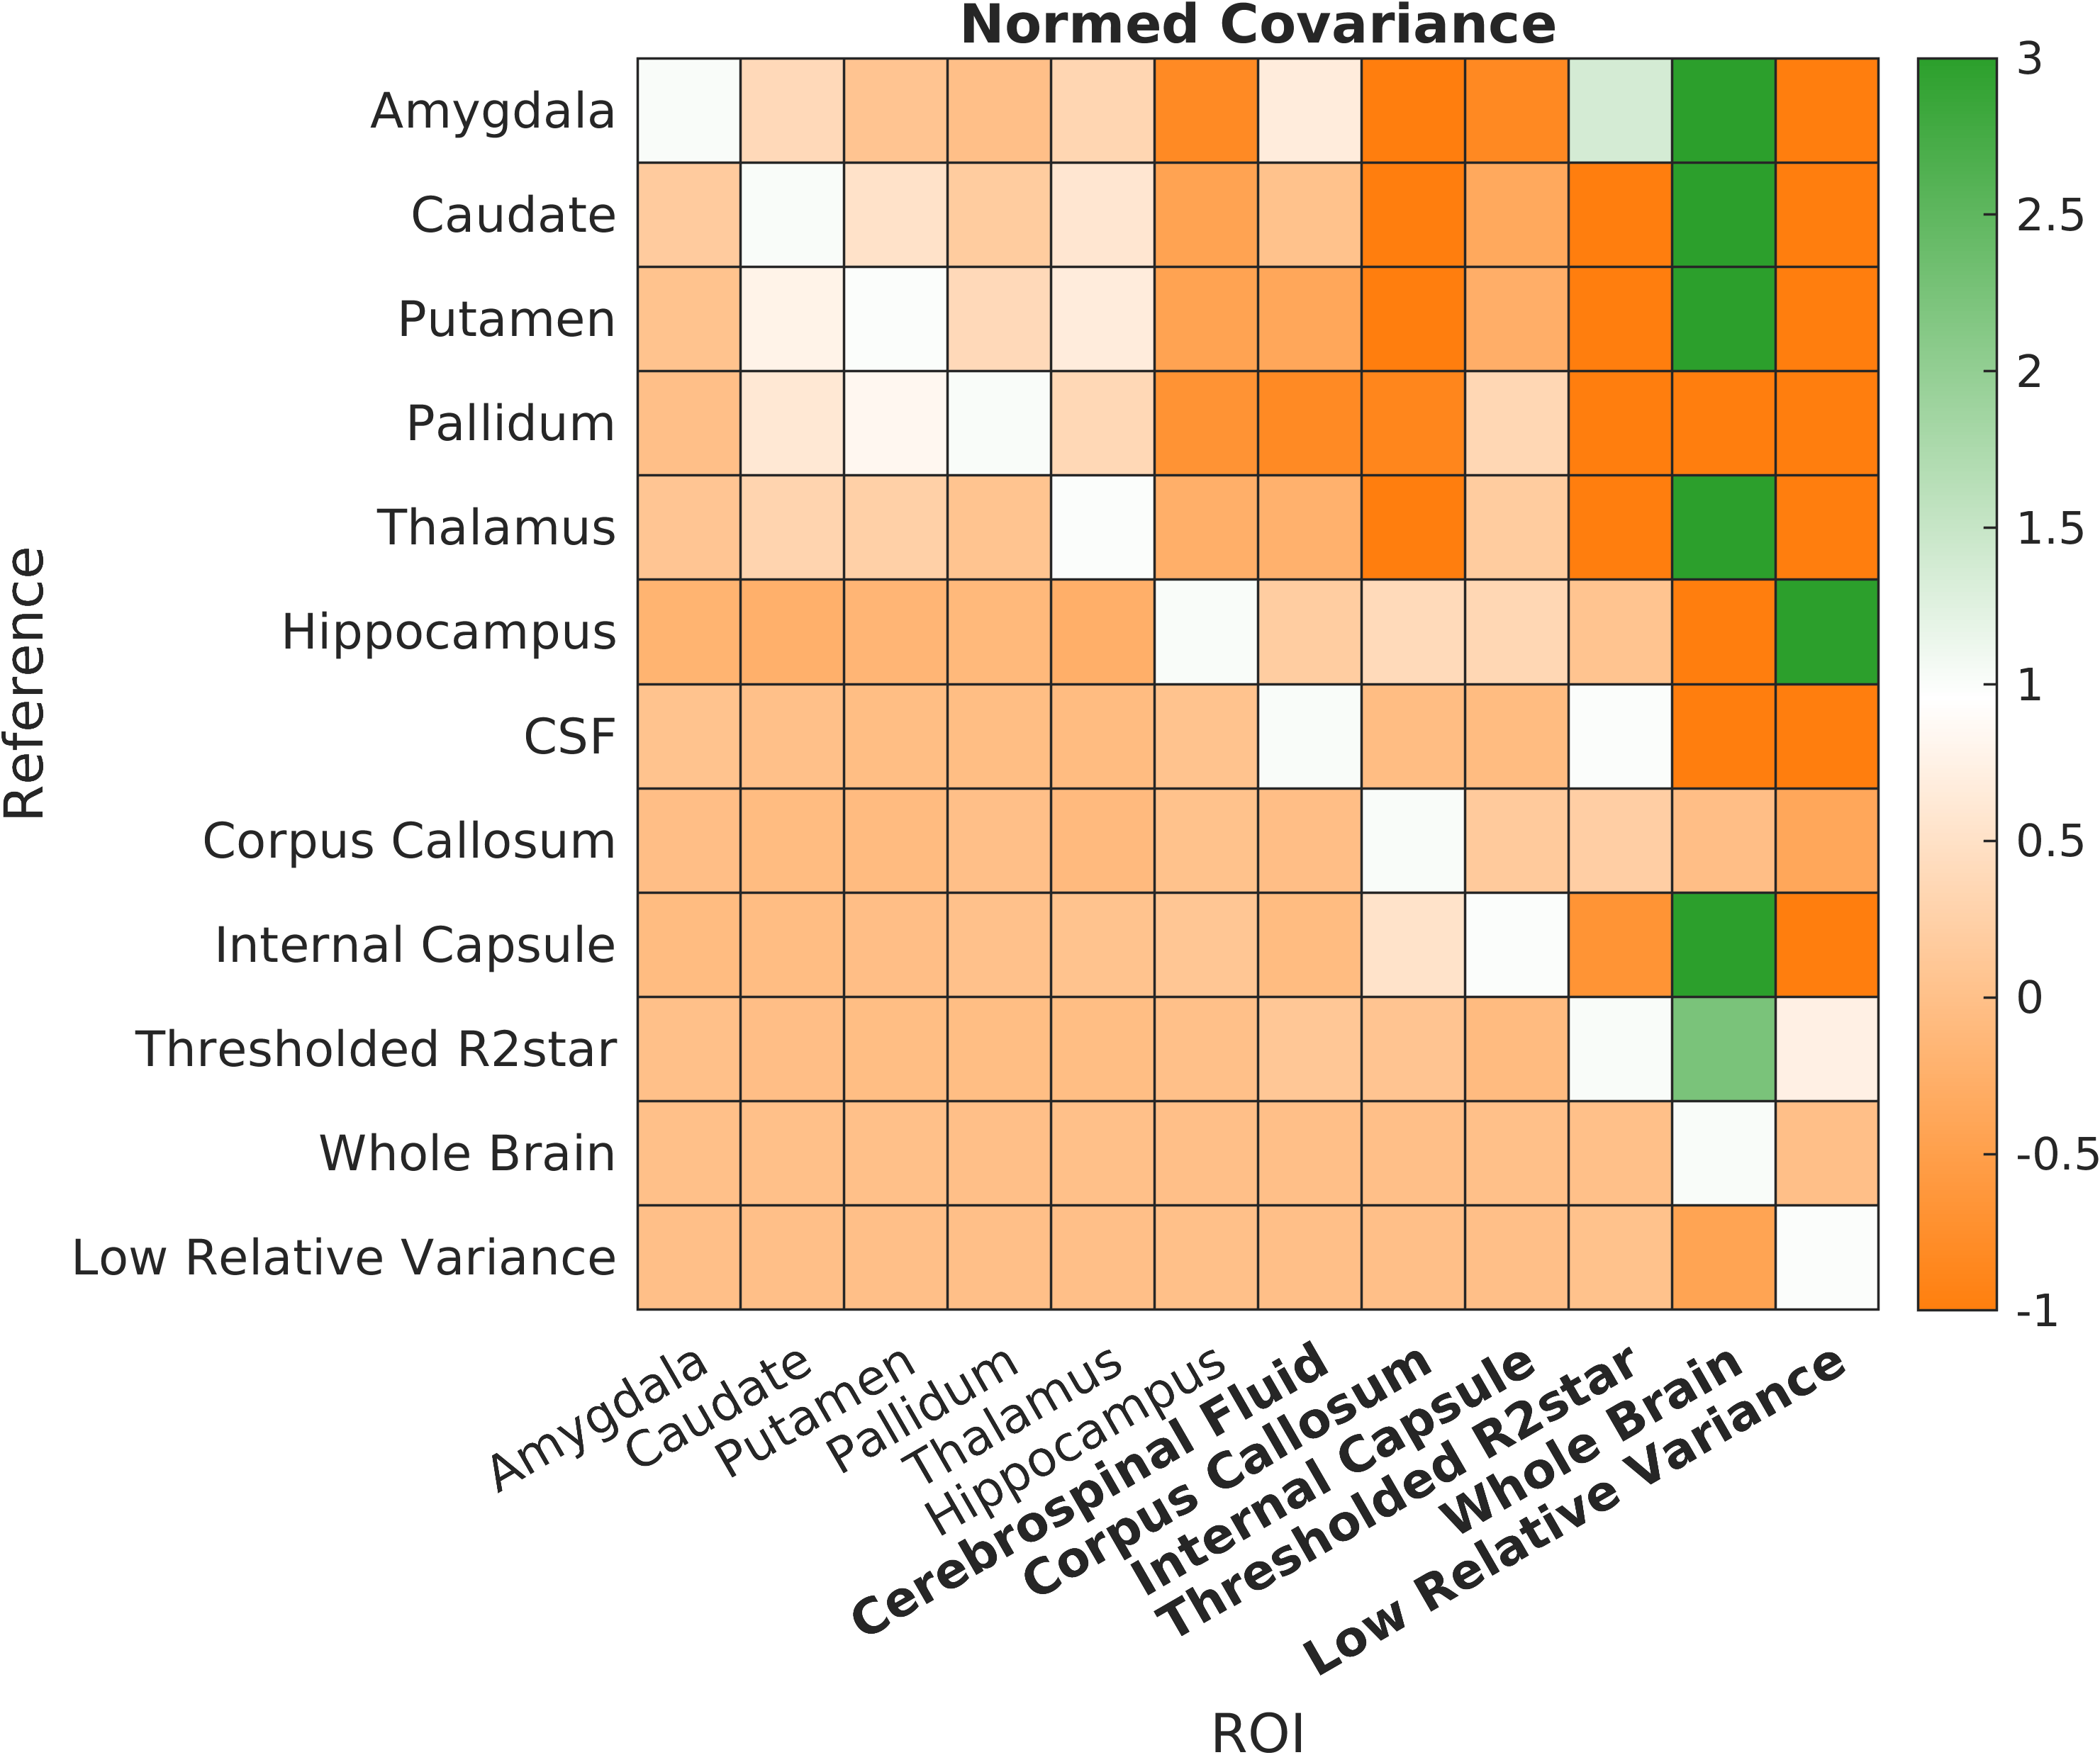
Figure 2 shows the covariance for each region normalized for each reference region. This illustrates that only referencing to the whole brain reduces the variance in most deep gray matter ROIs (green), decreasing the t-test’s confidence interval.Table 1 shows the ANOVA results. The corpus callosum, thalamus and putamen are significantly correlated between groups, and would, therefore, not provide unbiased reference regions. Note the high p-values of CSF and relative variance regions, which indicates that susceptibilities in these regions are similar between the groups, i.e. they are independent of disease or study cohort.
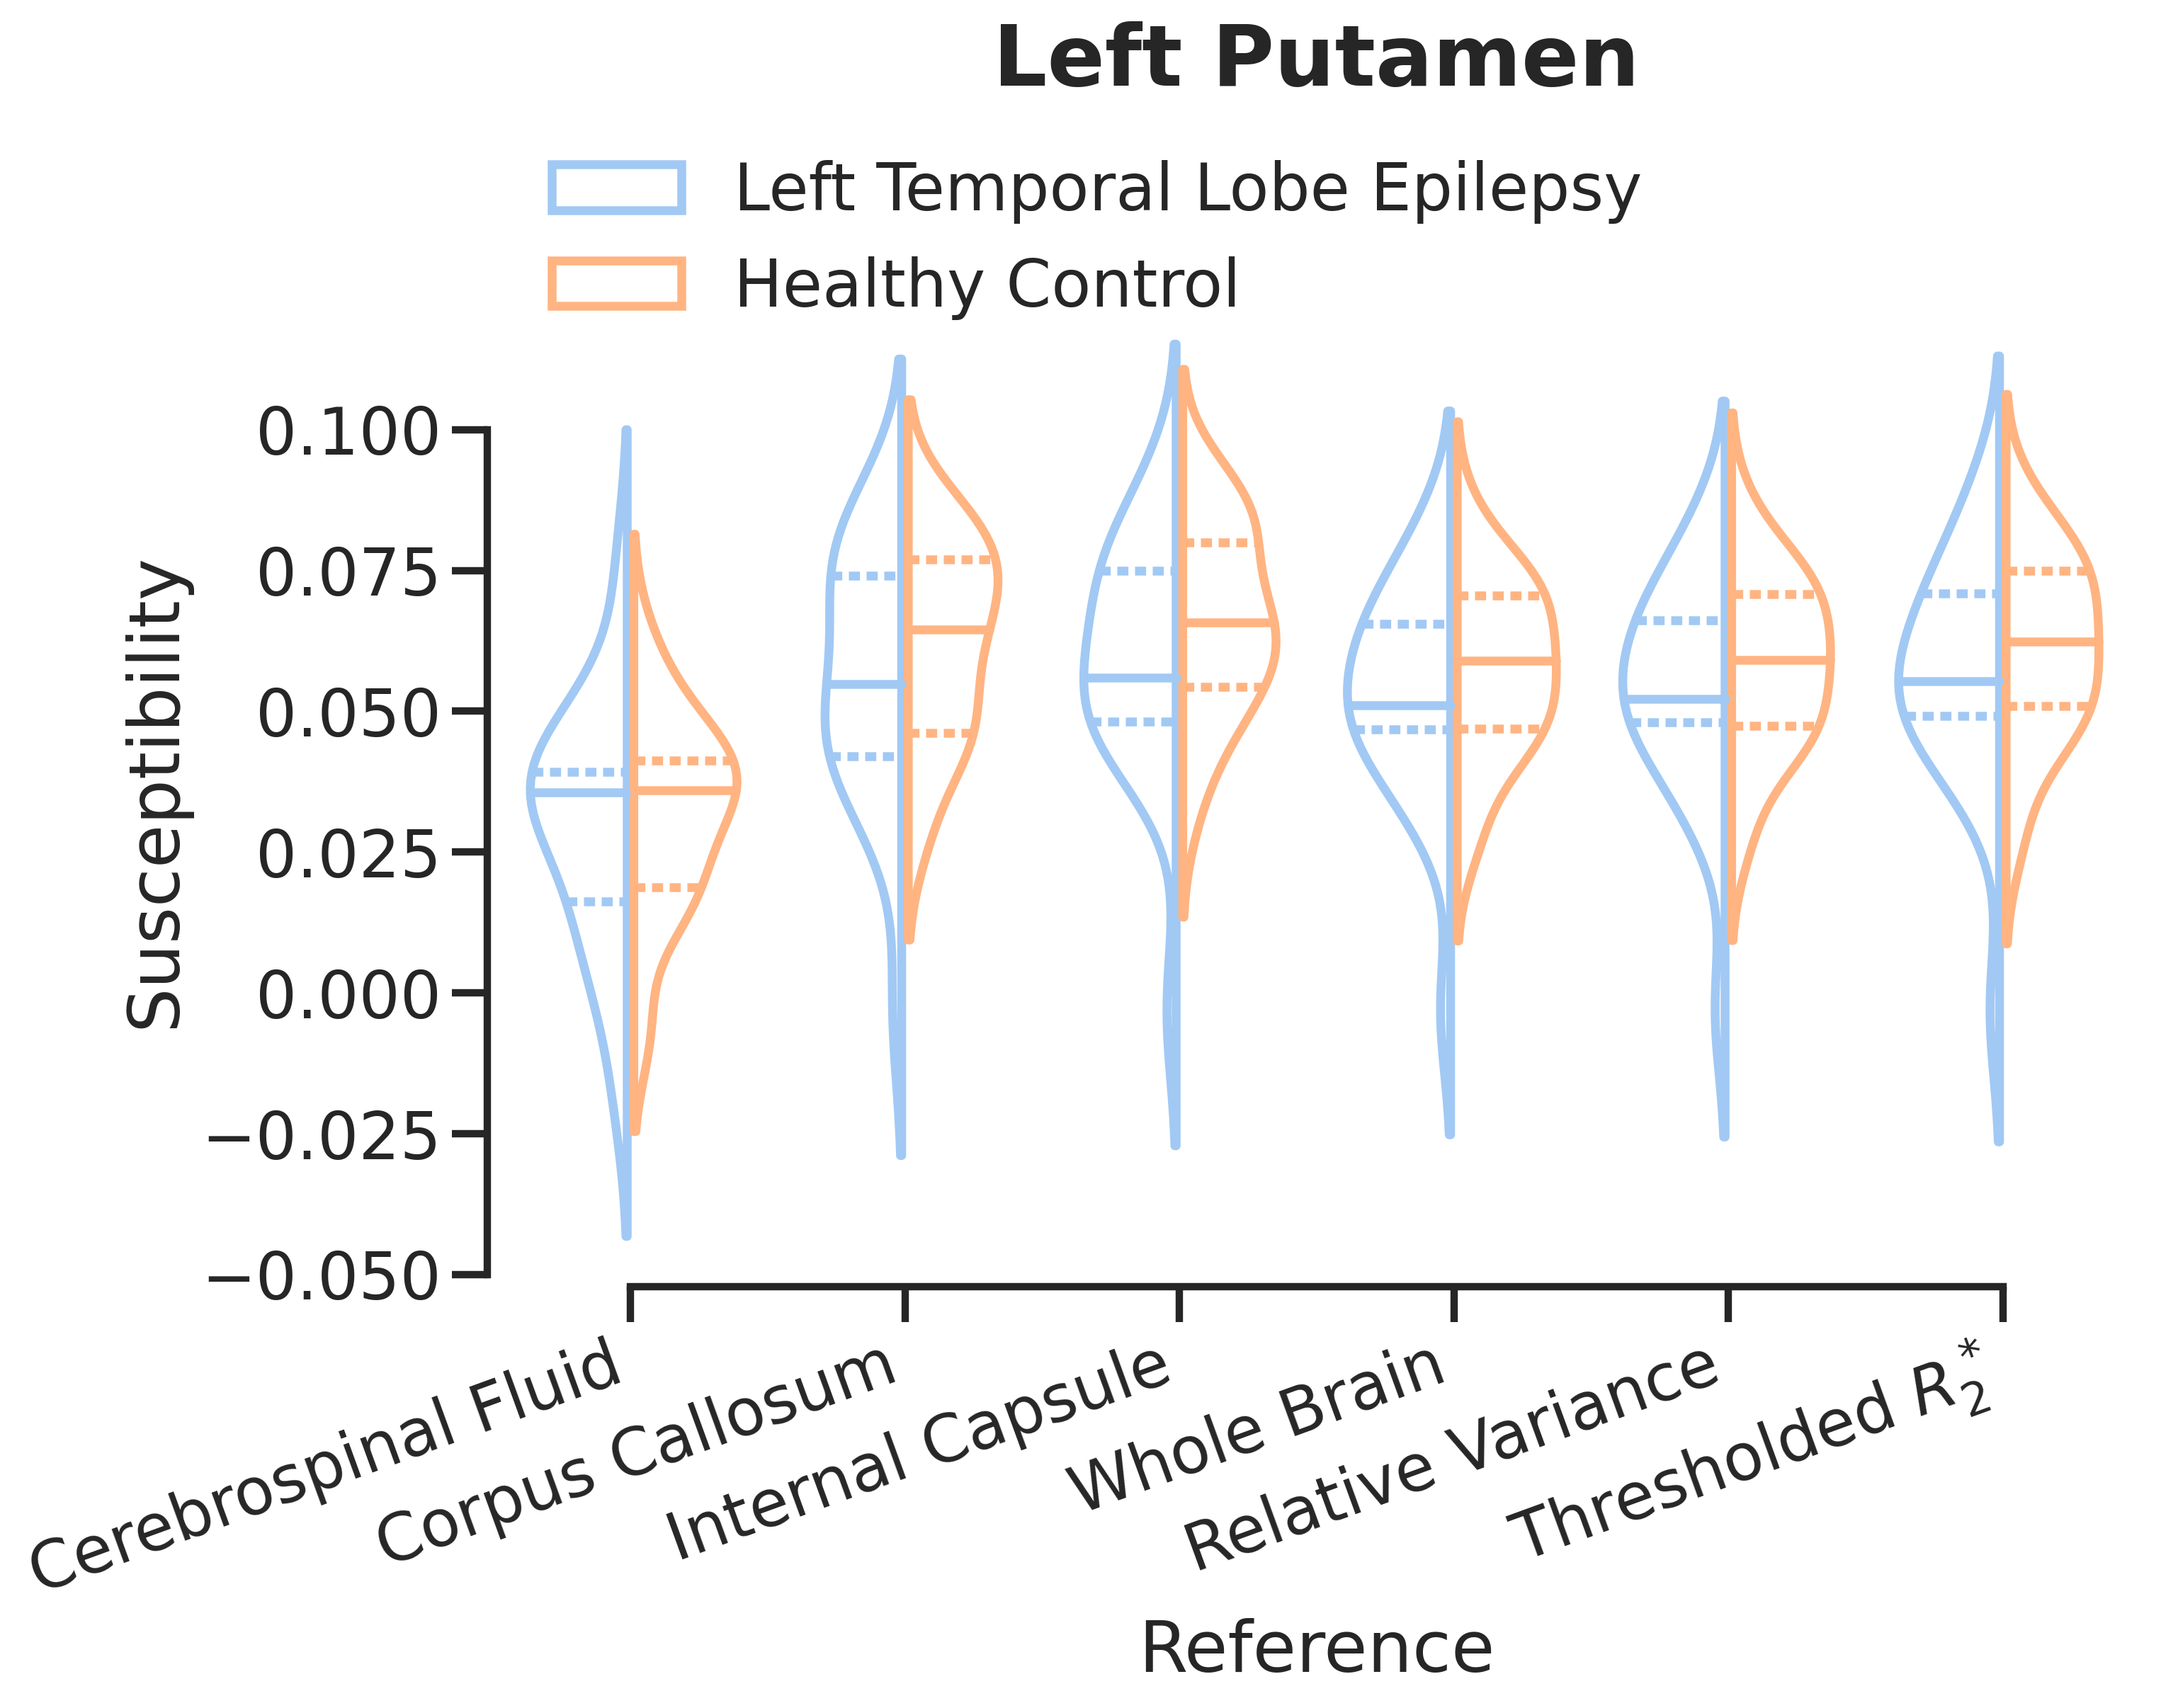
Despite this, referencing can introduce changes in regional susceptibility distributions as illustrated in Figure 3, where CSF referencing greatly reduces the difference in group means in the left putamen.
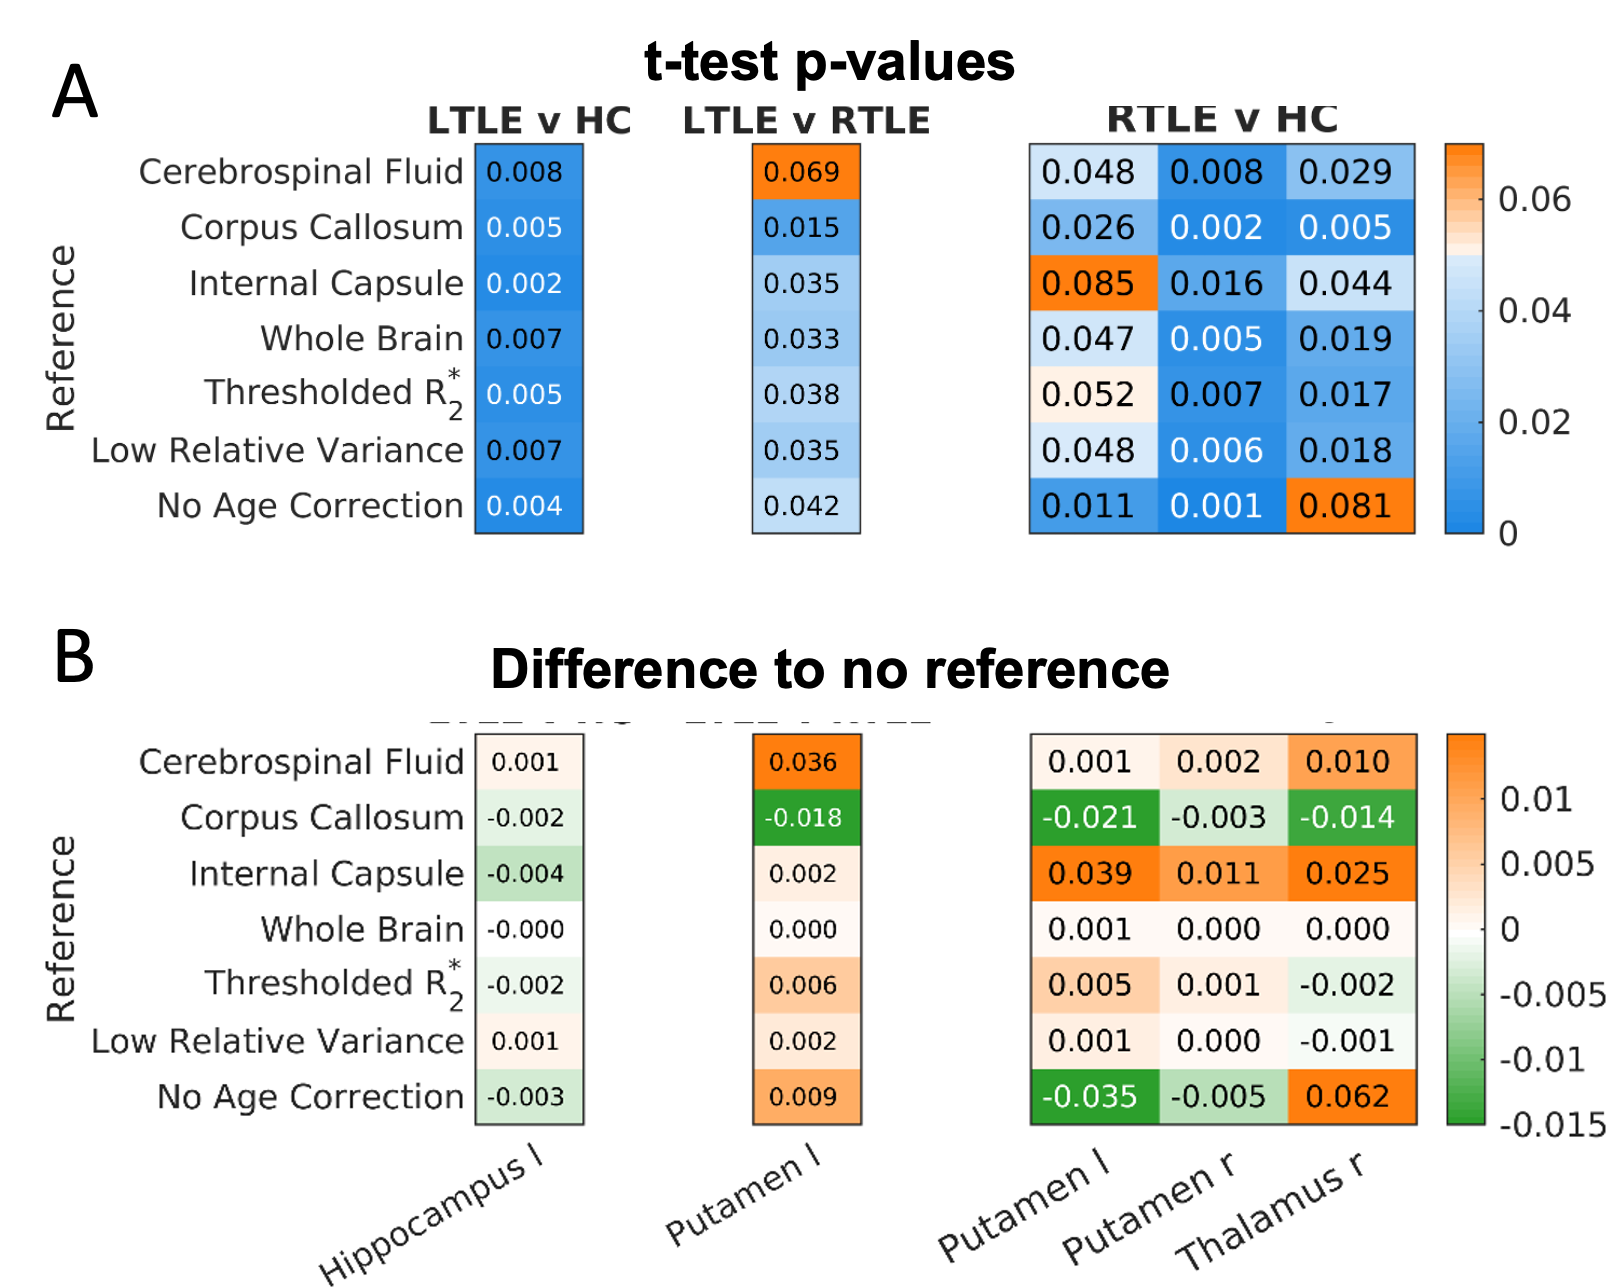
Although referencing may change the variance and distribution and variance of the data, it may not influence the results of statistical testing. For example, in Figure 4 the t-test p-values of some deep gray matter regions (with statistically significant between group differences) are given for different reference regions. A test where no age correction was performed is included to compare the impact of age correction to referencing. Only four results are no longer significant after referencing. Figure 4(B) illustrates that smaller reference regions have a larger impact on the p-values than more extensive regions.
Discussion and Conclusion
Referencing to small regions has a bigger impact on statistical analyses than extensive region references. Reference regions should have a low variance across groups. In our experiments, age correction had a larger impact on test statistics than referencing to large, non-anatomical, global regions. Two regions of interest with statistically significant changes close to the threshold did depend on the reference used, while those with $$$p<<0.05$$$ did not. We have given a brief overview of the statistics underpinning referencing in QSM and some examples of what to look out for when choosing a reference region. Our advice follows the recent consensus paper1: publish your results including commonly used reference region values, consider study design, pathology and bias when choosing a reference region, and cross-check your results with different reference regions ensure potential bias is excluded.Acknowledgements
PF, OK, KS are supported by European Research Council Consolidator Grant DiSCo MRI SFN 770939. CM is supported by VINCI-DI Iniciacion PUCV 2023.References
1 QSM Consensus Organization Committee; Bilgic B, Costagli M, Chan KS, Duyn J, Langkammer C, Lee J, Li X, Liu C, Marques JP, Milovic C, Robinson S, Schweser F, Shmueli K, Spincemaille P, Straub S, van Zijl P, Wang Y; ISMRM Electro-Magnetic Tissue Properties Study Group. “Recommended Implementation of Quantitative Susceptibility Mapping for Clinical Research in The Brain: A Consensus of the ISMRM Electro-Magnetic Tissue Properties Study Group,” ArXiv [Preprint]. 2023.2 P. Ravanfar, S. M. Loi, W. T. Syeda, T. E. Van Rheenen, A. I. Bush, P. Desmond, V. L. Cropley, D. J. R. Lane, C. M. Opazo, B. A. Moffat, D. Velakoulis, and C. Pantelis, “Systematic review: Quantitative susceptibility mapping (qsm) of brain iron profile in neurodegenerative diseases,” Frontiers in Neuroscience, vol. 15, 2021.
3 S. Straub, T. M. Schneider, J. Emmerich, M. T. Freitag, C. H. Ziener, H.-P. Schlemmer, M. E. Ladd, and F. B. Laun, “Suitable reference tissues for quantitative susceptibility mapping of the brain,” Magnetic Resonance in Medicine, vol. 78, no. 1, pp. 204–214, 2017.
4 J. Acosta-Cabronero, M. J. Betts, A. Cardenas-Blanco, S. Yang, and P. J. Nestor, “In vivo mri mapping of brain iron deposition across the adult lifespan,” Journal of Neuroscience, vol. 36, no. 2, pp. 364–374, 2016.
5 O. C. Kiersnowski, G. P. Winston, L. Caciagli, E. Biondetti, M. Elbadri, S. Buck, J. S. Duncan, J. S. Thornton, K. Shmueli, and S. B. Vos, “Quantitative susceptibility mapping identifies hippocampal and other subcortical grey matter tissue composition changes in temporal lobe epilepsy,” Human Brain Mapping, 2023.
Figures