2616
Analysis of Iron Accumulation in MAPT- and C9orf72-associated Frontotemporal Lobar Degeneration: QSM, T2*-w MRI, and Histology1Alzheimer center and Neurology, Erasmus Medical Center, Rotterdam, Netherlands, 2CJ Gorter for MRI, department of Radiology, Leiden University Medical Center, Leiden, Netherlands, 3Human Genetics, Leiden University Medical Center, Leiden, Netherlands
Synopsis
Keywords: Electromagnetic Tissue Properties, Ex-Vivo Applications, Genetic Diseases, Neurodegeneration, Iron
Motivation: Ex-vivo histology is the most common method to assess iron accumulation in frontotemporal lobar degeneration, but in vivo assessment is crucial to unravel disease mechanisms.
Goal(s): This study aims to assess the distribution and severity of iron accumulation post-mortem using susceptibility MRI and compare this to histological data.
Approach: We analyzed postmortem tissue of 5 MAPT-FTLD and 2 C9orf72-FTLD cases using a histological iron staining, T2*-weighted MRI, and QSM maps.
Results: We found that histology, susceptibility MRI, and QSM show good correspondence of iron distribution in FTLD brain tissue. However, sharp details are better seen on T2*-weighted MRI, and U-fibers on QSM maps.
Impact: Our study showed that susceptibility-based imaging can be used to visualize iron accumulation in FTLD; with T2*-weighted MRI and QSM showing complementary spatial information. Therefore, these two methods should be used parallel and not independent of each other.
Background
Frontotemporal lobar degeneration (FTLD) is the second most common cause of early-onset dementia. A substantial part is familial due to a microtubule associated protein tau (MAPT) or progranulin mutation, or the chromosome open reading frame 72 hexanucleotide repeat expansion (C9orf72 HRE)1. A recent study from our group showed cortical iron accumulation that co-localized with tau- and TDP-43 pathology in MAPT or C9orf72-associated FTLD. Iron accumulation was associated with the severity of proteinopathy, neuronal degeneration, clinical severity, and the presence of activated microglia, reactive astrocytes, and myelin loss. 7T T2*-weighted MRI showed a good correspondence between hypointense changes on MRI and cortical iron observed on histology2.Until now, the most used method to assess iron accumulation and distribution in the human brain is by ex vivo histology. However, in order to explore the role of iron accumulation in the disease process, in vivo evaluation is crucial. MRI techniques, such as T2*-mapping and QSM, could be useful for this purpose, as seen in Alzheimer’s disease and Huntington’s disease3, 4. Studies in FTLD are lacking thus far. In this project, we assessed the severity of iron accumulation post-mortem using T2*-weighted MRI and QSM and compared this to histological data.
Material and Methods
Postmortem brain material: Tissue blocks from the right hemisphere of 5 FTLD-MAPT and 2 FTLD-C9orf72 cases were included (fig. 1). For all cases, the middle frontal gyrus was included and, depending on tissue availability, either the temporal pole or the middle temporal cortex (fig. 2). All material was obtained through the Netherlands Brain Bank.Histology: All tissue blocks were cut into 20 μm sections. Cortical iron accumulation was detected using an in-house developed DAB-enhanced Prussion Blue histology protocol5. Cortical iron accumulation and localization was assessed by scoring for the presence or absence of abnormal diffuse band-shaped cortical iron staining or cortical lamination2.
MRI set-up: Tissue blocks were scanned on a 7T horizon bore Bruker MRI system equipped with a 38 mm transmit-receive volume coil and Paravision 360 imaging software (Bruker Biospin, Ettlingen, Germany).
Ex vivo MRI acquisition and post-processing: The tissue blocks were put in a 50 mL tube (Greiner Bio-One) and immersed in Fomblin. Multiple gradient echo scans with a total scan time of 10 hours were acquired for each tissue block. Scan parameters were (TR/TE/ΔTE: 150/3.5/5 ms), resolution: 100 μm. QSM maps were reconstructed using the SEPIA pipeline for QSM data. We used Optimum weights Laplacian (MEDI), VSHARP, and MEDI6.
Analysis: Histological slides, T2*-weighted MRI, and QSM maps were visually analyzed and scored for the following features: iron in cortex, atrophy of cortical layers, superficial bands, white and grey matter contrast, and U-fibers.
Results
Three MAPT cases demonstrated a diffuse mid-cortical iron band on both histological staining and T2*-weighted MRI in the both cortices. On the T2*-weighted and the QSM map, this pattern was characterized by an inhomogeneous cortex and the presence of a diffuse hypointense band covering the mid-cortical layers of the cortex (fig. 3A). The other two FTLD-MAPT cases had no iron accumulation on the histological,T2* images, and QSM maps, demonstrated by a homogeneous appearing cortex with well-defined narrow bands (fig. 3B).In the two C9orf72-cases, there was a diffuse mid-cortical iron band and a superficial cortical iron band covering the upper layers of the cortex visible on histology and MRI (fig. 4). There was no normal iron distribution visible on both modalities. One case had superficial cortical iron bands, but no diffuse mid-cortical bands that were present on the QSM. The other case had some minimal changes in the gradient over the cortex, which reflects varying iron concentrations on the histology. However, the narrow band seen on histology, was not found on the QSM.
Discussion
As stated before, histology and susceptibility MRI show good correspondence of iron distribution in FTLD brain tissue, showing that susceptibility imaging is an useful modality to assess iron in affected brains2. However, sharp edges and differences were better seen on T2*-weighted MRI than QSM maps, due to the smoothing of the QSM map in the post-processing pipeline (fig. 5) Additionally, the contrast between grey and white matter is better visible on the T2*-weighted MRI. On the contrary, U-fibers show on QSM maps, but not on T2*-weighted MRI. This might be caused by the contrast generated by myelin and iron shown by QSM, which is not visible on the T2*-weighted image. We are currently running statistics on the QSM maps to express iron accumulation and localization.Conclusion
Susceptibility-based imaging can be used to visualize iron accumulation in FTLD; with T2*-weighted MRI and QSM showing complementary spatial information.Acknowledgements
Funding for this study was provided by Alzheimer Nederland from grant WE.03-2020-10 and ZonMw from grant: 733050513.
References
- Grossman M, Seeley WW, Boxer AL, et al. Frontotemporal lobar degeneration. Nat Rev Dis Primers. 2023 Aug 10;9(1):40
- Giannini LAA, Bulk M, Kenkhuis B, et al. Cortical iron accumulation in MAPT- and C9orf 72-associated frontotemporal lobar degeneration. Brain Pathol. 2023 Jul;33(4):e13158.
- Bulk M, Abdelmoula WM, Nabuurs RJA, et al. Postmortem MRI and histology demonstrate differential iron accumulation and cortical myelin organization in early- and late-onset Alzheimer's disease. Neurobiol Aging. 2018 Feb;62:231-242.
- Bulk M, Hegeman-Kleinn I, Kenkhuis B, et al. Pathological characterization of T2*-weighted MRI contrast in the striatum of Huntington's disease patients. Neuroimage Clin. 2020;28:102498.
- van Duijn S, Nabuurs RJ, van Duinen SG, Natte R. Comparison of histological techniques to visualize iron in paraffin-embedded brain tissue of patients with Alzheimer's disease. J Histochem Cytochem. 2013; 61: 785–92.
- Bulk M, Abdelmoula WM, Geut H, et al. Quantitative MRI and laser ablation-inductively coupled plasma-mass spectrometry imaging of iron in the frontal cortex of healthy controls and Alzheimer's disease patients. Neuroimage. 2020 Jul 15;215:116808.
Figures
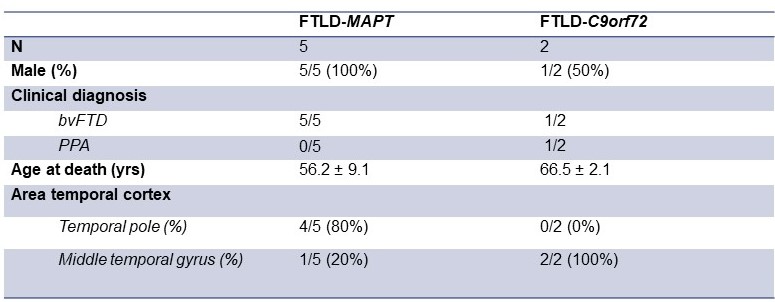
Figure 1: Patient characteristics. bvFTD: behavioral variant frontotemporal dementia. PPA: primary progressive aphasia.
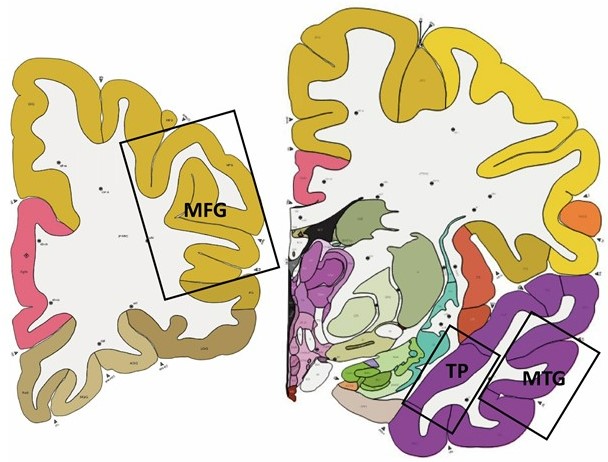
Figure 2: Schematic overview of the location of the frontal and temporal tissue used in this study. MFG: middle frontal gyrus; TP: temporal pole; MTG: middle temporal gyrus. Figure from 2.
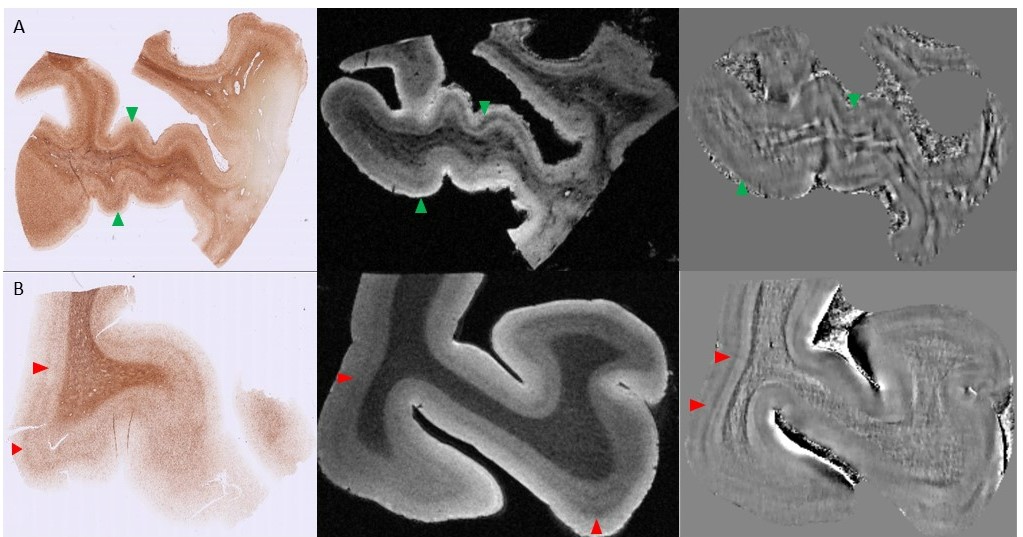
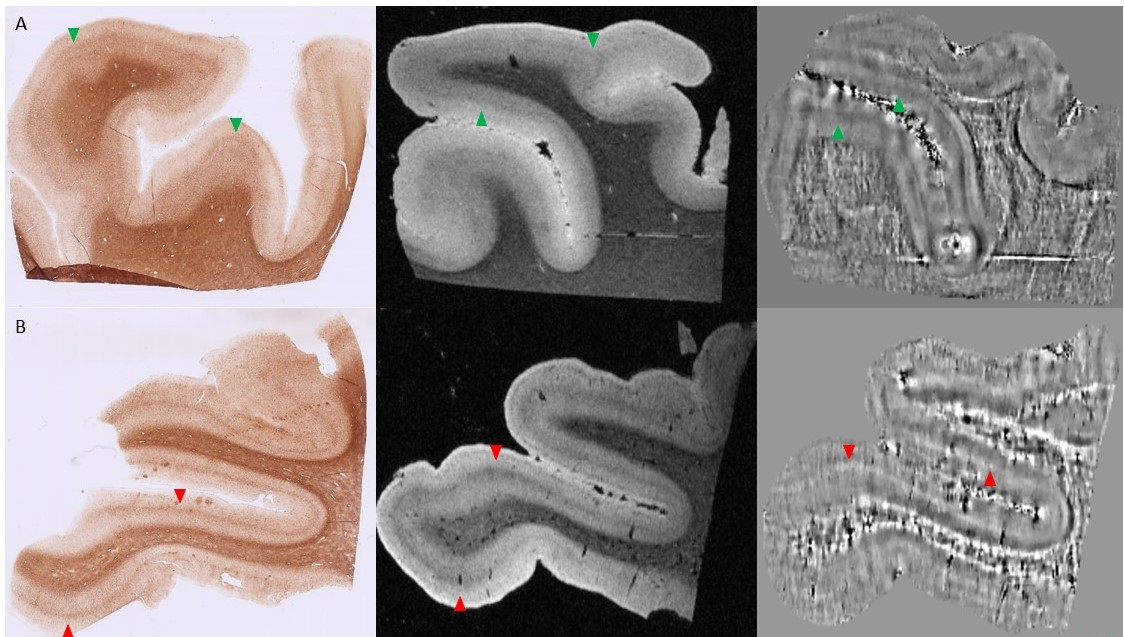
Figure 4: Iron histology, ex vivo 7T T2*-weighted MRI, and QSM for the two C9orf72 cases. A. The upper case shows a superficial thin layer of iron and a diffuse mid-cortical band on the histology, the T2*-weighted scan and QSM map (green arrows). The frontal cortex is shown. B. The lower case has a thin mid-cortical layer on QSM map, the T2*-weighted image, and the histology (red arrows). The temporal cortex is displayed.
Both T2*-weighted images display the sixth echo.
