2614
A Computational Investigation of DSC-MRI Signals From 3D Tissue Structures with Varied Cellular Features1Department of Biomedical Engineering, The University of Texas at Austin, Austin, TX, United States, 2Department of Cancer Systems Imaging, The University of Texas MD Anderson Cancer Center, Houston, TX, United States
Synopsis
Keywords: Susceptibility/QSM, Susceptibility, Dynamic Susceptibility Contrast MRI, Cellular Structures, Tissue Structures, Simulation
Motivation: Dynamic susceptibility contrast (DSC) MRI is a robust method for imaging brain tumors, and there is potential to glean more clinically useful data than is obtained with standard-of-care DSC-MRI.
Goal(s): We aimed to systematically investigate the effect of varied cellular features on the difference in DSC-MRI-derived ΔR2* time curves to evaluate the feasibility of recovering these features in real tissue.
Approach: We generated 3D tissue structures of ellipsoids (determined by specified parameters and randomly distributed) and applied the finite difference finite perturber method to compute ΔR2*.
Results: In general, ΔR2* increased then plateaued as cell volume fraction, aspect ratio, and size increased.
Impact: We simulated T2*-weighted DSC-MRI signal for 3D tissue structures with varied cellular features to evaluate the feasibility of recovering these features in real tissue. Results suggested that cell volume fraction, aspect ratio, and size may be identifiable biomarkers.
Introduction
Dynamic susceptibility contrast-magnetic resonance imaging (DSC-MRI) is a robust technique for brain tumor imaging, as it detects differences in magnetic susceptibility due to contrast agent diffusion and compartmentalization within tissues.1-4 When DSC-MRI signal is acquired in the presence of residual contrast agent in the extravascular space (due to a disrupted blood brain barrier), the signal variations primarily depend on cellular characteristics. The goal of this study was to systematically investigate the effect of cellular features on the difference in DSC-MRI-derived ΔR2* time curves. We conducted simulations to calculate ΔR2* values for 3D tissue structures with varying cellular features in order to evaluate the potential of DSC-MRI to elucidate these features within real tissue.Methods
In our simulations, we generated 3D tissue structures using randomly distributed ellipsoids, representing cells, and meticulously manipulated cellular features to understand their impact on DSC-MRI signals.5- Cellular Volume Fraction. We altered the cellular volume fraction, ranging from 0.1 to 0.5 in 0.05 increments (Fig. 1a-b).
- Aspect Ratios. Aspect ratios, quantifying cell shape, were adjusted from 0.1 (flattest) to 0.9 (most spherical) in 0.1 increments (Fig. 1c-d).
- Aspect Ratio Heterogeneity. We mimicked cellular shape heterogeneity within a voxel by adjusting the aspect ratio range from 0 (all cells having an aspect ratio of 0.5) to 0.8 (aspect ratios ranging from 0.1 to 0.9).
- Cell Size Heterogeneity. We assessed the influence of cell size distribution by modifying the standard deviation of the radius from 1% (narrow distribution) to 40% (wide distribution) of the mean.
- Distinct Cell Populations. In another set of simulations, we created tissue structures with two distinct populations of cells. The smaller cells had a mean radius one-third the mean radius of the larger cells, and we varied the percentage of larger cells from 25% to 75%.
- Cell Size. For each scenario, we altered the mean radius of the largest (or sole) cell population from 5 to 40 μm in 5-μm increments.
For each group of simulated tissue structures, we harnessed the Finite Perturber Finite Difference Method (FPFDM)7 to replicate a dual-echo DSC-MRI sequence, using echo times of 5 and 35 milliseconds, while factoring in the influence of T1 effects. Our computational model integrated essential tissue parameters such as the cerebral blood volume, water diffusion coefficient, and T1 and T2 relaxation times. Furthermore, we used a susceptibility contrast, Δχ, of 0.05 ppm between the intracellular and extracellular spaces.
Results
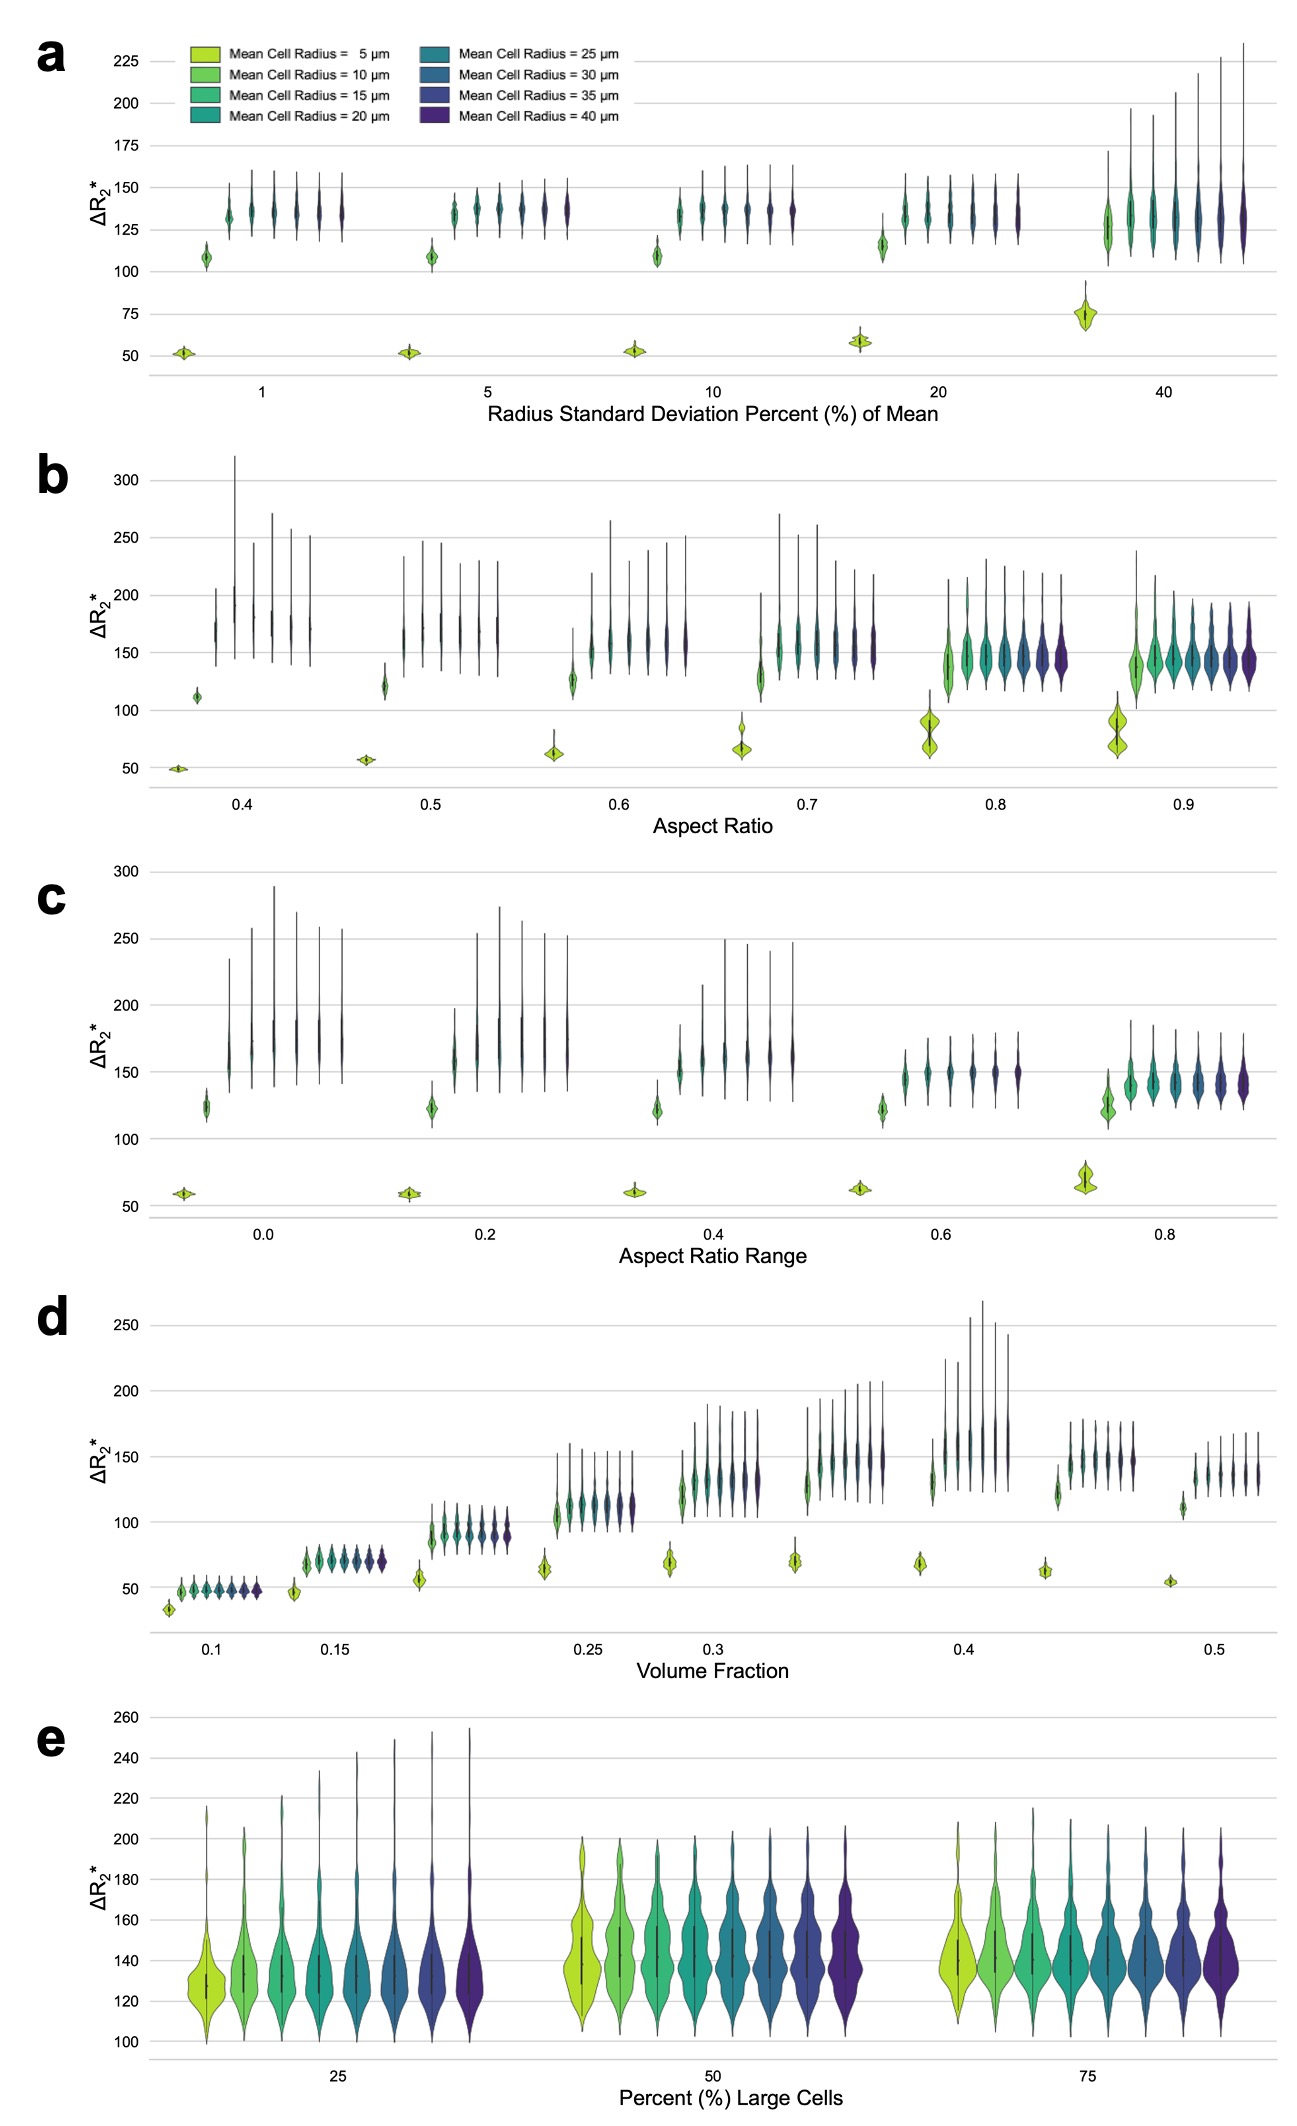
In all cases, as the mean cell radius increases from 5 microns to 40 microns, ΔR2* increases but plateaus for larger cells (Fig. 2). For structures with a smaller mean cell size, as the cell size heterogeneity increases, the ΔR2* increases, but for larger cell structures, this feature has a negligible effect (Fig. 2a). For smaller cell structures, ΔR2* increases as the aspect ratio increases, but this change is negligible for larger cell structures (Fig. 2b). As the aspect ratio heterogeneity increases, ΔR2* increases slightly for smaller cells but decreases slightly for larger cells (Fig. 2c). For all cell sizes, as the cell volume fraction increases, ΔR2* increases and then decreases slightly around a volume fraction of 0.4 (Fig. 2d). Varying the ratio of cells in tissue structures with a population of larger and smaller cells has a negligible effect on the ΔR2* values (Fig. 2e).Discussion and Conclusion
These results indicate that DSC-MRI signal is strongly dependent on cell volume fraction and cell size, with a smaller dependence on aspect ratio, aspect ratio range, and cell size heterogeneity. Varying the ratio of larger to smaller cells according to our specified parameters did not have a noticeable effect on DSC-MRI signal, but this cell feature may impact DSC-MRI signal for different cell populations. Our findings suggest that DSC-MRI and subsequent analyses may be applied to recover specific cellular features from brain tumor tissue that may serve as important biomarkers to better quantify disease heterogeneity and treatment effects. Future work involves developing dictionaries or training neural networks to extract cellular features from ΔR2* values and DSC-MRI signal profiles. An additional future direction is to model 3D structures that more closely reflect certain tissue types (e.g., white matter, gray matter) or pathologies (e.g., glioma, meningioma, glioblastoma) to further evaluate the feasibility of DSC-MRI for extracting useful cellular features.Acknowledgements
This work was supported by funding from The Cancer Prevention and Research Institute of Texas (CPRIT) RR220038 and NIH/NCI R01CA158079.
References
[1]. Shukla G, Alexander GS, Bakas S, Nikam R, Talekar K, Palmer JD, Shi W. Advanced magnetic resonance imaging in glioblastoma: a review. Chin Clin Oncol. 2017 Aug;6(4):40. doi: 10.21037/cco.2017.06.28. PMID: 28841802.
[2]. Law M, Oh S, Babb JS, Wang E, Inglese M, Zagzag D, Knopp EA, Johnson G. Low-grade gliomas: dynamic susceptibility-weighted contrast-enhanced perfusion MR imaging--prediction of patient clinical response. Radiology. 2006 Feb;238(2):658-67. doi: 10.1148/radiol.2382042180. Epub 2006 Jan 5. PMID: 16396838.
[3]. Maeda M, Itoh S, Kimura H, Iwasaki T, Hayashi N, Yamamoto K, Ishii Y, Kubota T. Tumor vascularity in the brain: evaluation with dynamic susceptibility-contrast MR imaging. Radiology. 1993 Oct;189(1):233-8. doi: 10.1148/radiology.189.1.8372199. PMID: 8372199.
[4]. Rosen BR, Belliveau JW, Vevea JM, Brady TJ. Perfusion imaging with NMR contrast agents. Magn Reson Med. 1990 May;14(2):249-65. doi: 10.1002/mrm.1910140211. PMID: 2345506.
[5]. Semmineh NB, Xu J, Boxerman JL, Delaney GW, Cleary PW, Gore JC, Quarles CC. An efficient computational approach to characterize DSC-MRI signals arising from three-dimensional heterogeneous tissue structures. PLoS One. 2014 Jan 8;9(1):e84764. doi: 10.1371/journal.pone.0084764. PMID: 24416281; PMCID: PMC3885618.
[6]. Semmineh NB, Xu J, Skinner JT, Xie J, Li H, Ayers G, Quarles CC. Assessing tumor cytoarchitecture using multiecho DSC-MRI derived measures of the transverse relaxivity at tracer equilibrium (TRATE). Magn Reson Med. 2015 Sep;74(3):772-84. doi: 10.1002/mrm.25435. Epub 2014 Sep 16. PMID: 25227668; PMCID: PMC4362846.
[7]. Pathak AP, Ward BD, Schmainda KM. A novel technique for modeling susceptibility-based contrast mechanisms for arbitrary microvascular geometries: the finite perturber method. Neuroimage. 2008 Apr 15;40(3):1130-43. doi: 10.1016/j.neuroimage.2008.01.022. Epub 2008 Jan 29. PMID: 18308587; PMCID: PMC2408763.
Figures
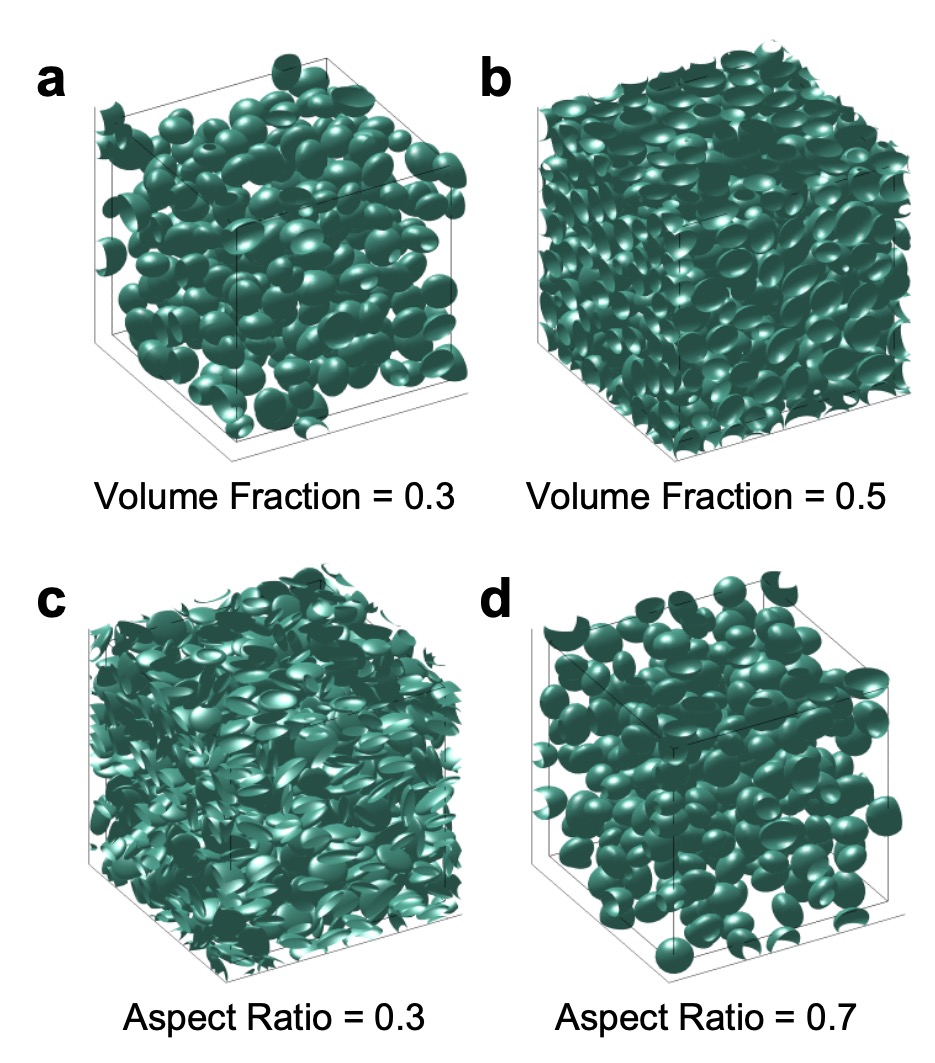
Example 3D tissue structures with ellipsoids of aspect ratio 0.7 are shown for varying volume fraction from (a) 0.3 to (b) 0.5. Tissue structures with a volume fraction of 0.3 are shown for varying aspect ratio from (c) 0.3 to (d) 0.7.