2613
Patterns of Popular Artifacts in QSM and χ-separation (chi-separation)1Department of Electrical and Computer Engineering, Seoul National University, Seoul, Korea, Republic of, 2Department of Radiology, Samsung Medical Center, Sungkyunkwan University School of Medicine, Seoul, Korea, Republic of, 3Institute of Behavioral Sciences in Medicine, Yonsei University College of Medicine, Seoul, Korea, Republic of, 4Department of Psychiatry, Yongin Severance Hospital, Yonsei University College of Medicine, Yongin, Korea, Republic of, 5Department of Radiology, Yongin Severance Hospital, Yonsei University College of Medicine, Yongin, Korea, Republic of, 6Heuron Co., Ltd, Seoul, Korea, Republic of, 7Department of Neurosurgery, Severance Hospital, Yonsei University College of Medicine, Seoul, Korea, Republic of, 8Department of Radiology, Severance Hospital, Yonsei University College of Medicine, Seoul, Korea, Republic of, 9Department of Neurology, Severance Hospital, Yonsei University College of Medicine, Seoul, Korea, Republic of, 10Department of Radiology and Research Institute of Radiology, University of Ulsan College of Medicine, Asan Medical Centre, Seoul, Korea, Republic of, 11Division of Biomedical Engineering, Hankuk University of Foreign Studies, Yongin, Korea, Republic of, 12Department of Radiology, Seoul National University Hospital, Seoul, Korea, Republic of, 13Department of Human Development and Family Studies, Colorado State University, Fort Collins, CO, United States, 14Department of Molecular, Cellular and Integrative Neurosciences, Colorado State University, Fort Collins, CO, United States, 15Alberta Children's Hospital Research Institute (ACHRI), Calgary, AB, Canada, 16Department of Pediatrics, University of Calgary, Calgary, AB, Canada
Synopsis
Keywords: Susceptibility/QSM, Artifacts, chi-separation
Motivation: In QSM and χ-separation (chi-separation), artifacts from various sources may be introduced. The oversight of these artifacts could lead researchers to analyse inaccurate maps, resulting in potentially erroneous conclusions.
Goal(s): The primary objective of this research is to investigate the characteristics, origins, and solutions related to artifacts encountered in QSM and χ-separation.
Approach: We processed QSM and χ-separation in 364 subjects from Parkinson’s disease, Alzheimer’s disease, hypertension, and alcohol-exposed adolescents development studies, reporting various types of artifacts. They are categorized and explored for origins and potential solutions.
Results: This study identified and provided solutions for 11 artifact types.
Impact: While processing QSM and χ-separation in diverse subjects and vendors, various artifacts emerged. This study categorized these artifacts, investigated origins, mitigation strategies, and discernible effects on QSM and χ-separation results, aiding researchers and practitioners in artifact identification, correction, and exclusion.
Introduction
QSM and χ-separation (chi-separation)1 techniques are invaluable for quantifying brain tissue susceptibility to support the study of iron accumulation and demyelination in neurodegenerative diseases2. However, artifacts in data acquisition and processing can introduce inaccuracy, impacting analysis reliability. It is important to recognize these artifacts and implement appropriate correction methods. In this study, we analysed data collected from healthy subjects and patients in various groups and from different vendors, and explored commonly encountered artifacts. The effects, origins, and potential solutions for these artifacts were investigated to improve the application of QSM and χ-separation.Methods
[Data] A total of 364 subjects (6 - 91 years, 52.24 ± 25.78 years, 163 males and 201 females) were included. The subject population consisted of healthy volunteers, Parkinson’s disease patients, Alzheimer’s disease patients, individuals with hypertension, and alcohol-exposed adolescents, among others. MR data were collected using six different 3T MRI scanners (Siemens Trio, Siemens Vida, Siemens Skyra, Philips Ingenia CX, Philips Ingenia Elition X, and GE Discovery 750w).[Data processing pipeline] All data processing for QSM and χ-separation was performed using the χ-separation toolbox (https://github.com/SNU-LIST/chi-separation). Phases were unwrapped using a Laplacian-based algorithm3. V-SHARP4 was applied to remove background fields. QSM was calculated using QSMnet5. R2* values were estimated using Auto-Regression on Linear Operations (ARLO)6. Co-registration of a T2-weighted image and a GRE data for calculating a R2’ map was performed using Advanced Normalization Tools (ANTs)7. χ-sepnet-R2*8 and χ-sepnet-R2’8 were utilized calculating χpara and χdia maps.
Results
Motion artifacts resulted in ghosting and blurring in QSM and χ-separation results (Figure 1a). Several strategies have been developed to address motion artifacts such as faster imaging9–11 or motion robust sequences12,13. Correction of motion artifacts in post data acquisition is often unfeasible without additional information.Respiration-induced B0 fluctuations can hinder QSM and χ-separation reconstruction process (Figure 1b) and diminish reproducibility and accuracy of QSM and χ-separation results14. When B0-navigation is acquired, this artifact can be effectively corrected15 (Figure 2).
When multi-channel coils are not correctly combined, introducing “phase singularities”, a localized high intensity region may appear (Figure 1c). To mitigate this artifact, appropriate coil combination should be used16.
An incorrectly reconstructed image using the GRAPPA algorithm may contain aliasing artifact (Figure 1d). If the raw data is available, one may reprocess the data for the correction.
Large slice thickness can lead to QSM underestimation17, R2* overestimation18, and ultimately overestimation of both χpara and χdia (Figure 1e). To mitigate this artifact, using isotropic voxels of at most 1 mm17.
Thin slab can lead to significant QSM underestimation17,19 due to truncated non-local dipole, which can impede χ-separation, causing underestimation of both dominant source in χpara and χdia maps (Figure 3). Deep learning-based methods20,21 have been proposed to address it.
Data from P*** vendor sometimes contained linear field bias. This bias led to residual phase wraps in QSM and χ-separation results (Figure 1g) when utilizing the nonlinear complex data fitting approach22 for echo combination and phase unwrapping. Unwrapping phase at each TE and subsequently combining multi-echo images can be the solution to address this artifact.
When using QSMnet, a local field map in radians may be mistakenly used instead of Hz. This mistake results in errors in the image intensity range (Figure 1h).
Many clinical scans utilize the imaging orientation along the anterior commissure-posterior commissure (AC-PC) line. If not corrected for B0 orientation during the processing, this may result in a misalignment of the magnetic dipole kernel with B0 direction by 15 degrees. Processing data with a tilted slab can lead to susceptibility errors23 (Figure 4), and therefore should be corrected before processing.
Within the data processing pipeline, format conversion from DICOM to NIfTI may unintentionally flip images. These errors can affect the alignment between T2-weighted and GRE magnitude images, resulting in an incorrect R2’ map. This erroneous R2’ value in χ-separation estimation can manifest as a prominent bright pattern in the cortical region (Figure 5).
Vessel flow artifacts can impact adjacent regions, leading to erroneously high or low values in QSM, χpara, and χdia maps (Figure 1k). To ensure accurate ROI analysis, it is advisable to exclude these affected regions.
Discussion and Conclusion
In this study, we reported various artifacts from 364 subjects. The diverse range of artifacts that impact QSM and χ-separation were analysed. Their origins and proposed practical solutions to mitigate their effects were investigated, thereby improving the precision and reliability of quantitative analysis in MRI studies. The inclusion of visual images as aids for artifact recognition benefits both researchers and practitioners, significantly enhancing data quality and interpretation across clinical and research studies.Acknowledgements
This work was supported by the National Research Foundation of Korea (NRF) grant funded by the Korea government (MSIT) (No. NRF-2021R1A2B5B03002783), the Brain Korea 21 Plus Project in 2023, and Institute of New Media and Communications (INMC), SNU.References
1. Shin, H.-G. et al. χ-separation: Magnetic susceptibility source separation toward iron and myelin mapping in the brain. NeuroImage 240, 118371 (2021).
2. Kim, W. et al. χ-Separation Imaging for Diagnosis of Multiple Sclerosis versus Neuromyelitis Optica Spectrum Disorder. Radiology 307, e220941 (2023).
3. Schofield, M. A. & Zhu, Y. Fast phase unwrapping algorithm for interferometric applications. Opt. Lett. 28, 1194 (2003).
4. Wu, B., Li, W., Guidon, A. & Liu, C. Whole brain susceptibility mapping using compressed sensing. Magn. Reson. Med. 67, 137–147 (2012).
5. Yoon, J. et al. Quantitative susceptibility mapping using deep neural network: QSMnet. NeuroImage 179, 199–206 (2018).
6. Pei, M. et al. Algorithm for fast monoexponential fitting based on Auto‐Regression on Linear Operations (ARLO) of data. Magn. Reson. Med. 73, 843–850 (2015).
7. Avants, B. B. et al. A reproducible evaluation of ANTs similarity metric performance in brain image registration. NeuroImage 54, 2033–2044 (2011).
8. Kim, M. et al. Chi-sepnet: Susceptibility source separation using deep neural network. in Proceedings of International Society of Magnetic Resonance in Medicine 30, 2464 (2022).
9. Sodickson, D. K. & Manning, W. J. Simultaneous acquisition of spatial harmonics (SMASH): Fast imaging with radiofrequency coil arrays. Magn. Reson. Med. 38, 591–603 (1997).
10. Pruessmann, K. P., Weiger, M., Scheidegger, M. B. & Boesiger, P. SENSE: Sensitivity encoding for fast MRI. Magn. Reson. Med. 42, 952–962 (1999).
11. Griswold, M. A. et al. Generalized autocalibrating partially parallel acquisitions (GRAPPA). Magn. Reson. Med. 47, 1202–1210 (2002).
12. Glover, G. H. & Pauly, J. M. Projection Reconstruction Techniques for Reduction of Motion Effects in MRI. Magn. Reson. Med. 28, 275–289 (1992).
13. Sarty, G. E. Single TrAjectory Radial (STAR) imaging. Magn. Reson. Med. 51, 445–451 (2004).
14. Choi, J. Y., Lee, J., Nam, Y., Lee, J. & Oh, S. Improvement of reproducibility in quantitative susceptibility mapping (QSM) and transverse relaxation rates (R2*) after physiological noise correction. J. Magn. Reson. Imaging 49, 1769–1776 (2019).
15. Wen, J., Cross, A. H. & Yablonskiy, D. A. On the role of physiological fluctuations in quantitative gradient echo MRI: implications for GEPCI, QSM, and SWI. Magn. Reson. Med. 73, 195–203 (2015).
16. Metere, R., Kober, T., Möller, H. E. & Schäfer, A. Simultaneous Quantitative MRI Mapping of T1, T2* and Magnetic Susceptibility with Multi-Echo MP2RAGE. PLoS ONE 12, e0169265 (2017).
17. Karsa, A., Punwani, S. & Shmueli, K. The effect of low resolution and coverage on the accuracy of susceptibility mapping. Magn. Reson. Med. 81, 1833–1848 (2019).
18. Fernández‐Seara, M. A. & Wehrli, F. W. Postprocessing technique to correct for background gradients in image‐based R*2 measurements. Magn. Reson. Med. 44, 358–366 (2000).
19. Elkady, A. M., Sun, H. & Wilman, A. H. Importance of extended spatial coverage for quantitative susceptibility mapping of iron-rich deep gray matter. Magn. Reson. Imaging 34, 574–578 (2016).
20. Zhu, X., Gao, Y., Liu, F., Crozier, S. & Sun, H. Deep grey matter quantitative susceptibility mapping from small spatial coverages using deep learning. Z. für Med. Phys. 32, 188–198 (2022).
21. Jung, S., Jeon, S. & Kim, D.-H. Harmonic Field Extension for QSM with Reduced Spatial Coverage using Physics-informed Generative Adversarial Network. (2023).
22. Liu, T. et al. Nonlinear formulation of the magnetic field to source relationship for robust quantitative susceptibility mapping. Magn. Reson. Med. 69, 467–476 (2013).
23. Kiersnowski, O. C., Karsa, A., Wastling, S. J., Thornton, J. S. & Shmueli, K. Investigating the effect of oblique image acquisition on the accuracy of QSM and a robust tilt correction method. Magn. Reson. Med. 89, 1791–1808 (2023).
Figures
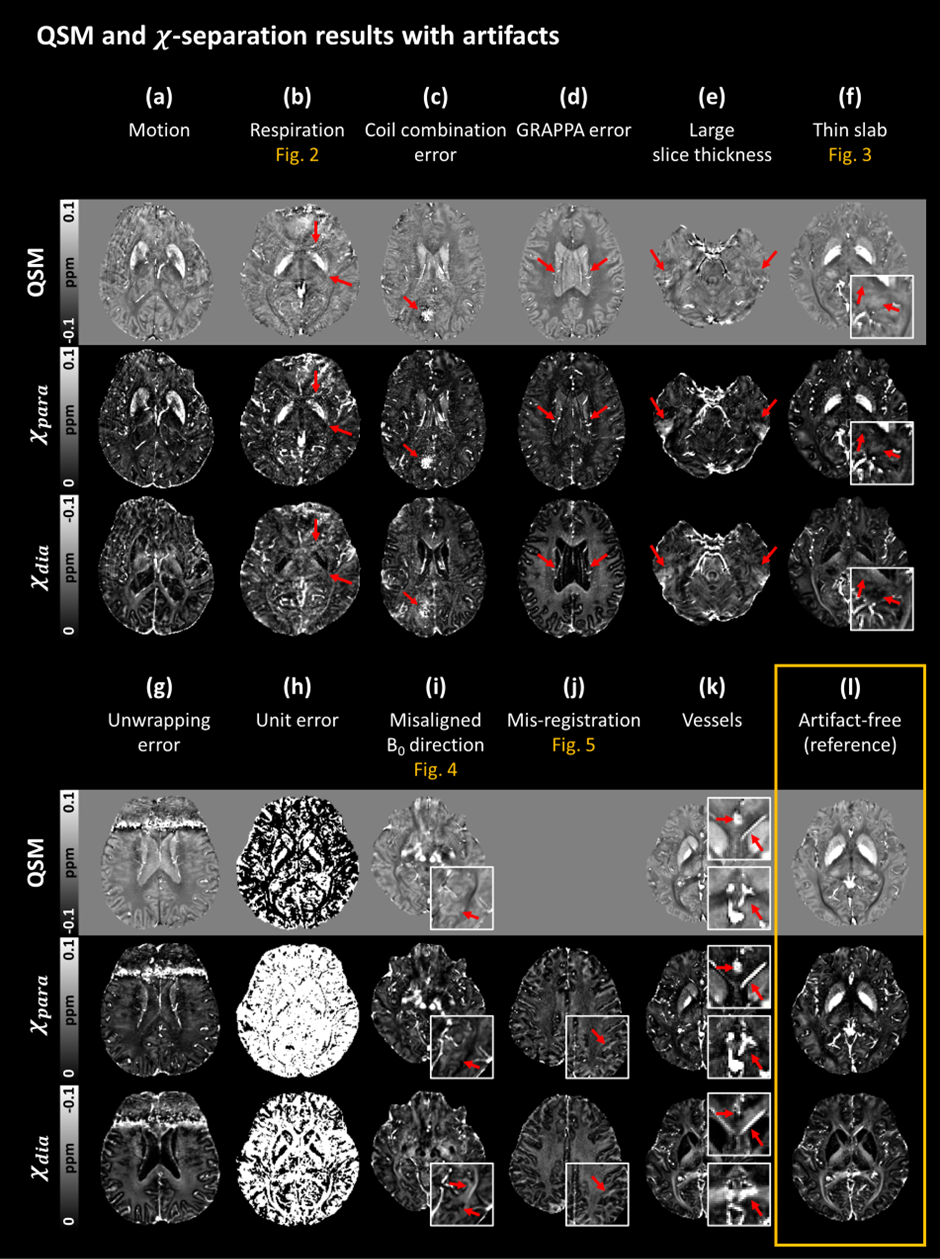
Figure 1. QSM, χpara and χdia maps displaying various artifacts. (a) Motion, (b) respiration-induced B0 fluctuation, (c) incorrect coil combination, (d) GRAPPA reconstruction error, (e) large slice thickness, (f) thin slab, (g) unwrapping error, (h) unit mismatch, (i) misaligned B0 direction, (j) mis-registration between R2* and R2, and (k) vessels generated artifacts in QSM, χpara and χdia while (l) presents no artifacts. Red arrows highlight areas where artifacts are observed. For the artifacts in (b, f, i, and j), Figures 2-5 illustrate artifact-free images.
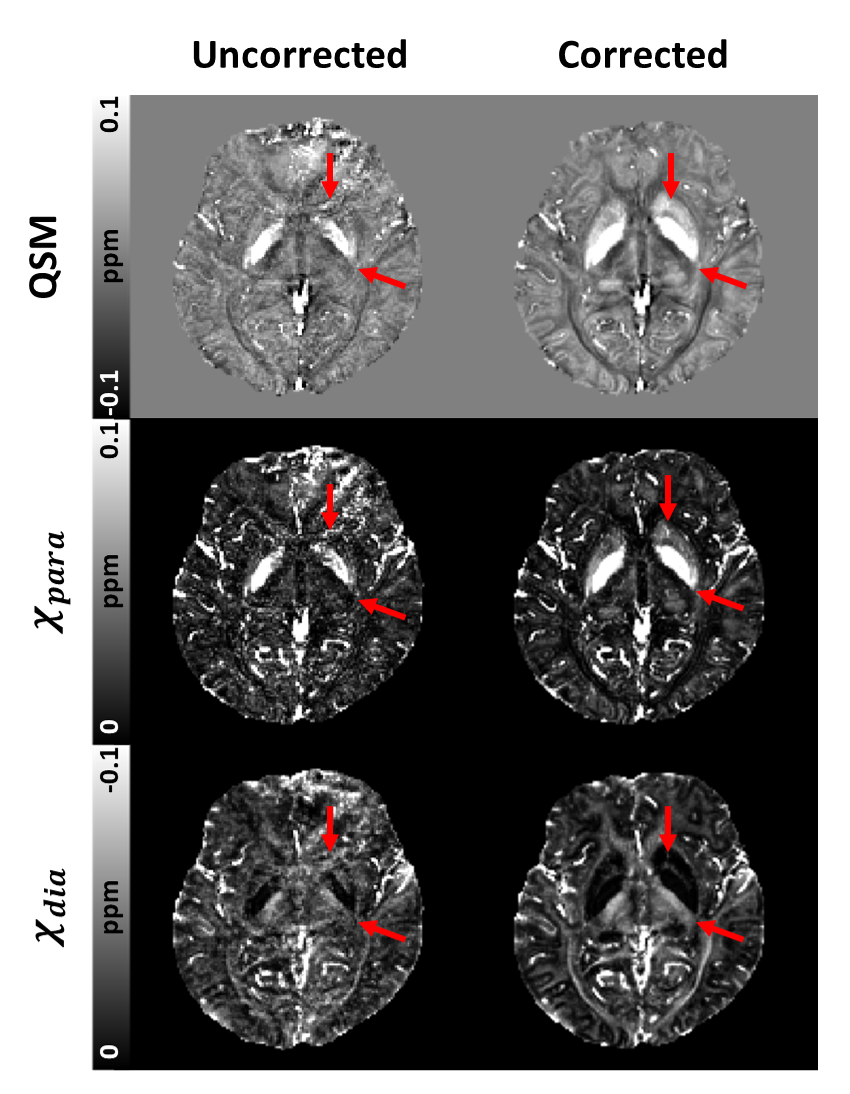
Figure 2. Respiration-induced artifacts and artifact-corrected maps. The first column represents QSM and χ-separation results with respiration-induced artifacts (red arrows), while the second column displays the results after applying the navigator-based correction method15. The third column shows the differences between these two sets of results.
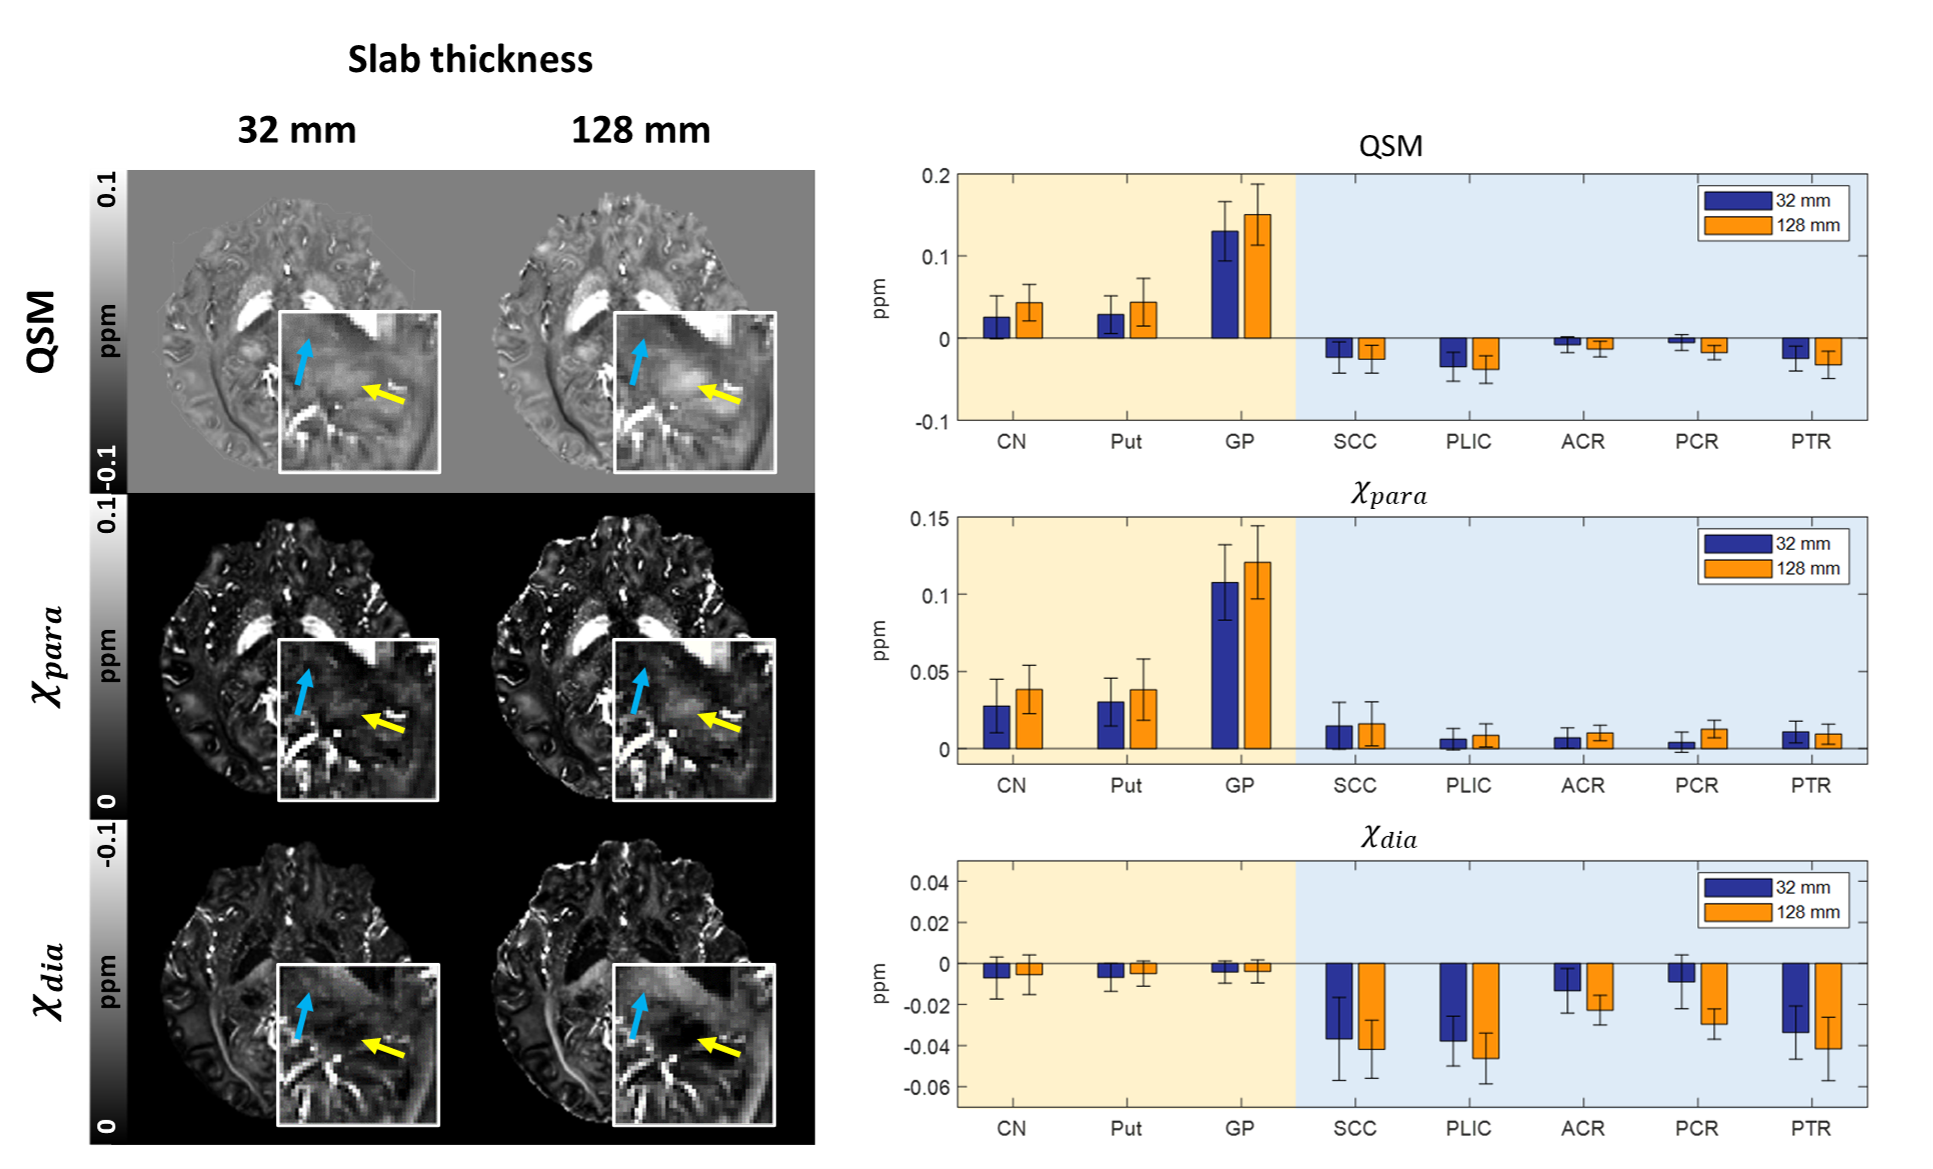
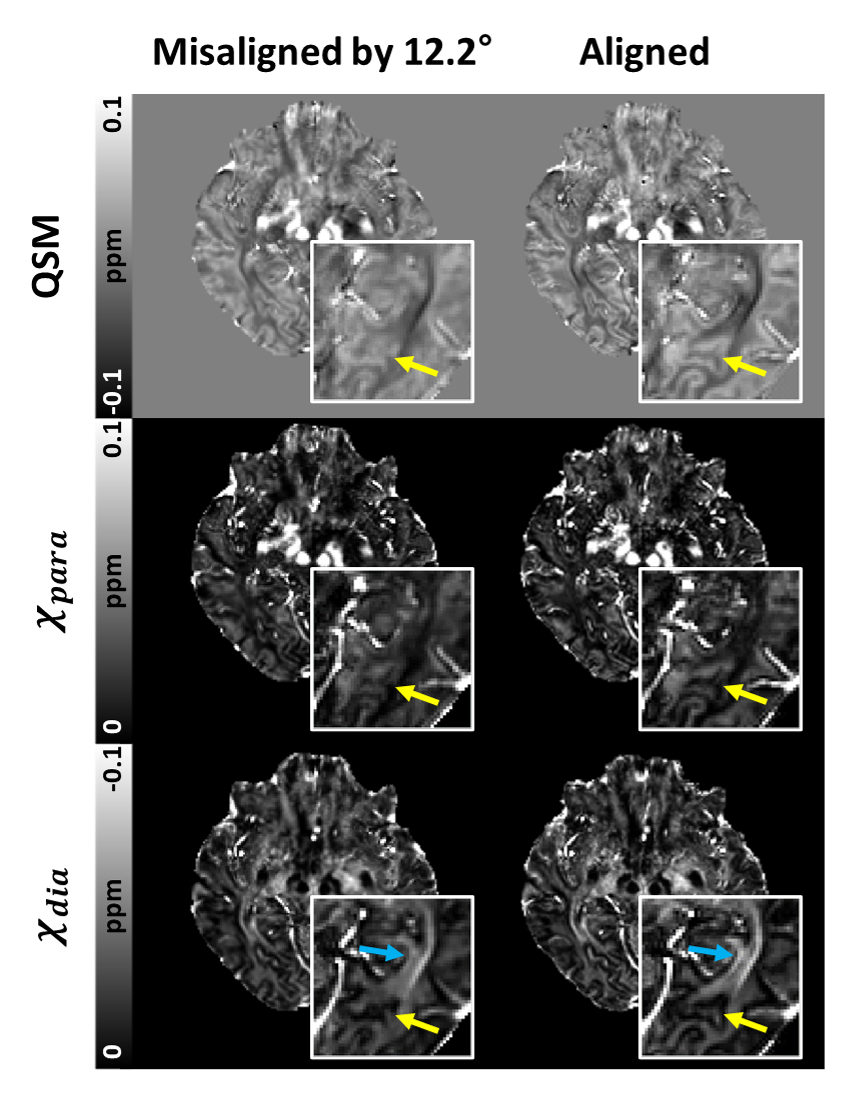
Figure 4. Impact of B0 direction alignment on QSM and χ-separation results. QSM, χpara and χdia maps processed with the oblique magnetic dipole exhibited reduced contrasts between cortical gray and white matter regions (indicated by yellow arrows). In the χdia maps, the contrast in the optical radiation (OR) (indicated by blue arrows) was diminished. As the results, the overall contrasts in the misaligned maps are reduced.
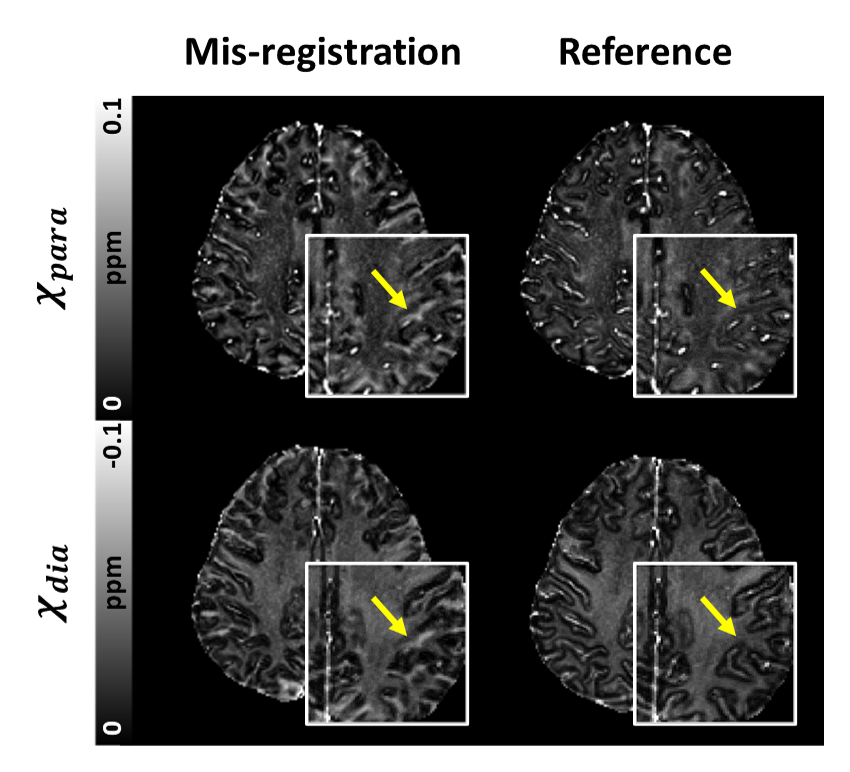
Figure 5. χpara and χdia maps with the incorrect (left) and correct (right) registration between R2 and R2* maps. When χ-sepnet-R2’ was applied with an R2’ map generated from misregistered R2* and R2 maps, it led to abnormally bright patterns on ridge on the cerebral cortex in both χpara and χdia (yellow arrows). The χ-sepnet-R2’ results with properly registered maps did not exhibit such patterns.