2611
Evaluation of Quantitative Susceptibility Mapping Methods for Cerebral Cavernous Malformation in Mice at 9.4T1Department of Biomedical Engineering, University of Virginia, Charlottesville, VA, United States, 2Department of Neurosurgery, University of Virginia, Charlottesville, VA, United States, 3Department of Physics, University of Virginia, Charlottesville, VA, United States, 4Department of Radiology & Medical Imaging, University of Virginia, Charlottesville, VA, United States
Synopsis
Keywords: Susceptibility/QSM, Quantitative Susceptibility mapping
Motivation: While GRE and SWI are the primary methods for identifying iron deposition in cerebral cavernous malformation (CCM), improved preclinical lesion characterization can be achieved by using Quantitative Susceptibility Mapping (QSM).
Goal(s): Our goal was to introduce the use of QSM in a preclinical CCM model and evaluate the impact of the different QSM methods available.
Approach: 8 healthy mice and 13 CCM mice were scanned using a multi-gradient echo and images were processed through each QSM method then compared using RMSE.
Results: Each QSM method displayed large susceptibilities in areas suspected of CCM lesions.
Impact: The addition of QSM for preclinical CCM may benefit longitudinal analysis. By establishing the use of QSM and further development in QSM calibration with ex vivo studies, QSM can be used for tracking CCM lesion progression noninvasively.
Purpose
Although Gradient-Recalled Echo (GRE) and Susceptibility Weighted Imaging (SWI) are widely accepted methods for the investigation of cerebral cavernous malformation (CCM) due to a unique pattern of signal loss, there is a limitation determining the characteristic of a lesion based on areas of signal loss alone. CCM is a prevalent vascular pathology which consists of dilated hemorrhagic capillaries in the brain and brainstem [1]. These capillaries are suspected of consistently leaking and leaving iron biomarkers causing localized signal loss. It would be advantageous to use Quantitative Susceptibility Mapping (QSM) which would permit more accurate determination of magnetic susceptibility biomarkers that may be present in CCM lesions. Given the variety in QSM development and research for characterizing CCM in humans, this study aims to explore prominent QSM methods and investigate the differences among these methods when applied to a CCM murine model at a higher magnetic field strength. This choice is motivated by the excessive susceptibility variations inherent to cerebral cavernomas [2].Method
A total of 21 mice scans were used in this analysis (8 healthy mice and 13 CCM mice). All MR images were acquired in vivo using a 9.4 T Bruker BioSpec 94/20 imaging spectrometer with a 4-channel surface coil. Bruker’s standard 3D multigradient echo sequence, T2star map MGE, was performed using a flip angle of 25 degrees, TR of 28ms, and TEs of 2.5, 5, 7.5, 10, 12.5, 15, 17.5, 20ms, with a slab thickness of 16mm. The image matrix was 128x128x128 voxels at 0.125mm isotropic resolution. The total time per scan was 11.6 mins. Raw data was manually sorted and reconstructed into complex images using Brkraw [3], SigPy, and custom code. Coil combination was conducted with ASPIRE [4] which provided larger area coverage for obtaining phase information. Brain masks were manually segmented using Meta’s Segment-Anything Model (SAM) [5] and finetuned using morphological filters to fill gaps and improve segmentation masks. QSM analysis was conducted using phase accrual determined by linearly fitting phase from all eight echoes after Laplacian Unwrapping [6]. V-SHARP background removal [7] was then used and resulting field maps were passed into closed form solution [8], Morphology Enabled Dipole Inversion (MEDI) [9], Direct Tikhonov (DT) [10,11], Iterated Tikhonov (IT) [10,11], Truncated K-space Division (TKD) [10,11,12], iLSQR [7,13], STreaking Artifact Reduction (STAR) [13], Nonlinear Dipole Inversion (NDI) [14], Total Variation (TV) [15,16,17], Total Generalized Variation (TGV) QSM [15,18]. Tissue reference was set to “none” to ensure comparability between techniques. The resulting susceptibility maps from each QSM method were then averaged and compared using root mean squared error (RMSE).Results
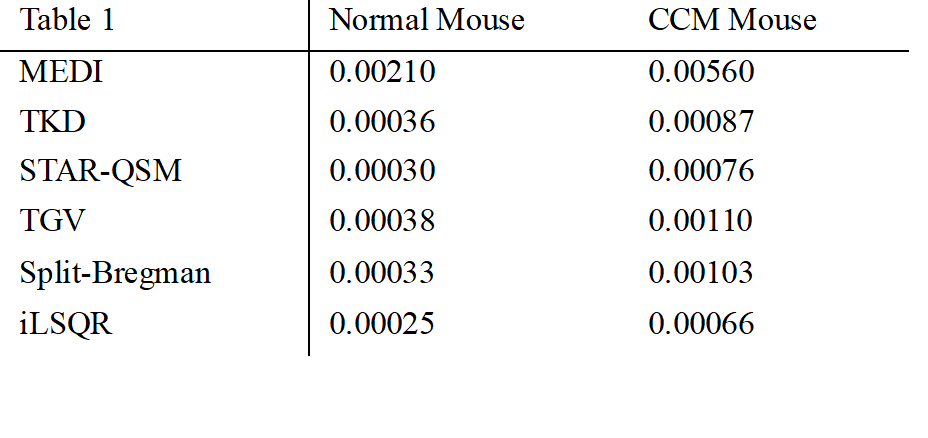
High magnetic susceptibility in suspected regions of CCM lesions were exquisitely shown in all QSM methods (figure 1) which is not present in normal mice (figure 2). Notice the distinguishable anatomical features of the ventricles in the TGV (C) and STAR (D) QSM in relation to a T2star-weighted magnitude image (A) and SWI (B) as shown in figure 3. Two lesions (red arrows) with exceptional susceptibility cause persisting staircasing artifacts despite using increased regularization factors. Lesion susceptibilities measured varied from 0.4-1ppm. Table 1 exhibits the RMSE of various QSM methods in comparison to an average for both CCM mice and healthy mice. CCM mice tended to have higher RMSEs compared to their healthy counterpart.Discussion
Our preliminary results further support that CCM lesions possess a large magnetic susceptibility in the murine model. However, the magnitude images exhibit the lack of the characteristic “mulberry” shape indicating possible differences between murine and human CCM or the limitation of the Bruker 9.4T image spectrometer. Results have shown consistent high susceptibility measurements between the various QSM methods although the variations based on Table 1 show that MEDI has a larger RMSE compared to other methods. Therefore, selection of a QSM method will require further ex vivo studies to assess quantitative accuracy. These results also suggest that the large susceptibilities in these lesions are indicative of potential hemosiderin iron deposits of a corresponding concentration. One challenge with current QSM methods for CCM analysis is determining an optimal regularization factor (lambda) for mice with excessively high susceptibility values. Increasing lambda can increase the fitting power, however, at the cost of overregularization. Further study in murine models and phantom models remains necessary to determine the correlation between QSM and concentrations of high susceptibility biomarkers in CCM lesions.Acknowledgements
I want to extend my thanks to Dr. Xu Li (John Hopkins), Dr. Ning Hua (Boston University), and Dr. Berkin Bilgic (Martinos Center for Biomedical Imaging) for their insightful conversation on QSM and Dr. SungHo Lee (UNC) for providing software which served as the basis of my image reconstruction framework.
Funding support provided by R01-EB030744.
References
[1] Shenkar R. et al. Neurosurgery 63(4):790-798 (2008).
[2] Tan H. et al. Invest Radiol. 2014 Jul; 49(7): 498–504.
[3] Lee S. et al. Zenodo. http://doi.org/10.5281/zenodo.3877179
[4] Eckstein K. et al. Magn Reson Med 79:2996–3006, 2018.
[5] Kirillov A. arXiv:2304.02643
[6] Schofield, M. A. & Zhu, Y. Fast phase unwrapping algorithm for interferometric applications. Opt Lett 28, 1194–1196 (2003).
[7] Li, W., Wu, B. & Liu, C. Quantitative susceptibility mapping of human brain reflects spatial variation in tissue composition. Neuroimage 55, 1645–1656 (2011).
[8] Bilgic, B. et al. Fast image reconstruction with L2‐regularization. J Magn Reson Imaging 40, 181–191 (2014).
[9] Liu, T. et al. Morphology enabled dipole inversion (MEDI) from a single-angle acquisition: Comparison with COSMOS in human brain imaging. Magn Reson Med 66, 777–783 (2011).
[10] Shmueli, K et al. (2009). Magnetic susceptibility mapping of brain tissue in vivo using MRI phase data, Magnetic Resonance in Medicine vol 62 issue 6, 1510-1522.
[11] Schweser, F et al. (2013). Toward online reconstruction of quantitative susceptibility maps: superfast dipole inversion, Magnetic Resonance in Medicine vol 69 issue 6, 1581-1593.
[12] Wharton, S., Schäfer, A. & Bowtell, R. Susceptibility mapping in the human brain using threshold-based k-space division. Magn Reson Med 63, 1292–1304 (2010).
[13] Wei, H. et al. Streaking artifact reduction for quantitative susceptibility mapping of sources with large dynamic range. NMR Biomed 28, 1294–1303 (2015).
[14] Polak D., Chatnuntawech I., Yoon J., Srinivasan Iyer S., Lee J., Setsompop K., and Bilgic B. VaNDI: Variational Nonlinear Dipole Inversion enables QSM without free parameters (program number 0319). Proceedings of the International Society for Magnetic Resonance in Medicine 2019, Montreal Canada
[15] Milovic, C., Bilgic, B., Zhao, B., Acosta-Cabronero, J. & Tejos, C. Fast nonlinear susceptibility inversion with variational regularization. Magn Reson Med 80, 814–821 (2018).
[16] Bilgic, B. et al. Fast quantitative susceptibility mapping with L1‐regularization and automatic parameter selection. Magn Reson Med 72, 1444–1459 (2014).
[17] Bilgic, B., Chatnuntawech, I., Langkammer, C. & Setsompop, K. Sparse methods for Quantitative Susceptibility Mapping. in (eds. Papadakis, M., Goyal, V. K. & Van De Ville, D.) 9597, 959711 (SPIE, 2015).
[18] Langkammer, C, Neuroimage. 2015 May 1;111:622-30. doi: 10.1016/j.neuroimage.2015.02.04
Figures
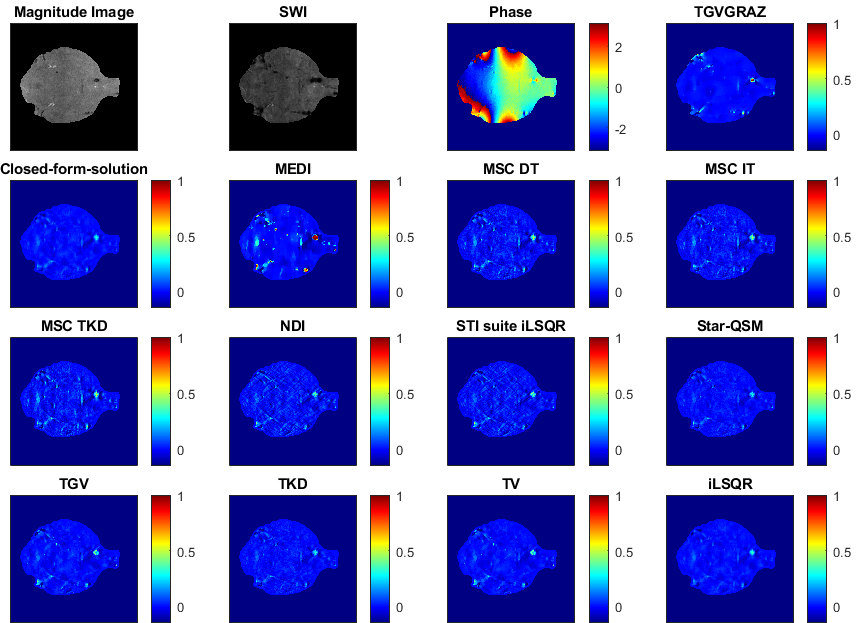
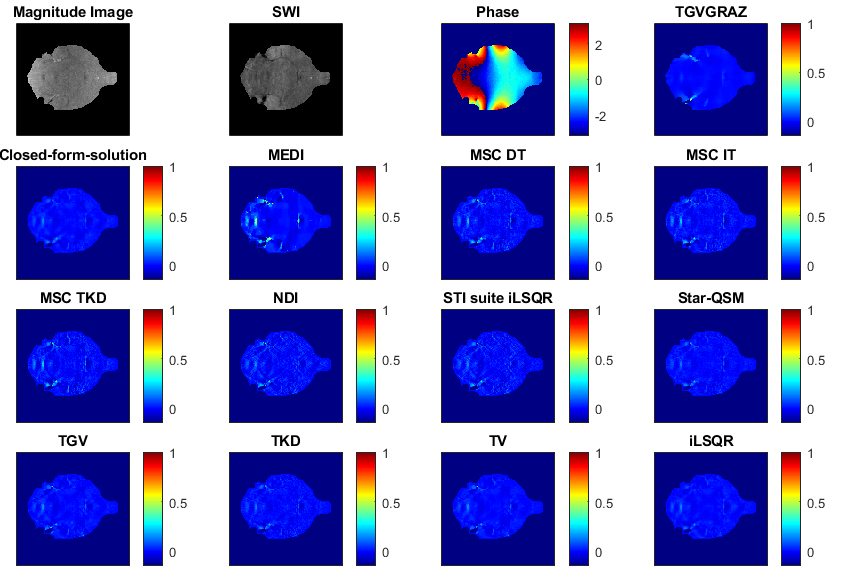
Figure 2: Magnitude, SWI, and unfiltered phase images with QSM images generated from multiple algorithms for normal mice. QSM images are scaled from -0.15 to 1 ppm.
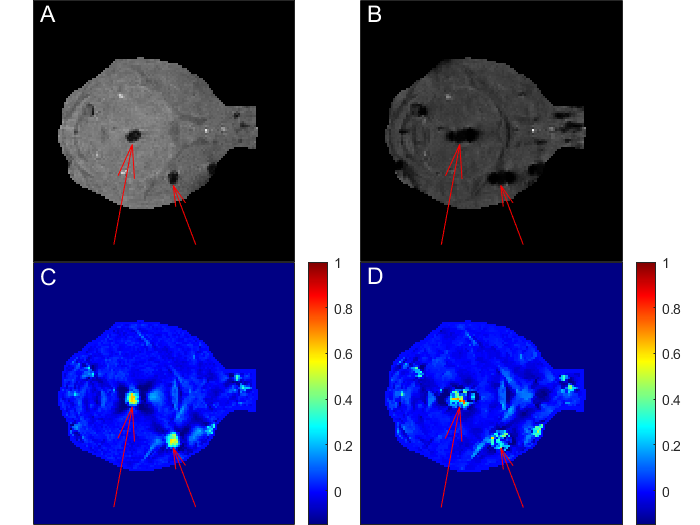
Figure 3: Comparison of magnitude image (A) and SWI (B) with TGV (C) and STAR (D) QSM. Susceptibility maps were threshold from -0.10 to 1 ppm to emphasize lesions. Arrows point to severe lesions.