2610
Response linearity of functional Quantitative Susceptibility Mapping (fQSM) and effect of reduced z-coverage: a pilot study1IRCCS Stella Maris Foundation, Pisa, Italy, 2INFN Pisa Division, Pisa, Italy, 3University of Genoa, Genoa, Italy, 4IMAGO7 Research Center, Pisa, Italy, 5Neuroradiology Unit, Department of Translational Research on New Technologies in Medicine and Surgery, University of Pisa, Pisa, Italy, 6GE HealthCare, Waukesha, WI, United States
Synopsis
Keywords: Susceptibility/QSM, Quantitative Susceptibility mapping, functional Quantitative Susceptibility Mapping
Motivation: fQSM quantitative and spatially-specific information on brain activity may be valuable in studying cortical substructures. However, fQSM response to varying stimulus intensity is unknown, and, as for QSM, reduced z-coverage may affect quantification.
Goal(s): We aimed to assess fQSM linearity to stimulus intensity and its dependence on z-coverage.
Approach: We employed visual stimuli with different contrasts and acquired whole-brain fQSM datasets that were truncated to simulate partial coverage.
Results: We reported fQSM response linearity to different contrasts and, while extremely small coverage led to brain activity underestimation, whole-brain acquisitions were not necessary to obtain accurate results.
Impact: Linearity and feasibility at reduced z-coverage, together with high spatial specificity, suggest that fQSM may provide added value to the functional study of cortical substructures.
Introduction
Functional Quantitative Susceptibility Mapping (fQSM) relies on the phase of GRE-EPI fMRI time-series and QSM algorithms to detect and quantify susceptibility variation following brain activity. Previous studies assessed fQSM feasibility showing lower sensitivity but higher spatial specificity with respect to fMRI1–3. Response linearity to stimulus properties is necessary to employ fQSM as a quantitative technique but has not yet been investigated.The high spatial specificity makes fQSM a potentially powerful tool for the study of small structures like cortical layers and columns at ultra-high field. These applications require extremely high spatial resolution which is often obtained at the expense of smaller brain coverage (z-coverage). However, QSM underestimates susceptibility for partial z-coverage4 and this may reduce the accuracy of quantitative fQSM at laminar/columnar level.
In this preliminary study, we aimed to assess the linearity of fQSM response and the impact of reduced z-coverage on fQSM accuracy and sensitivity.
Methods
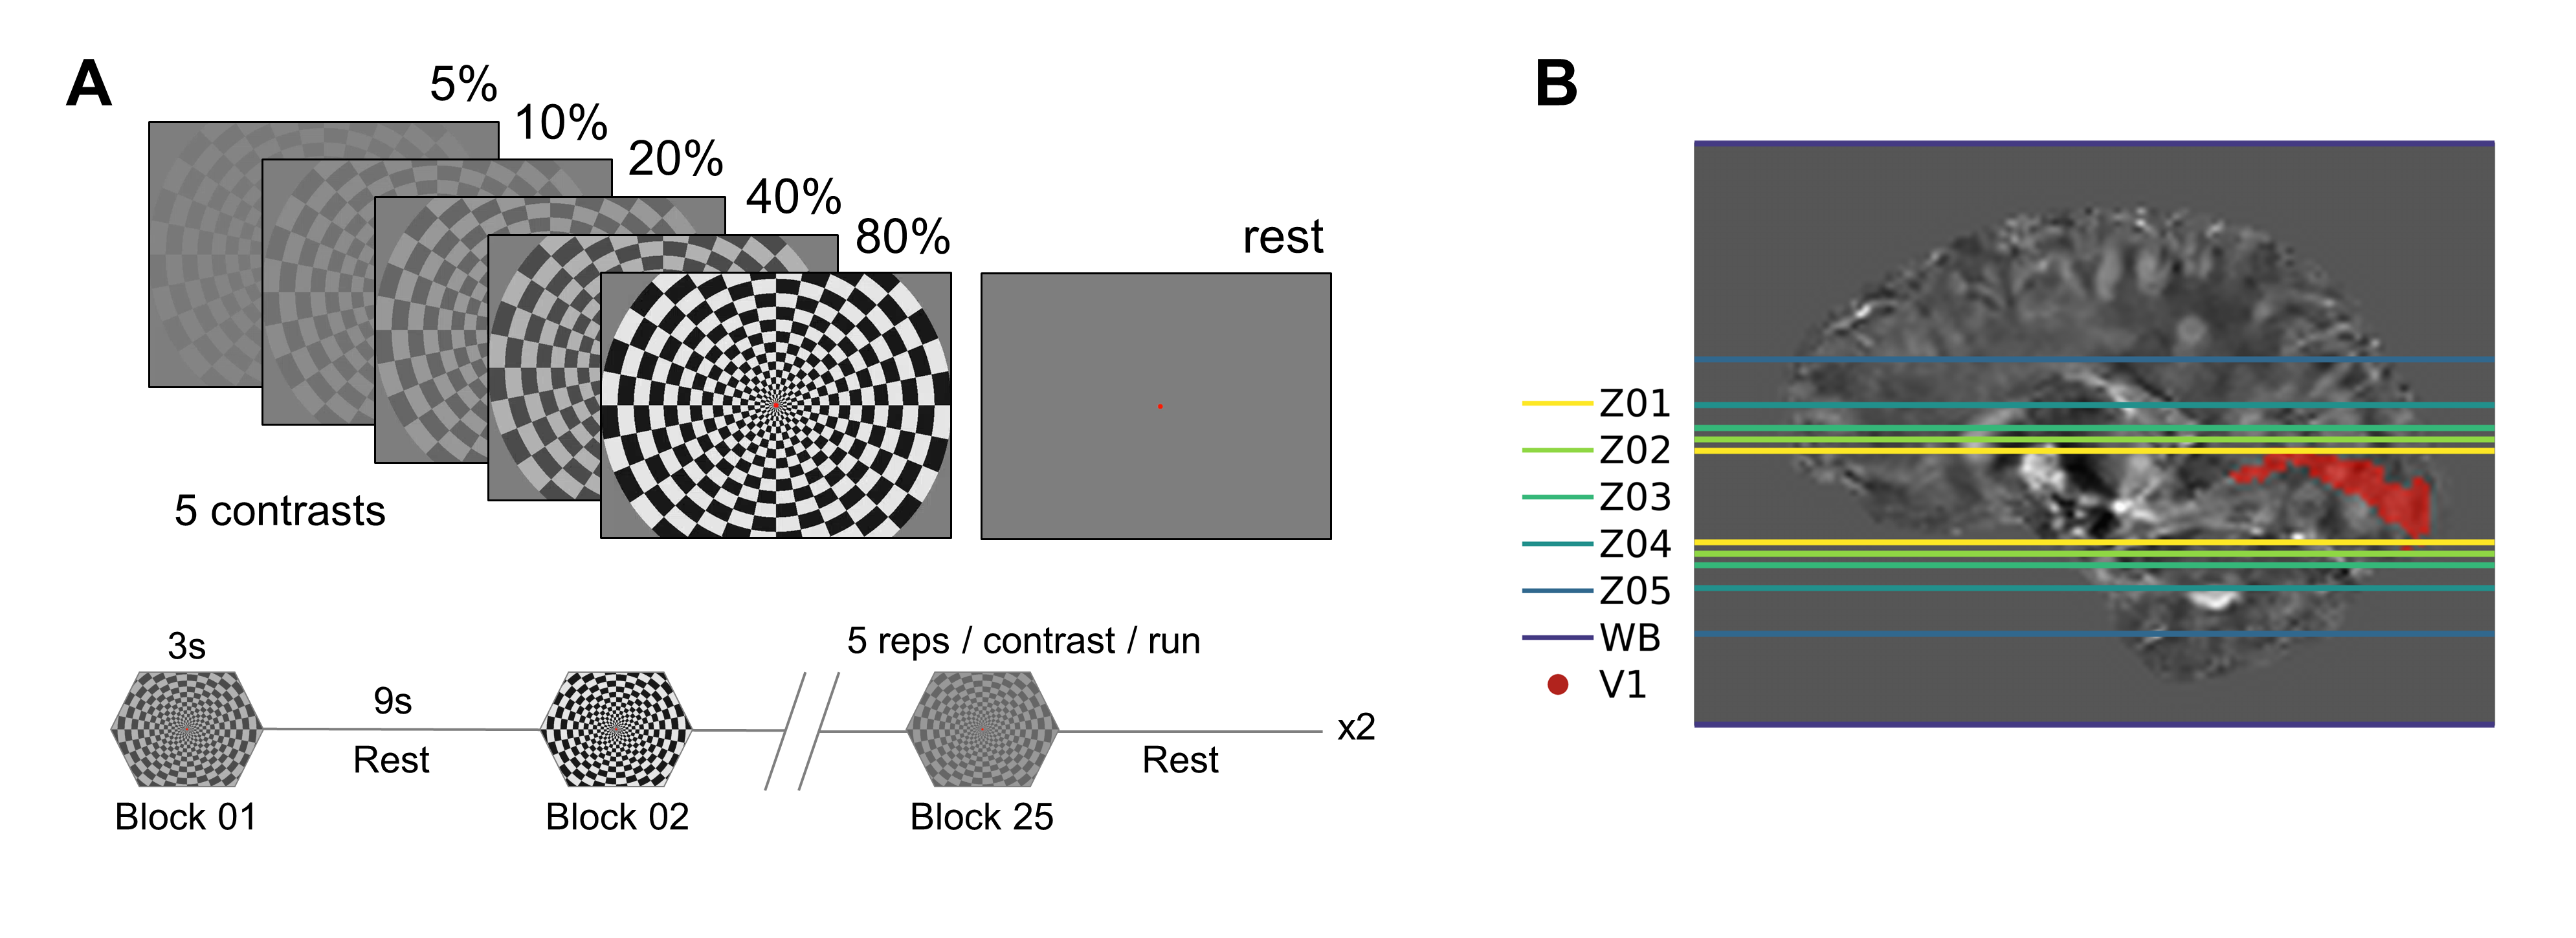
To explore the linearity of fQSM response we employed a visual functional paradigm consisting of flickering checkerboards with 5 logarithmically-spaced contrasts (5%-10%-20%-40%-80%) delivered in a pseudo-random order in 3s-blocks, interleaved by 9s-rest periods (gray screen) (Figure 1A). Subjects fixated a red dot at the center of the screen.Two healthy volunteers (S01-S02, 1F/1M, 32 yo) underwent a scan session on a SIGNA7T MR system (GEHealthCare). The protocol included a T1w-MPRAGE sequence (voxel size=0.7x0.7x0.7mm3) for anatomical reference and two complex-valued whole-brain (WB) functional scans via multi-band 2D GRE-EPI (voxel size=1.5x1.5x1.5mm3, 102 slices; TR=3s; TE=22ms; FA=77°; FOV=210x210mm2; ARC factor=3; multi-band factor=2). Each functional run consisted of 100 volumes plus four discarded dummy volumes (scan time=5min12s), followed by the acquisition of 10 volumes with opposite phase-encoding direction for distortion correction. Each stimulation condition was presented five times per run.
To simulate acquisitions with reduced z-coverage focused on the primary visual cortex, the raw WB fQSM dataset was truncated. The smallest coverage (Z01) was defined by the borders of V1 from Harvard-Oxford cortical atlas5 registered to subject space. Then, the coverage was incrementally extended by 2-4-8-16 slices (Z02-05) for each side (Figure 1B).
fQSM time-series were computed via Laplacian-based unwrapping6, joint 2D-3D VSHARP7,8 and iLSQR9 (STISuite). fMRI, fQSM, and T1w images were processed as described in 2. The time-series were analyzed with a GLM approach.
Active regions were identified as the voxels showing significant (p<0.01 FDR-corrected) positive or negative responses to all stimulation conditions for fMRI and fQSM, respectively. We computed the average GLM β in active areas and its standard error and analyzed the dependence on the logarithm of the contrast level for both fMRI and fQSM via Pearson’s correlation and its size variation for different z-coverages.
Results
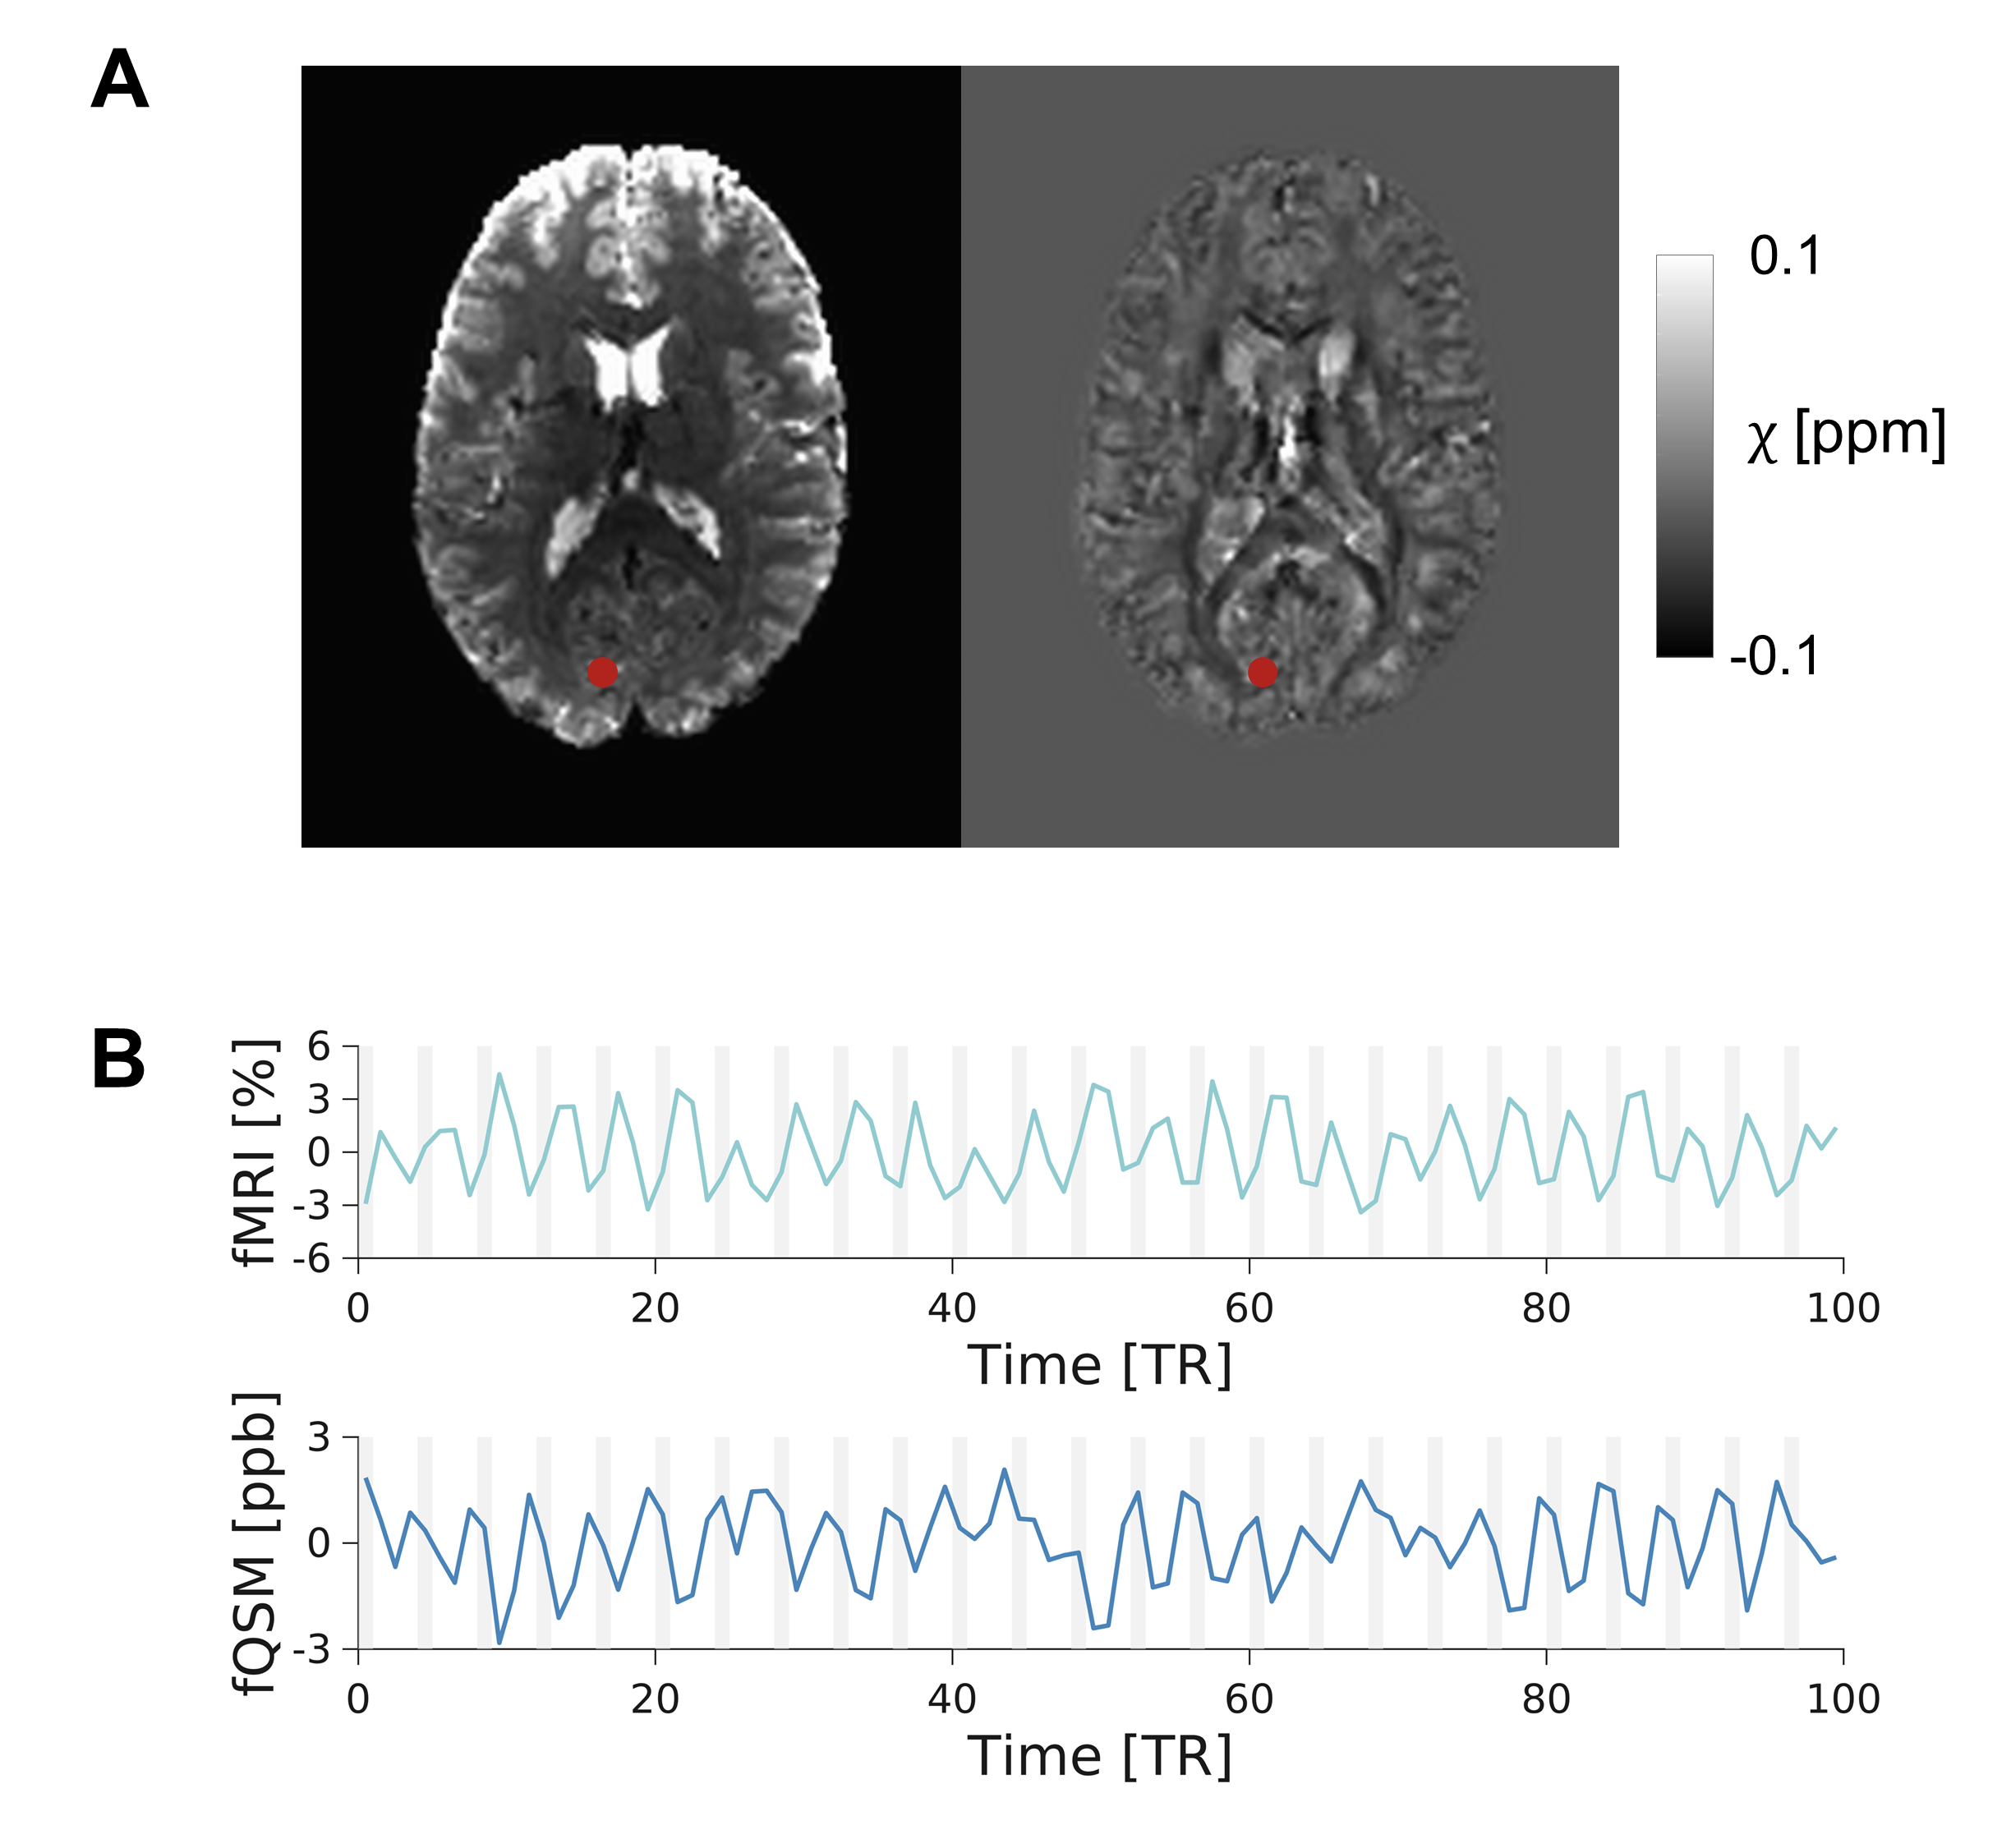
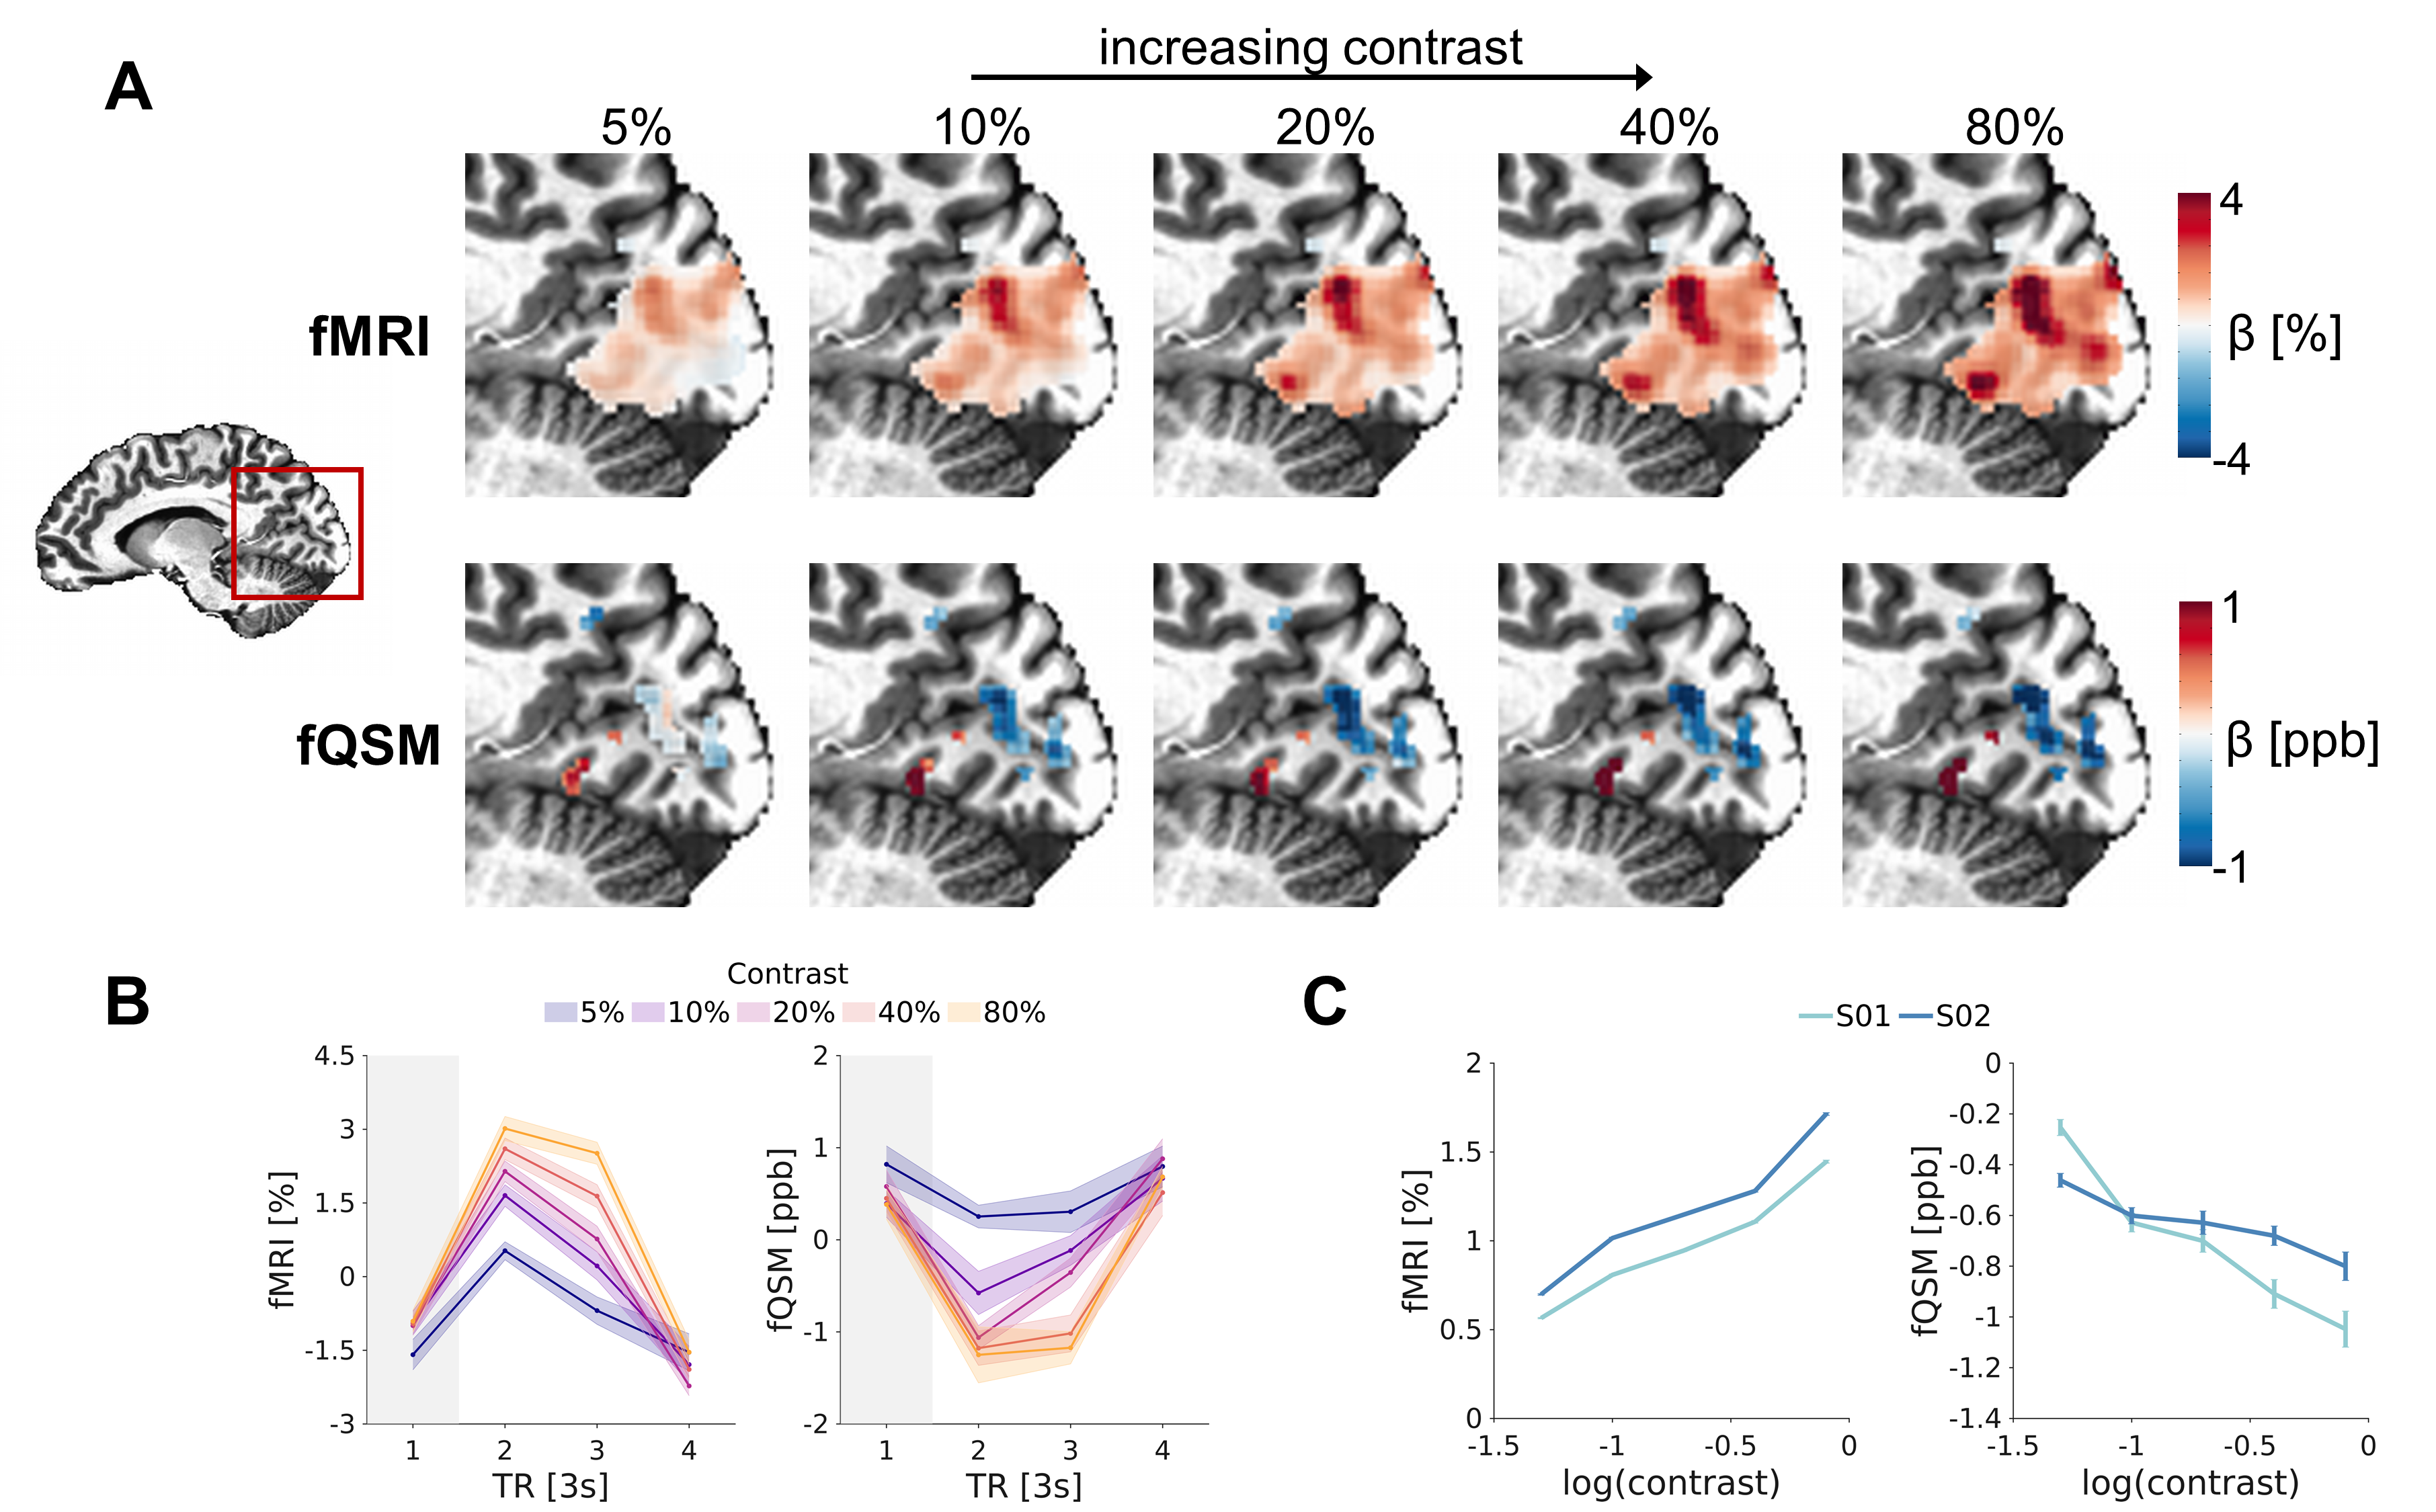
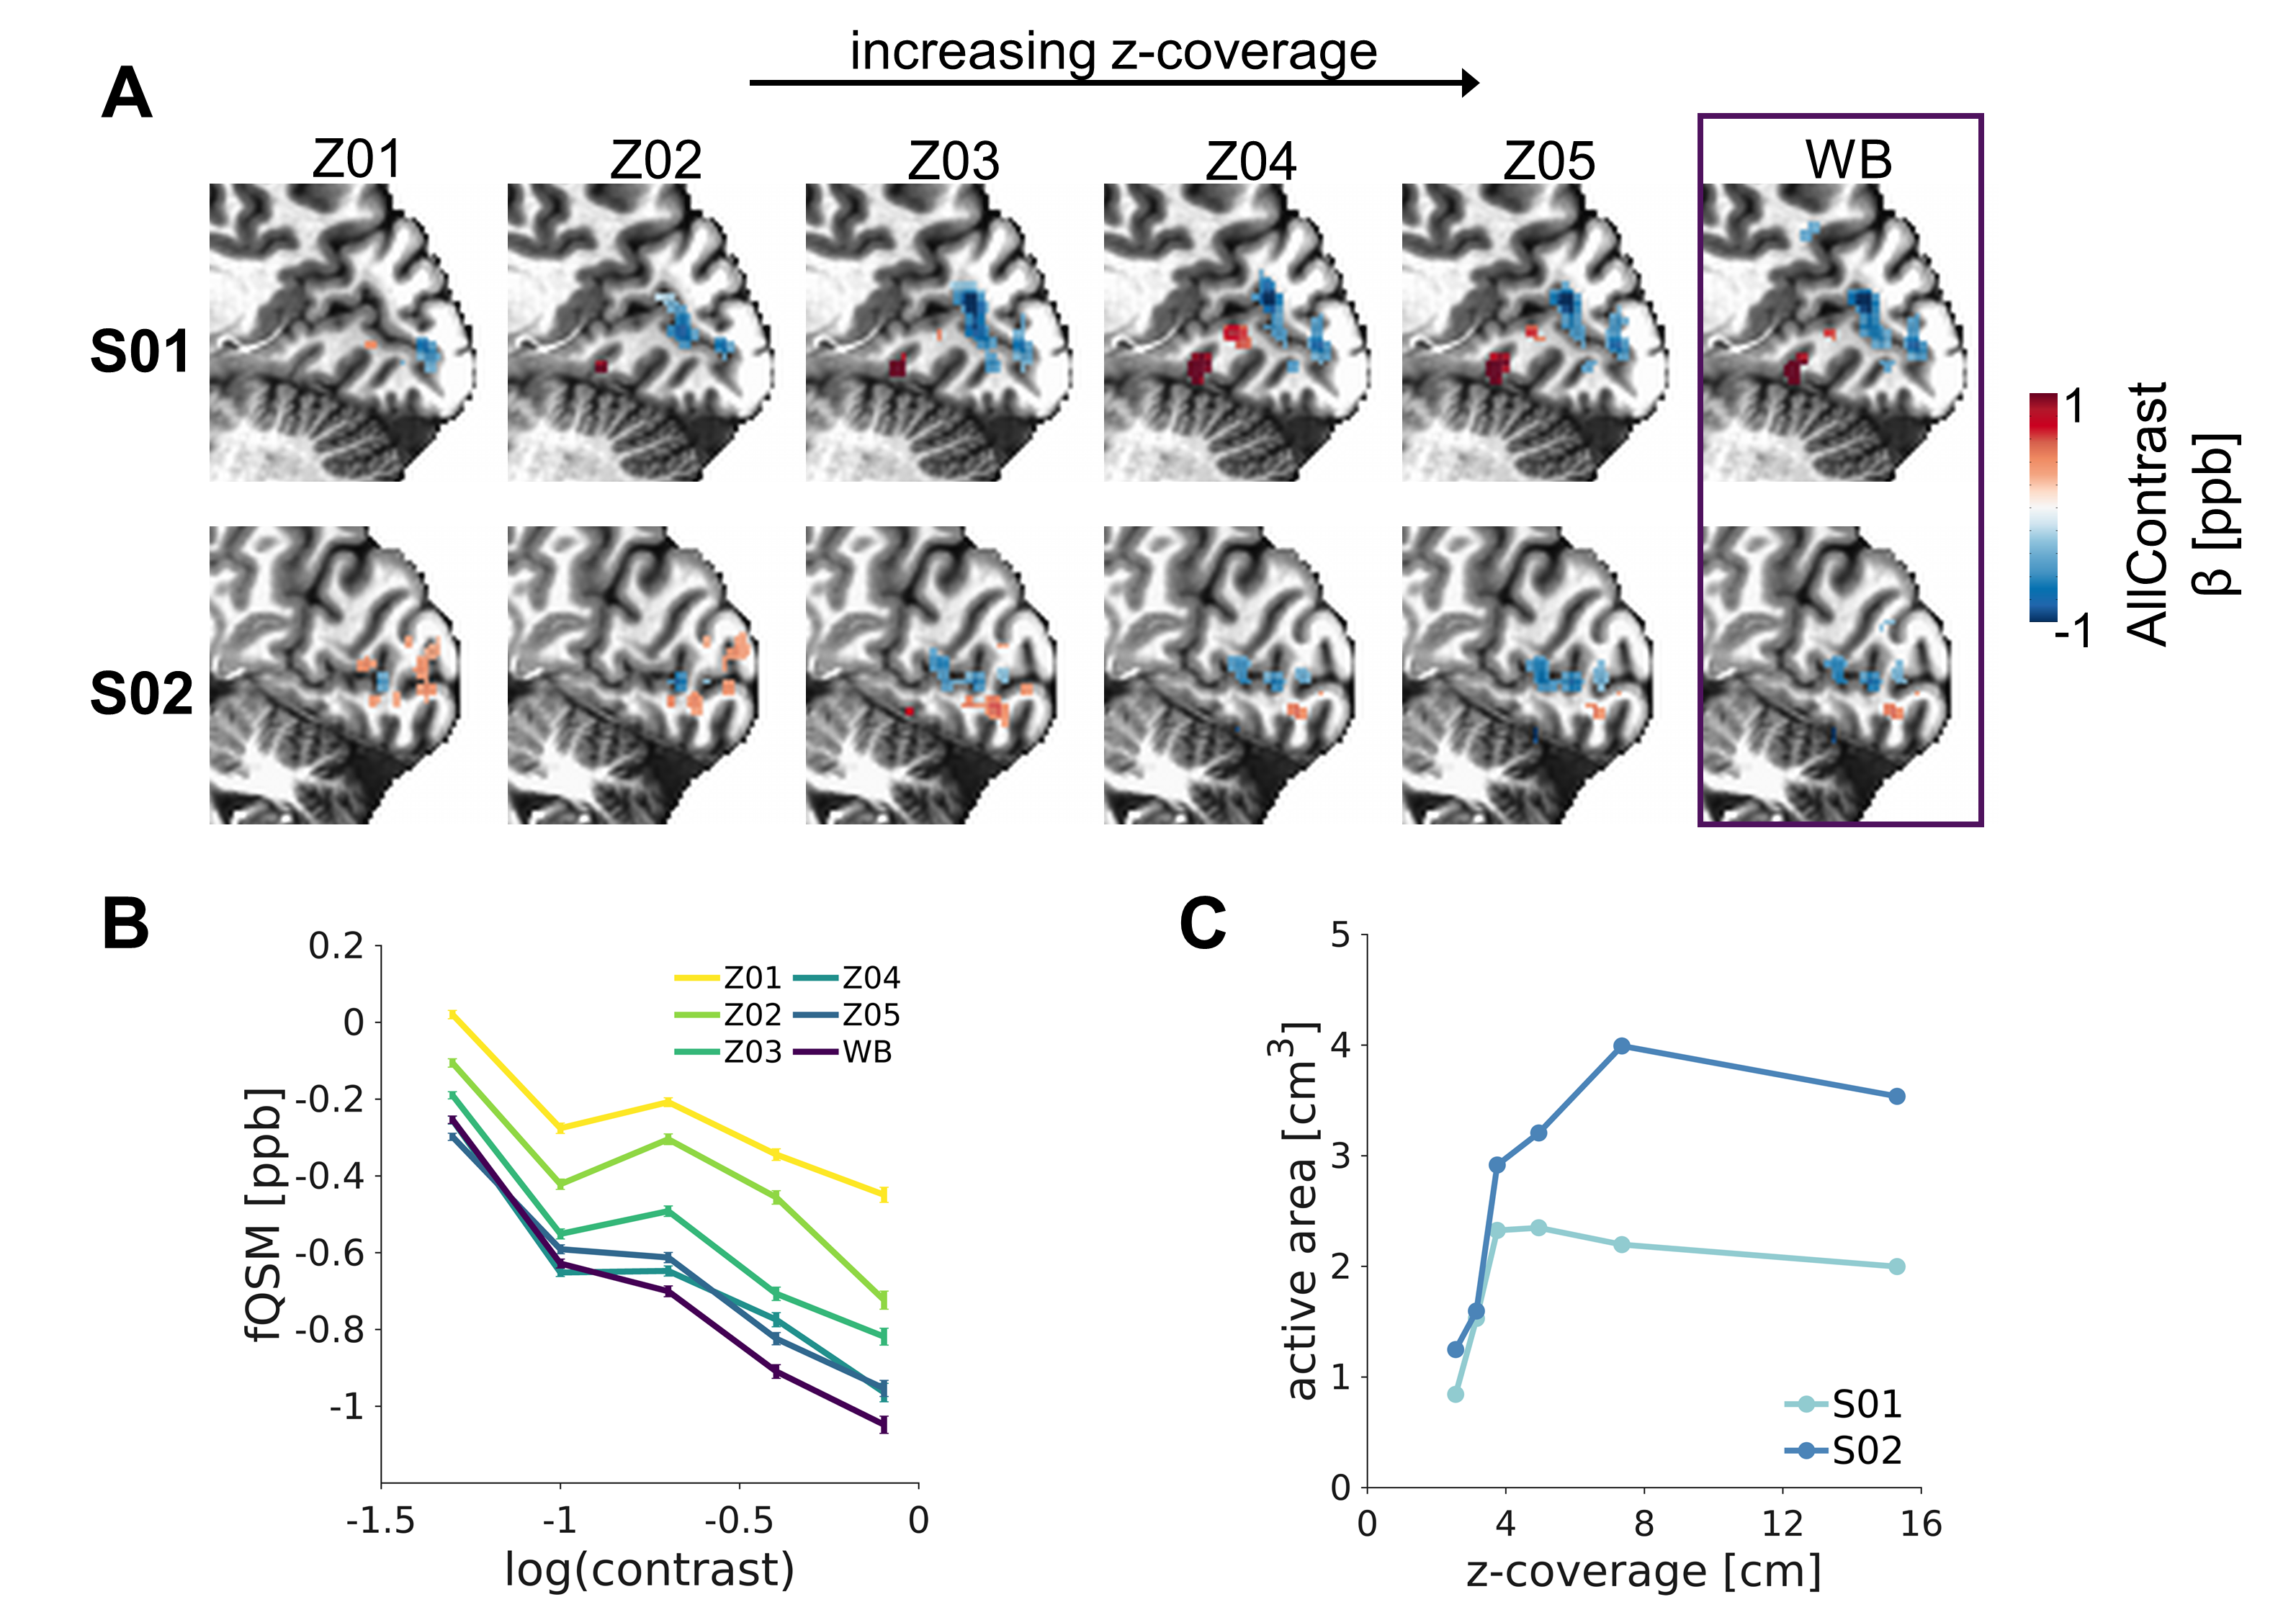
Exemplary fMRI and fQSM images and the time-series of an active voxel are displayed in Figure 2A-B. The activation maps show more localized responses in the calcarine sulcus for fQSM than for fMRI (Figure 3A). For increasing stimulus contrast, we observed a gradually incrementing positive or negative response for fMRI and fQSM, respectively (Figure 3B). The mean β for fMRI in the active region ranged from 0.6±0.1% for 5% contrast to 1.6±0.2% for 80% contrast, and from -0.4±0.1ppb to -0.9±0.2ppb for fQSM, averaged across subjects (Figure 3C). We reported excellent β-contrast correlation for both techniques (rfMRI=0.98, rfQSM=-0.97; p<0.01).Both size and response of active areas were reduced as the z-coverage was progressively truncated (Figure 4A, from right to left). While still showing a dependence of activity on the stimulus contrast, fQSM with reduced coverage was less sensitive to stimuli (lower absolute β) and to differences between conditions (smaller β range across conditions) (Figure 4B). The size of the active region increased steeply from Z01 to Z03 while it stabilized starting from Z04 for S01 and Z05 for S02, i.e., when z-coverage encompasses additional ∼2cm from the borders of the region-of-interest (Figure 4C).
Discussion
We reported that the fQSM quantitative response varies linearly with stimulus contrast. However, fQSM signal variations are affected by brain coverage. While this may represent an issue for fQSM application to laminar studies, we observed that Z04-05 provided similar β and active regions to the WB reference, indicating that WB coverage may not be necessary. This could enable laminar/columnar fQSM especially exploiting multi-band acquisitions. As a pilot study, small sample size is a limitation to this work. Moreover, we only considered negative fQSM responses as the origin of positive ones remains unclear.Conclusion
We showed linearity and feasibility at reduced z-coverage of fQSM that, together with its spatial specificity, may provide added value to the functional study of cortical substructures.Acknowledgements
This study was supported by the Italian Ministry of Health via the SPIN project (RCR-2022-23682285), the DeBrAIn project (CCR-2017-23669082) of the Pediatric Network IDEA and the grant RC to IRCCS Fondazione Stella Maris.References
1. Balla DZ, Sanchez-Panchuelo RM, Wharton SJ, et al. Functional quantitative susceptibility mapping (fQSM). NeuroImage. 2014;100:112-124. doi:10.1016/j.neuroimage.2014.06.011
2. Lancione M, Costagli M, Handjaras G, et al. Complementing canonical fMRI with functional Quantitative Susceptibility Mapping (fQSM) in modern neuroimaging research. NeuroImage. 2021;244:118574-118574. doi:10.1016/J.NEUROIMAGE.2021.118574
3. Ozbay PS, Kasper L, Pruessmann KP, Nanz D. Discrimination of Volumes with Positive and Negative Functional QSM Activation Within FMRI-Positive Volumes in High-Resolution, High-Field Task-Based and Resting-State Data. In: ISMRM 25th Annual Meeting. ; 2017.
4. Elkady AM, Sun H, Wilman AH. Importance of extended spatial coverage for quantitative susceptibility mapping of iron-rich deep gray matter. Magn Reson Imaging. 2016;34(4):574-578. doi:10.1016/J.MRI.2015.12.032
5. Desikan RS, Ségonne F, Fischl B, et al. An automated labeling system for subdividing the human cerebral cortex on MRI scans into gyral based regions of interest. NeuroImage. 2006;31(3):968-980. doi:10.1016/j.neuroimage.2006.01.021
6. Li W, Wu B, Liu C. Quantitative susceptibility mapping of human brain reflects spatial variation in tissue composition. NeuroImage. 2011;55(4):1645-1656. doi:10.1016/j.neuroimage.2010.11.088
7. Wei H, Zhang Y, Gibbs E, Chen NK, Wang N, Liu C. Joint 2D and 3D phase processing for quantitative susceptibility mapping: application to 2D echo-planar imaging. NMR Biomed. 2016. doi:10.1002/nbm.3501
8. Schweser F, Deistung A, Lehr BW, Reichenbach JR. Quantitative imaging of intrinsic magnetic tissue properties using MRI signal phase: an approach to in vivo brain iron metabolism? NeuroImage. 2011;54(4):2789-2807. doi:10.1016/j.neuroimage.2010.10.070
9. Li W, Wang N, Yu F, et al. A method for estimating and removing streaking artifacts in quantitative susceptibility mapping. NeuroImage. 2015;108:111-122. doi:10.1016/j.neuroimage.2014.12.043
Figures