2608
Assessing the Reproducibility of χ-separation: Comparative Analysis of Two Modeling Approaches with Quantitative Susceptibility Mapping1Department of Electrical and Computer Engineering, Seoul National University, Seoul, Korea, Republic of, 2Hongik University, Seoul, Korea, Republic of, 3Division of Biomedical Engineering, Hankuk University of Foreign Studies, Seoul, Korea, Republic of
Synopsis
Keywords: Susceptibility/QSM, Data Analysis
Motivation: Magnetic susceptibility in MRI offers non-invasive insights into brain substances like iron and myelin, affecting brain function and disease. The χ-separation method promises to enhance these insights by better estimating substance concentrations.
Goal(s): To assess the test-retest reproducibility of χ-separation methods to ensure their reliability for wider use in both research and clinical settings.
Approach: Reproducibility was tested by repeating scans using 3T MRI. Statistical analysis by Bland-Altman, regression, and ICC were used for evaluation.
Results: χ-separation demonstrated high reproducibility for both positive and negative susceptibility map analyses compared to previous study regarding QSM
Impact: This study affirms the robustness of χ-separation in MRI, enhancing the detection of iron and myelin concentrations and paving the way for more accurate brain pathology studies, potentially revolutionizing both clinical diagnostics and research into neurodegenerative diseases.
Introduction
Magnetic resonance imaging (MRI) offers non-invasive insights into brain anatomy and function. One emerging MRI contrast of interest is magnetic susceptibility, rooted in measurements such as T2* decay. This contrast reveals vital information about iron and myelin, crucial to brain function and diseases with opposite magnetic properties. the χ-separation method, based on a novel biophysical model, has been introduced to estimate the concentration of these substances even within the same voxel1. While preliminary results are promising, ensuring its reliability is paramount. This study aims to assess the test-retest reproducibility of χ-separation, evaluating the consistency and potential of χ-separation methods based on two models of χ-senetR2’ and χ-sepnetR2* for broader application in research and clinical settings.Materials and Methods
Five volunteers (age = 33 ± 18.28 years; 2 males and 3 females) underwent scans on a 3T MRI scanner (MAGNETOM Vida, Siemens Healthcare). 3D multi-echo GRE, double-echo TSE, and MPRAGE sequences were obtained. Multi-echo gradient-echo and double-echo TSE protocols were repeated within 30 minutes for reproducibility analysis. Data processing has been done using the χ-separation toolbox (https://github.com/SNU-LIST/chi-separation). Phases were unwrapped using a Laplacian-based algorithm2 to generate field maps, with V-SHARP3 applied for background field removal. QSM and R2* values were derived using QSMnet4 and ARLO5, respectively. Image co-registration for R2’ value computation utilized ANTs (https://github.com/ANTsX/ANTs). χ-separation was performed using χ-sepnetR2*6 and χ-sepnetR2’6 models for χ-positive and χ-negative maps calculation. Among the used methods, χ-sepnetR2’ were processed with R2’ maps while χ-sepnetR2* used R2* maps. The values within 21 ROIs, encompassing 6 subcortical nuclei and 15 white matter bundles, were quantitatively analyzed. ROIs were generated by registering the T1-weighted image with the QSM map, subsequently registered to the MuSus-1007 hybrid image atlas in MNI space via ANTs. Mean and standard deviations over ROIs were captured for reproducibility analysis for QSM and χ-separation maps. The reproducibility of measurements was appraised using the Bland-Altman method, linear regression, and the intraclass correlation coefficient (ICC). Previous study8 on QSM reproducibility were compared as a standard.Results
QSM and χ-separation positive maps are illustrated in Figure 1. Figure 2 presents the results from Bland-Altman analysis and regression analysis for QSM and χ-separation positive maps. For Bland-Altman analysis, the absolute mean of difference and limits of agreement (LoA) for positive and negative maps showed similar values for χ-sepR2* and χ-sepR2’. Figure 3 and 4 shows the images and analysis results for χ-separation negative maps. Similar trends were observed with regression analysis.Intraclass correlation (ICC) results for QSM and positive maps for χ-sepnetR2* and χ-sepnetR2’ were 0.9962, 0.9943, and 0.9939, respectively. For negative maps, the ICC results for χ-sepnetR2* and χ-sepnetR2’ were 0.9893 and 0.9833, respectively.
The results from previous study8 of QSM reproducibility for Bland-Altman were mean of 0.2 and LoA of 16.6. Results for regression were slope of 1.01 and R2 of 0.95.
Discussion
Though all models showed good scan-rescan reproducibility, χ-sepnetR2* and χ-sepnetR2’ afford superior visualization of deep gray matter anatomical areas compared to QSM.Comparing the two models, reproducibility test results of χ-sepnetR2’ and χ-sepnetR2* showed similarly high reproducibility for all positive maps analyses. Among the two models, χ-sepnetR2’ showed slightly lower reproducibility which seems to be due to an inaccurate R2 fitting process.
Comparing the QSM results from this study with the previous study8, this study showed more densely clustered points around lower values. This result is due to the previous study’s focus on deep gray matter and this study selecting six ROIs from deep gray matter and an additional 15 ROIs from white matter. Positive maps exhibit a similar trend as QSM, but with a denser distribution of points.
Negative maps from χ-sepnetR2* and χ-sepnetR2’ are depicted in Figure 3. Compared with positive maps in Figure 1, negative maps present superior visualization for white matter regions. The reproducibility analysis in Figure 4 ensures the reproducibility of negative susceptibility maps. Compared to positive maps, negative maps showed an overall lower concentration of susceptibility sources, leading to lower absolute mean of difference and LoA.
Conclusion
This study proved the reproducibility of χ-separation by statistical analysis and comparison with QSM, promising its application in research and clinical areas. Also, this study revealed the differences regarding reproducibility and the quality within different processes of χ-sepnetR2* and χ-sepnetR2. However, due to inaccurate R2’ maps, further studies with improved data are required for better comparison of R2’ generated maps with R2* generated maps.Acknowledgements
No acknowledgement found.References
1. Shin, H.-G. et al. χ-separation: Magnetic susceptibility source separation toward iron and myelin mapping in the brain. NeuroImage 240, 118371 (2021).
2. Schofield, M. A. & Zhu, Y. Fast phase unwrapping algorithm for interferometric applications. Opt. Lett. 28, 1194 (2003).
3. Wu, B., Li, W., Guidon, A. & Liu, C. Whole brain susceptibility mapping using compressed sensing. Magn. Reson. Med. 67, 137–147 (2012).
4. Yoon, J. et al. Quantitative susceptibility mapping using deep neural network: QSMnet. NeuroImage 179, 199–206 (2018).
5. Pei, M. et al. Algorithm for fast monoexponential fitting based on Auto‐Regression on Linear Operations (ARLO) of data. Magn. Reson. Med. 73, 843–850 (2015).
6. Kim, M. et al. Chi-sepnet: Susceptibility source separation using deep neural network. in Proceedings of the 30th Annual ISMRM Meeting (2022).
7. He, C. et al. Quantitative susceptibility atlas construction in Montreal Neurological Institute space: towards histological-consistent iron-rich deep brain nucleus subregion identification. Brain Struct. Funct. 228, 1045–1067 (2023).
8. Spincemaille, P. et al. Quantitative Susceptibility Mapping: MRI at 7T versus 3T. J. Neuroimaging 30, 65–75 (2020).
Figures
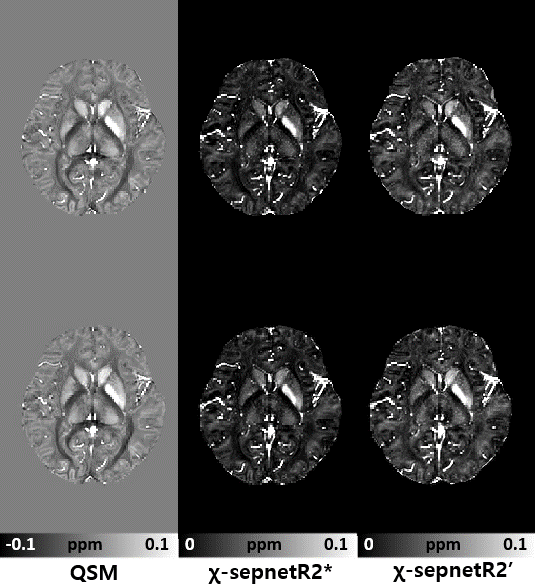
Figure 1.
Comparison of scan-rescan images QSM and χ-separation positive susceptibility map results of two models. For comparison, rescan images below were registered to first scan images on top.
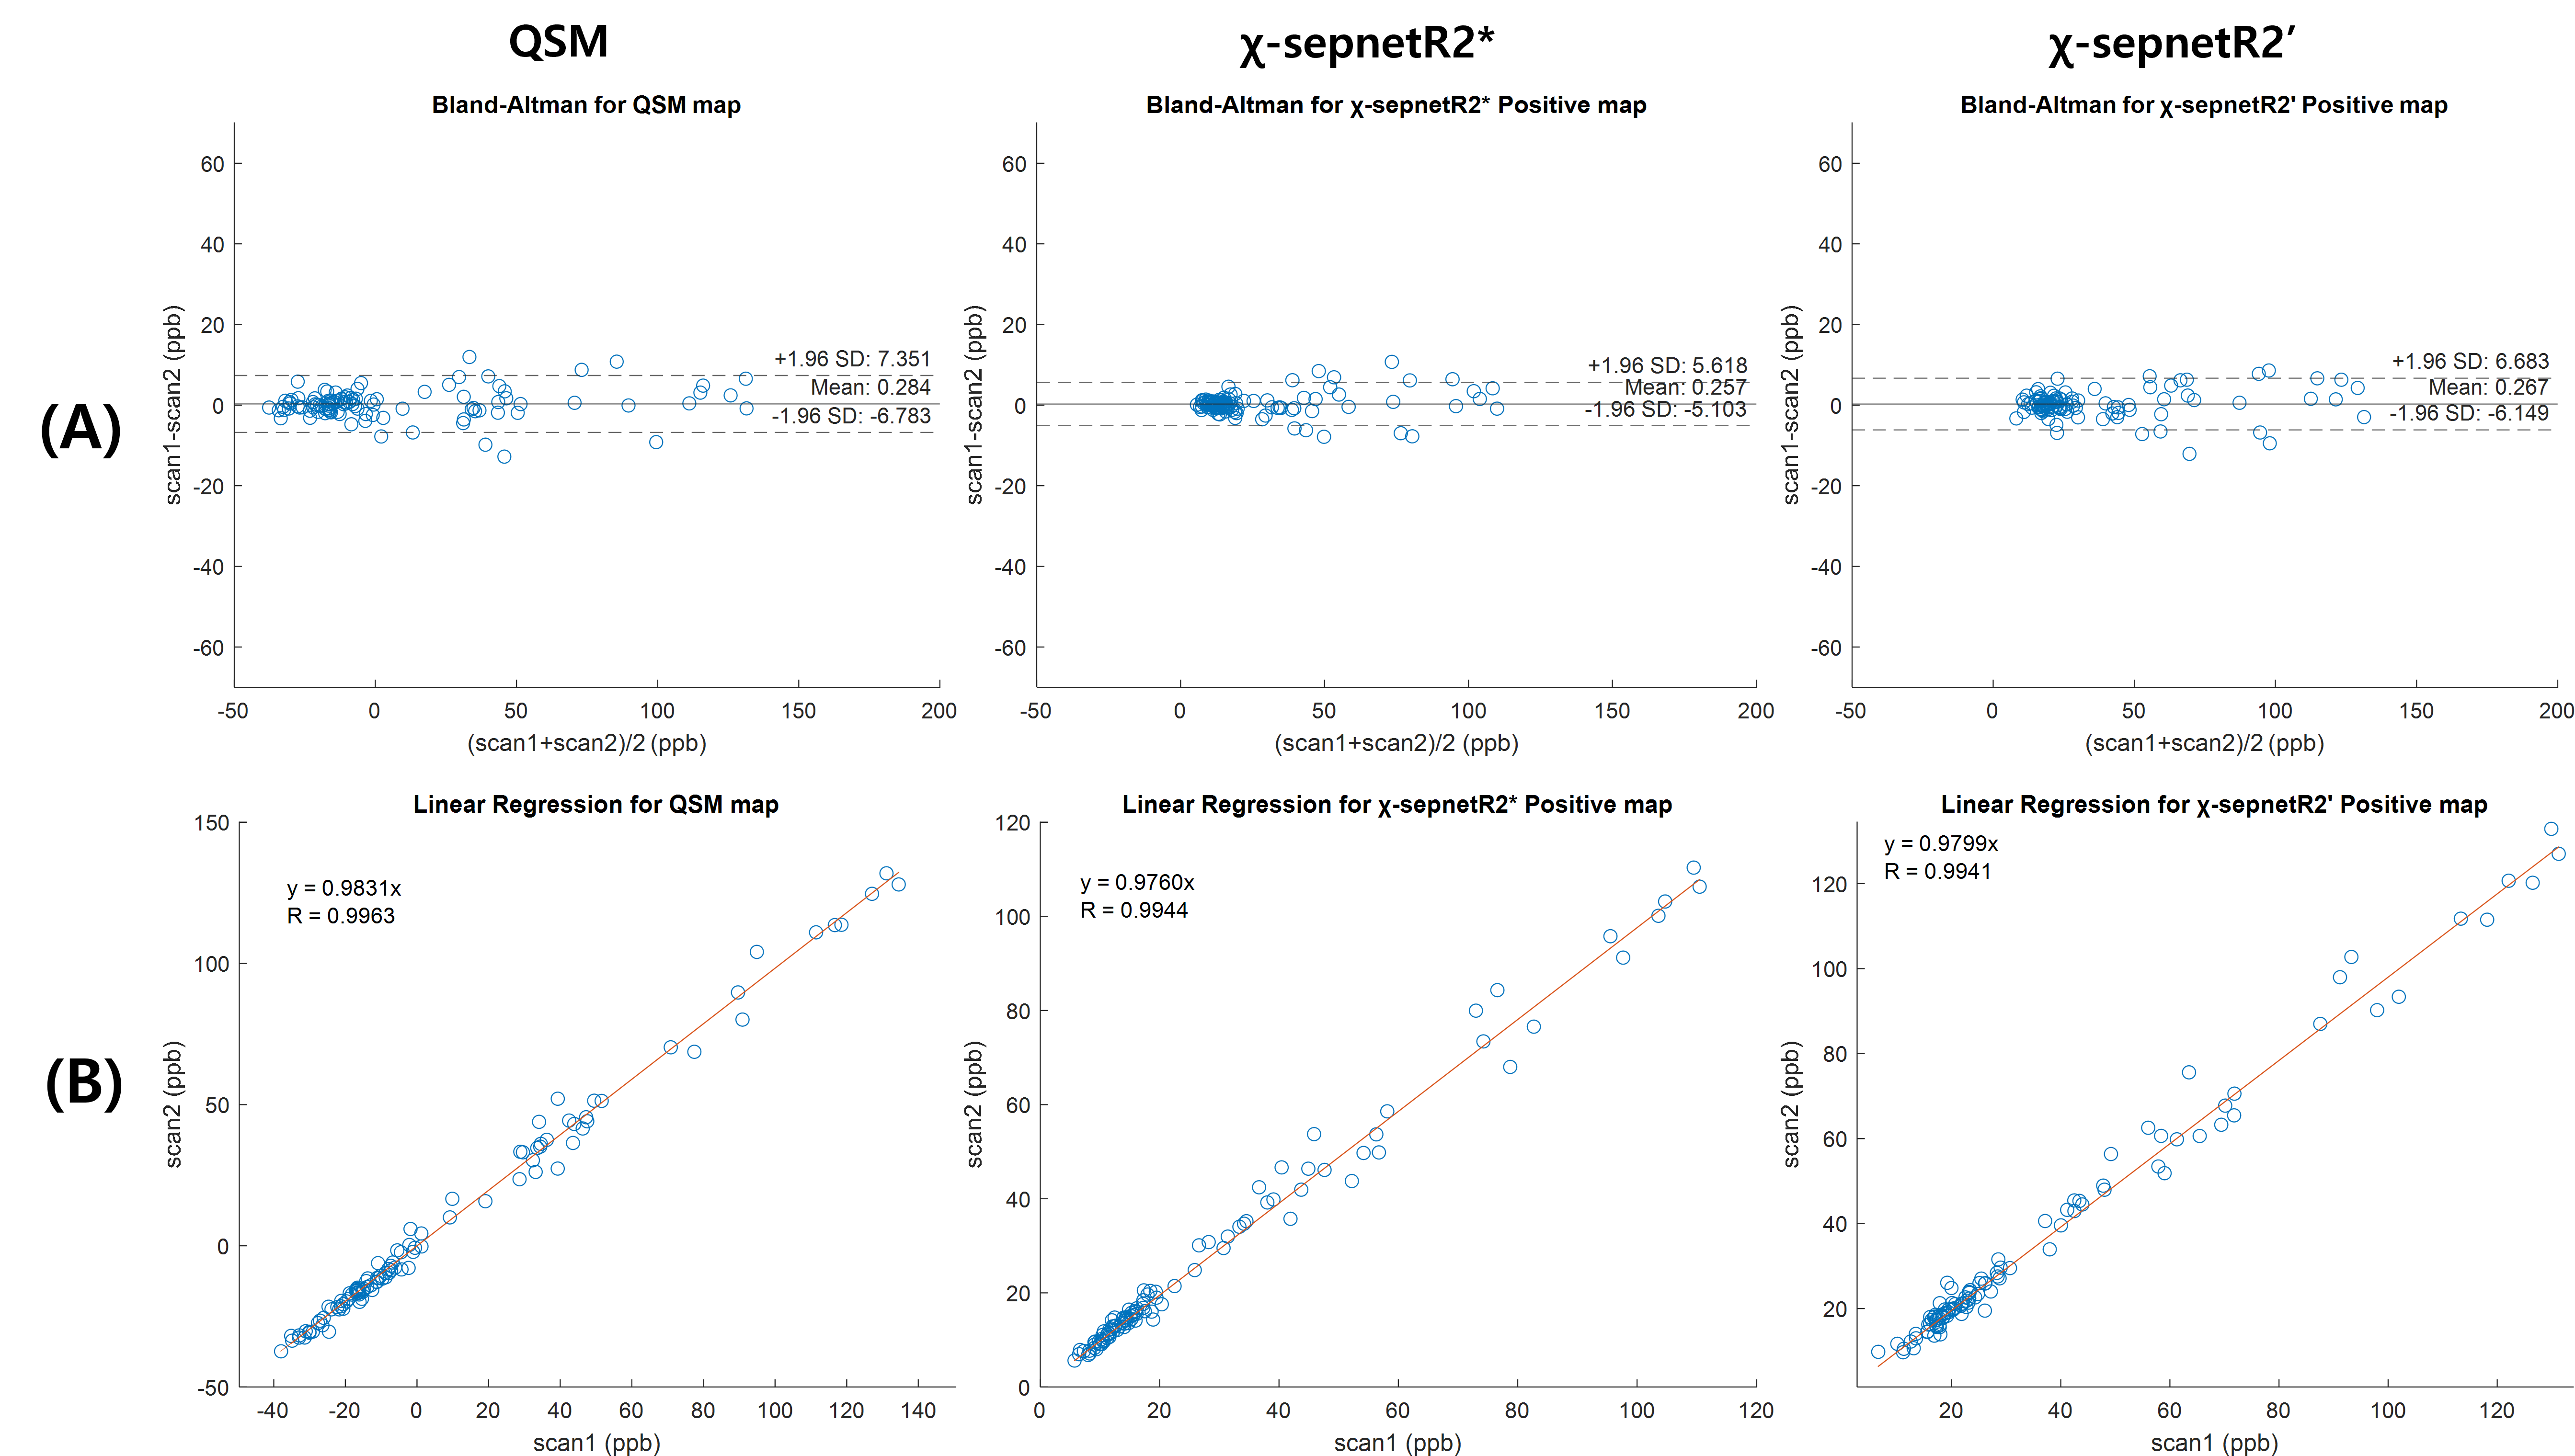
Figure 2.
Reproducibility analysis results for QSM and χ-separation positive susceptibility maps. Each data point represents 21 ROIs from 5 subjects. (A) Bland-Altman analysis with mean of difference and limits of agreement (LoA) for QSM and positive susceptibility maps of two χ-separation models. (B) Regression analysis with slope and R2 value for QSM and positive susceptibility maps of two χ-separation models.
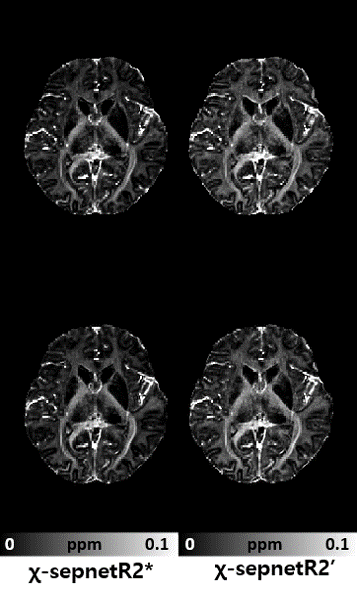
Figure 3.
Comparison of scan-rescan images χ-separation negative susceptibility map results of two models. For comparison, rescan images below were registered to first scan images on top.
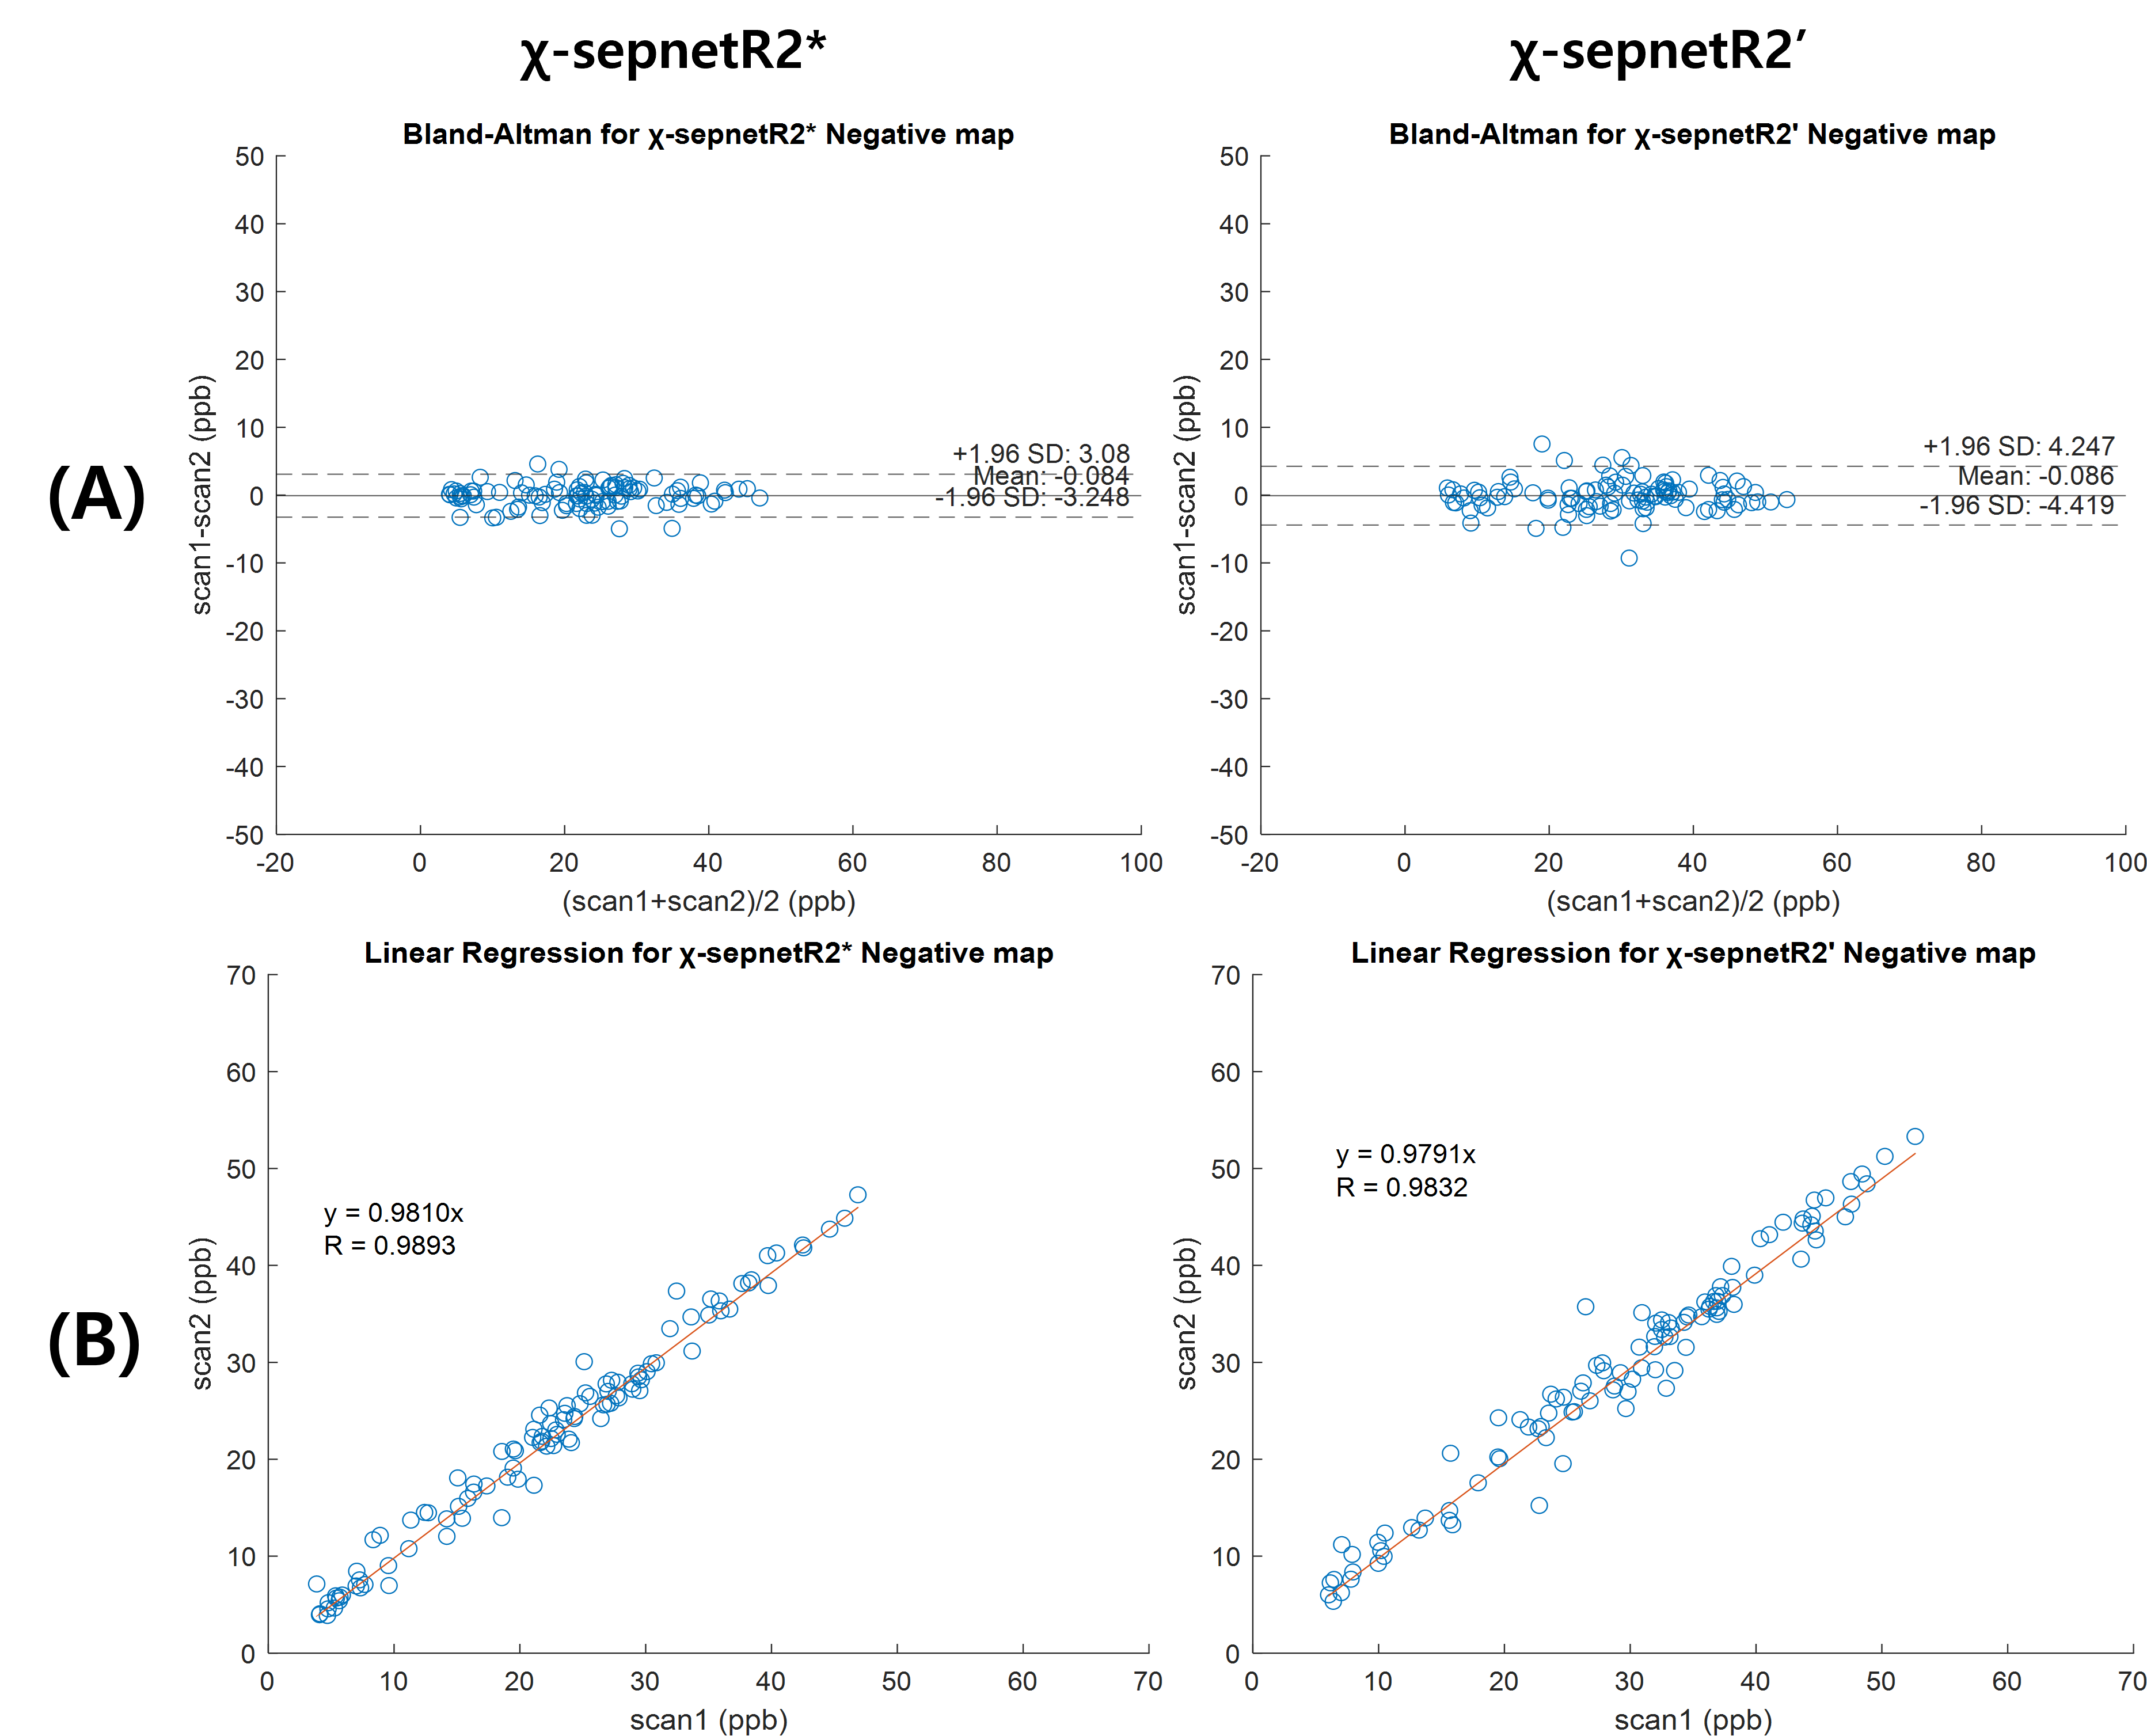
Figure 4.
Reproducibility analysis results for negative susceptibility maps. Each data point represents 21 ROIs from 5 subjects. (A) Bland-Altman analysis with mean of difference and limits of agreement (LoA) for negative susceptibility maps of two χ-separation models. (B) Regression analysis with slope and R2 value for negative susceptibility maps of two χ-separation models.