2607
Complex-valued deep learning based denoising of gradient echo images in high-resolution quantitative susceptibility mapping1Diagnostic and Interventional Radiology, School of Medicine, Klinikum rechts der Isar, Technical University of Munich, Munich, Germany, 2Philips GmbH Market DACH, Hamburg, Germany, 3Artificial Intelligence in Healthcare and Medicine, Technical University of Munich, Munich, Germany, 4School of Computation, Information and Technology, Technical University of Munich, Munich, Germany, 5Department of Computing, Imperial College London, London, United Kingdom, 6Center for Interventional Oncology, Radiology and Imaging Sciences, Clinical Center, National Institutes of Health, Bethesda, MD, United States, 7Philips Research, Hamburg, Germany
Synopsis
Keywords: Susceptibility/QSM, Quantitative Susceptibility mapping, Breast
Motivation: Quantitative susceptibility mapping (QSM) has recently been used to detect breast microcalcifications (MCs) which could be the precursor lesions to breast-carcinoma. However, acquiring high-resolution (HR) QSM maps reduces the signal-to-noise ratio (SNR), making detection of MCs challenging.
Goal(s): Improve the SNR in HR-QSM for better MCs visualization using deep-learning-based denoising.
Approach: A complex-valued bias-free CNN (CV-BFCNN), adapted from real-valued BFCNN, was trained on complex-valued MR data with Gaussian noise to denoise multi-echo gradient-echo images used for QSM processing.
Results: CV-BFCNN improves SNR in HR-QSM and processes complex-valued MR data directly when compared to real-valued BFCNN, and allows enhanced visualisation and detection of MCs.
Impact: The application of complex-valued deep-learning-based denoising in high-resolution QSM has substantially improved SNR and detection of micro-calcifications, a precursor to breast cancer. This helps QSM, an ionizing radiation-free alternative in detection and visualization of microcalcifications in the breast.
Introduction
Micro-calcifications (MCs) in the breast, which can be a precursor to breast cancer, are typically detected using X-ray mammography1,2. Quantitative susceptibility mapping (QSM) has been recently applied to visualize MCs in the breast using the effective multipeak in-phase echo times3,4. The challenge of breast QSM lies in the need to acquire high-resolution (HR) susceptibility maps (χmap) to visualize MCs, as HR imaging substantially reduces the apparent signal-to-noise ratio (SNR). The real and imaginary components of complex multi-echo images contains Gaussian noise which is uncorrelated between them. Deep learning-based denoising could be an approach to improve the apparent SNR in these images. Unlike real-valued networks which work on the real and imaginary components of the complex-valued images separately5, complex-valued networks can process the complex-valued MR data directly and leverage the phase relationship that exists between the real and imaginary components. This work proposes the use of complex-valued bias-free denoising convolutional neural network (CV-BFCNN) to denoise the complex multi-echo gradient-echo images for HR QSM-processing. Based on simulations and in vivo patient scans, the improved visualization of MCs in the χmap using denoising is demonstrated.Methods
Training of CV-BFCNN:The CV-BFCNN, adapted from the real-valued BFCNN5,6, incorporates complex-valued convolutions and cardioid activation. Fig.1 (a) shows the architecture of CV-BFCNN (UNet) trained on high-SNR complex-GRE images (spine, knee, tibia, phantom, and simulated data) comprising a train-dataset of 3454 2D-images for 500 epochs with Gaussian noise added artificially. Images were resized to 144x144. The learning rate began at 0.0001 and was reduced by 0.1 at epochs 200, 300, 400, with optimization using the Adam optimizer. Mean-squared error (MSE) loss was used, assessing both real and imaginary parts for weight updates.
In vivo measurement:
A HR effective multi-peak in-phase GRE sequence4 was performed on a 3T scanner (Ingenia, Philips Healthcare) in one patient without clinical findings and one after biopsy. The imaging parameters were TE = [3.07,7.48] ms, FA = 12o, readout-direction=anterior-posterior, FOV = 384x384x192 mm3 , TR = 10.85 ms, compressed sense acceleration R=6 and an isotropic voxel-size of 0.6 mm. The images were reconstructed online using the vendor’s compressed SENSE.
Pipeline:
Fig.1 (b) shows the pipeline of QSM-processing. CV-BFCNN was applied directly on complex-MR data unlike BFCNN5 and processed further for QSM. A hierarchical multi-resolution graph-cut was used to obtain a field map7. A nonlinear preconditioned total field inversion algorithm was used to invert the field map to χmap8.
Simulation:
A numerical-phantom comprising water and a large-spherical-calcification was forward-simulated from a χmap (χwater,χcalcification = 0, -1 ppm) to reference multi-echo images. Gaussian noise was added to the reference images and QSM-processing was done for noisy, BFCNN and CV-BFCNN denoised images.
MCs with negative χ (< -2 ppm) of isotropic voxel size each (0.6 mm) were simulated in a reference scan based on in vivo scan. Gaussian noise was added to the reference scan and QSM-processing was done as before.
Results
Fig.2 displays (a) denoising results of numerical-phantom simulations. (b) χ-line profile of BFCNN denoised shows underestimation of the calcification region, while CV-BFCNN closely matches the reference with sharp-edges at the calcification-water interface.Fig.3 shows the magnitude and estimated-parameters of the in vivo based-simulation of MCs. Noisy χmap (c) shows MCs like artefacts. BFCNN and CV-BFCNN denoised χmap reveal only the simulated MCs as pointed by arrows.
Fig.4 shows (axial-view) magnitude and estimated-parameters of original and CV-BFCNN denoised in vivo of the patient after biopsy. The removed noise can be seen in the difference maps (noisy-denoised), especially further away from the receiver coils (anterior-posterior).
Fig.5 shows sagitttal view of the χmap containing a blood clot formed after biopsy (MCs were removed ). CV-BFCNN substantially reduces the noise around the blood clot.
Discussion
CV-BFCNN substantially improved the apparent SNR by removing the noise in real-imaginary components of the complex-MR data. In vivo-based MCs-simulation showed the noisy χmap displaying MCs-like artefacts due to noise. Both real-valued BFCNN and CV-BFCNN denoised χmap allow to reliably detect only the simulated MCs. However, CV-BFCNN handles the complex data more intuitively than BFCNN and displayed enhanced visualization of MCs compared to BFCNN. In the in vivo patient scans, a substantial improvement in apparent SNR (anterior-posterior) was observed, particularly around the blood clot (using CV-BFCNN) demonstrating the proof of concept for this approach.Conclusion
For high resolution QSM, low SNR limits the visualization of MCs. CV-BFCNN can handle complex MR data more intuitively especially for phase-sensitive application like QSM. CV-BFCNN can substantially reduce Gaussian noise in the complex MR data. This improves the apparent SNR in high resolution QSM to allow for the better visualization for the MCs.Acknowledgements
The authors acknowledge research support from Philips Healthcare.References
[1] AF Logullo, KCK Prigenzi, CCBA Nimir, AFV Franco, and MSDA Campos. Breastmicrocalcifications: Past, present and future (review). Mol Clin Oncol, 16:81, 2022.
[2] E Fallenberg, L Dimitrijevic, F Diekmann, S Diekmann, U Kettritz, A Poellinger,U Bick, K Winzer, F Engelken, and D Renz. Impact of magnification views on the characterization of microcalcifications in digital mammography. RöFo - Fortschritteauf dem Gebiet der Röntgenstrahlen und der bildgebenden Verfahren, 186:274–280,2013, doi: 10.1055/s-0033-1350572.
[3] C Boehm, A Komenda, K Weiss, JK Stelter, T Borde, J Meineke, MR Makowski,EM Fallenberg, and DC Karampinos. High spatial resolution quantitative susceptibility mapping using in-phase echoes enables the depiction of breast microcalcifications. In Proceedings 31. Annual Meeting International Society for Magnetic Resonance inMedicine, page 0189, Toronto, Canada, 2023.
[4] C Boehm, S Schlaeger, J Meineke, K Weiss, MR Makowski, and DC Karampinos. On the water-fat in-phase assumption for quantitative susceptibility mapping. MagneticResonance in Medicine, 2022, doi: 10.1002/mrm.29516.
[5] S Ravichandran, C Boehm, K Weiss, A Ziller, GA Kaissis, D Rueckert, T Borde,J Meineke, MR Makowski, EM Fallenberg, and D Karampinos. Improved visualization of breast micro calcifications in high spatial resolution quantitative susceptibility mapping using deep learning-based denoising. In Book of Abstracts ESMRMB 2023 Online 39th Annual Scientific Meeting 4–7 October 2023, volume 36, pageS268. Magnetic Resonance Materials in Physics, Biology and Medicine, 2023, doi:10.1007/s10334-023-01108-9, Abstract number: P222.
[6] S Mohan, Z Kadkhodaie, EP Simoncelli, and C Fernandez-Granda. Robust and interpretable blind image denoising via bias-free convolutional neural networks. arXiv preprint arXiv:1906.05478, 2019, doi: 10.48550/ARXIV.1906.05478.
[7] C Boehm, MN Diefenbach, MR Makowski, and DC Karampinos. Improved body quantitative susceptibility mapping by using a variable-layer single-min-cut graph-cut for field-mapping. Magn Reson Med, 85:1697–1712, 2021, doi: 10.1002/mrm.28515.4.
[8] C Boehm, N Sollmann, J Meineke, et al. Preconditioned water-fat total field inversion:application to spine quantitative susceptibility mapping. Magn Reson Med, 87:417–430, 2022, doi: 10.1002/mrm.28903.
Figures
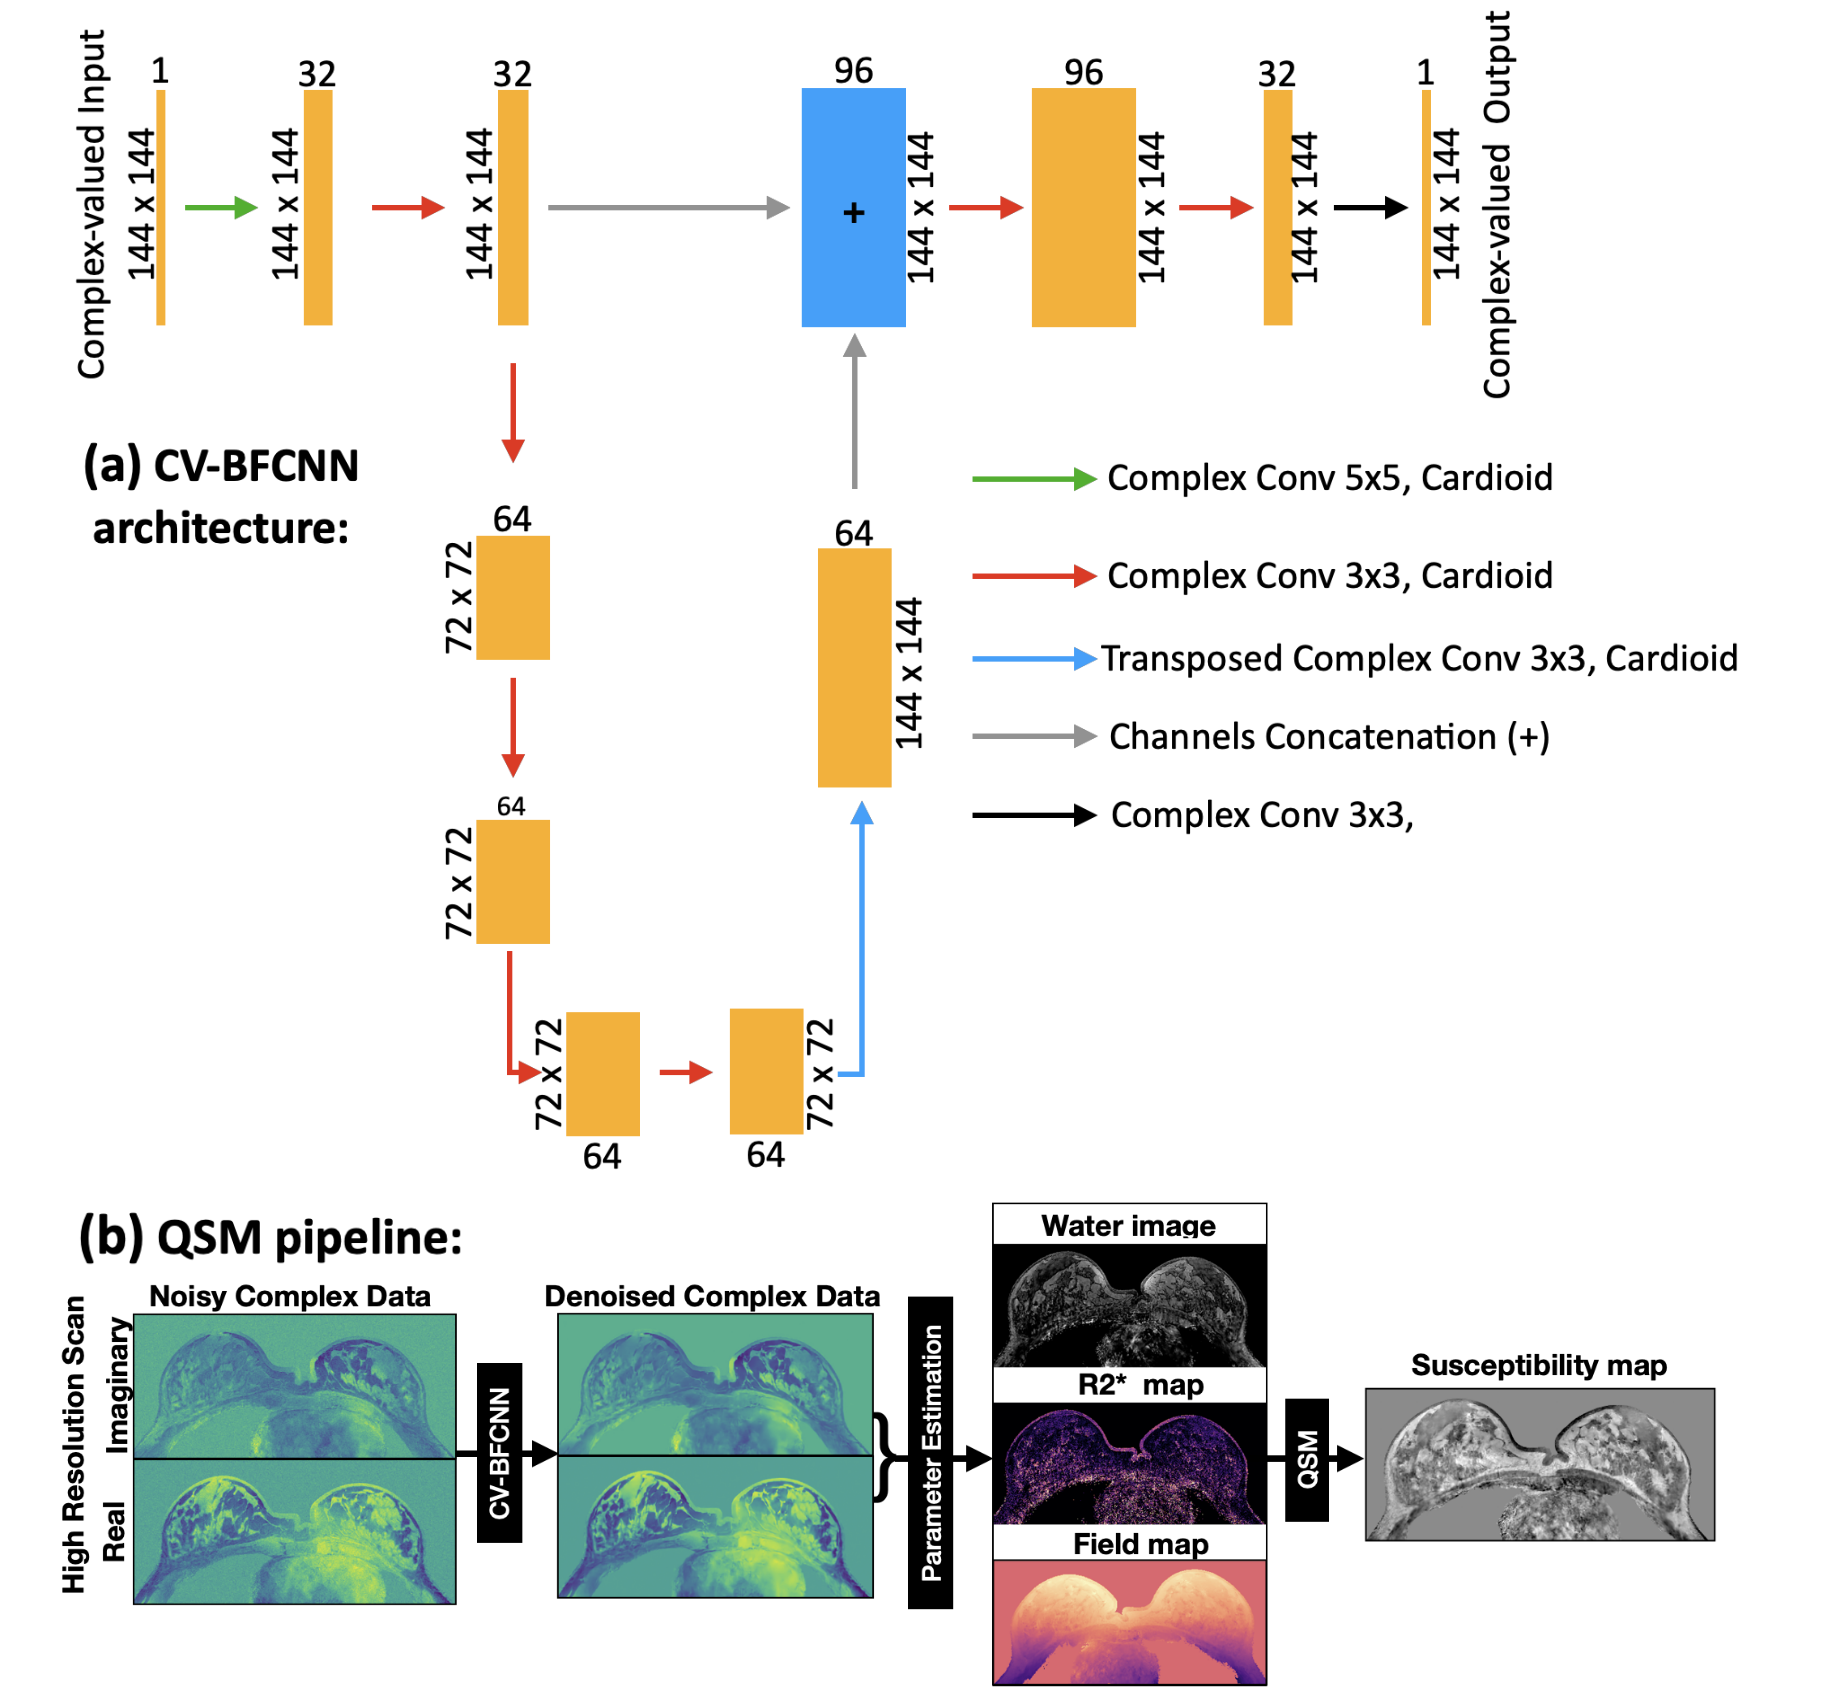
Figure 1: (a) CV-BFCNN architecture: Orange/blue boxes show input/output sizes to/from convolution layers. Box width = channel count, height = spatial dimensions. Arrows signify convolutions, cardioid activation, channel concatenation, with colors for distinct operations.
(b) QSM pipeline: CV-BFCNN was applied to denoise the complex MR image. Denoised complex MR image was used to obtain a field map using a hierarchical multi resolution graph cut method7. The field map was inverted into a susceptibility map using a nonlinear preconditioned total field inversion algorithm8.
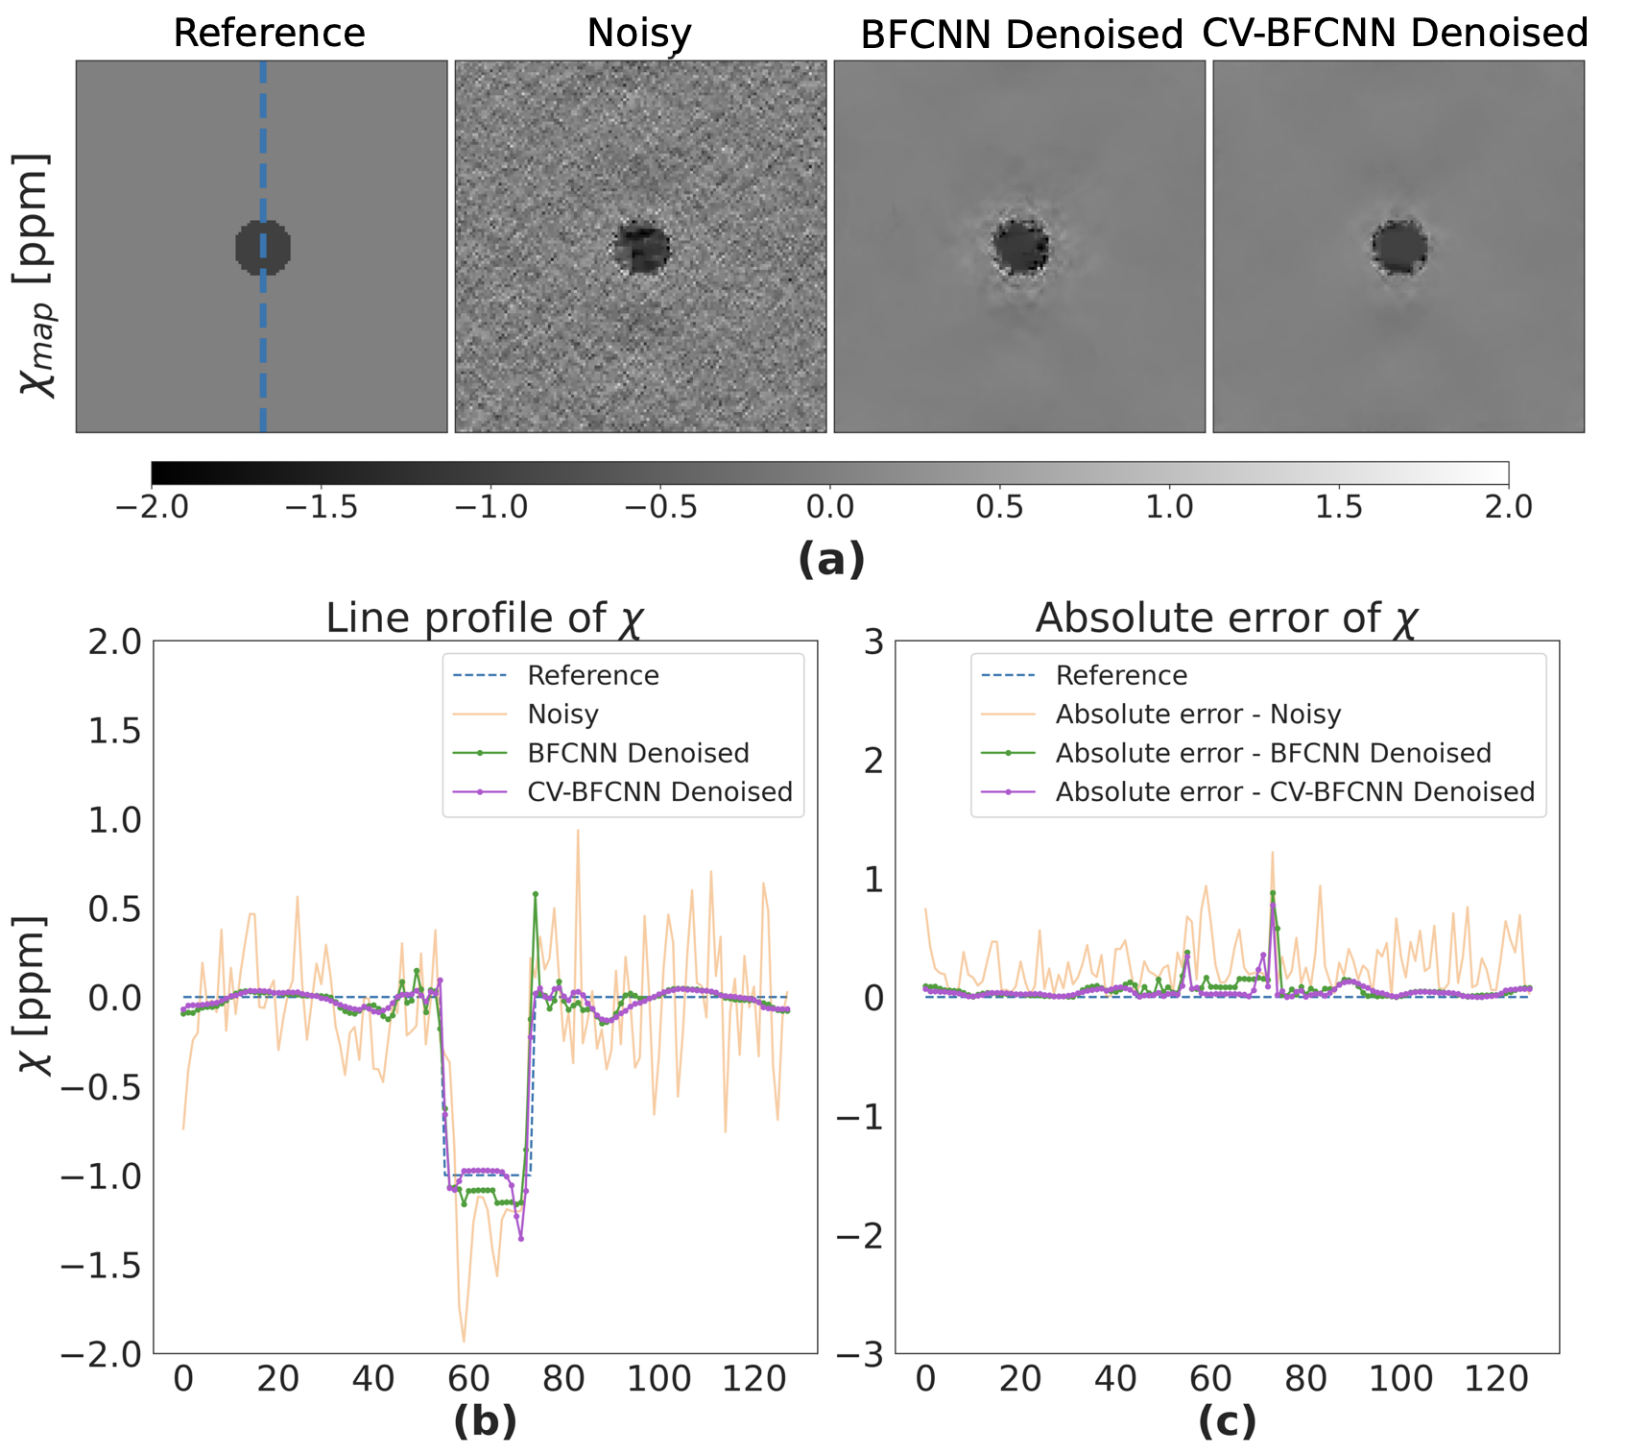
Figure 2: (a) Reference, Noisy, BFCNN, CV-BFCNN denoised χmap from numerical phantom forward simulation are shown. CV-BFCNN denoised χmap shows improved χ estimation post denoising.
(b) Both BFCNN and CV-BFCNN denoised χ line profiles align closely with the reference, but BFCNN shows sharp edges at the interface and underestimates in the calcification region. CV-BFCNN aligns nearly perfectly with the reference, with sharp edge at the calcification-water interface.
(c) displays the absolute error of Noisy, BFCNN denoised, CV-BFCNN denoised χ line profiles (w.r.t reference).
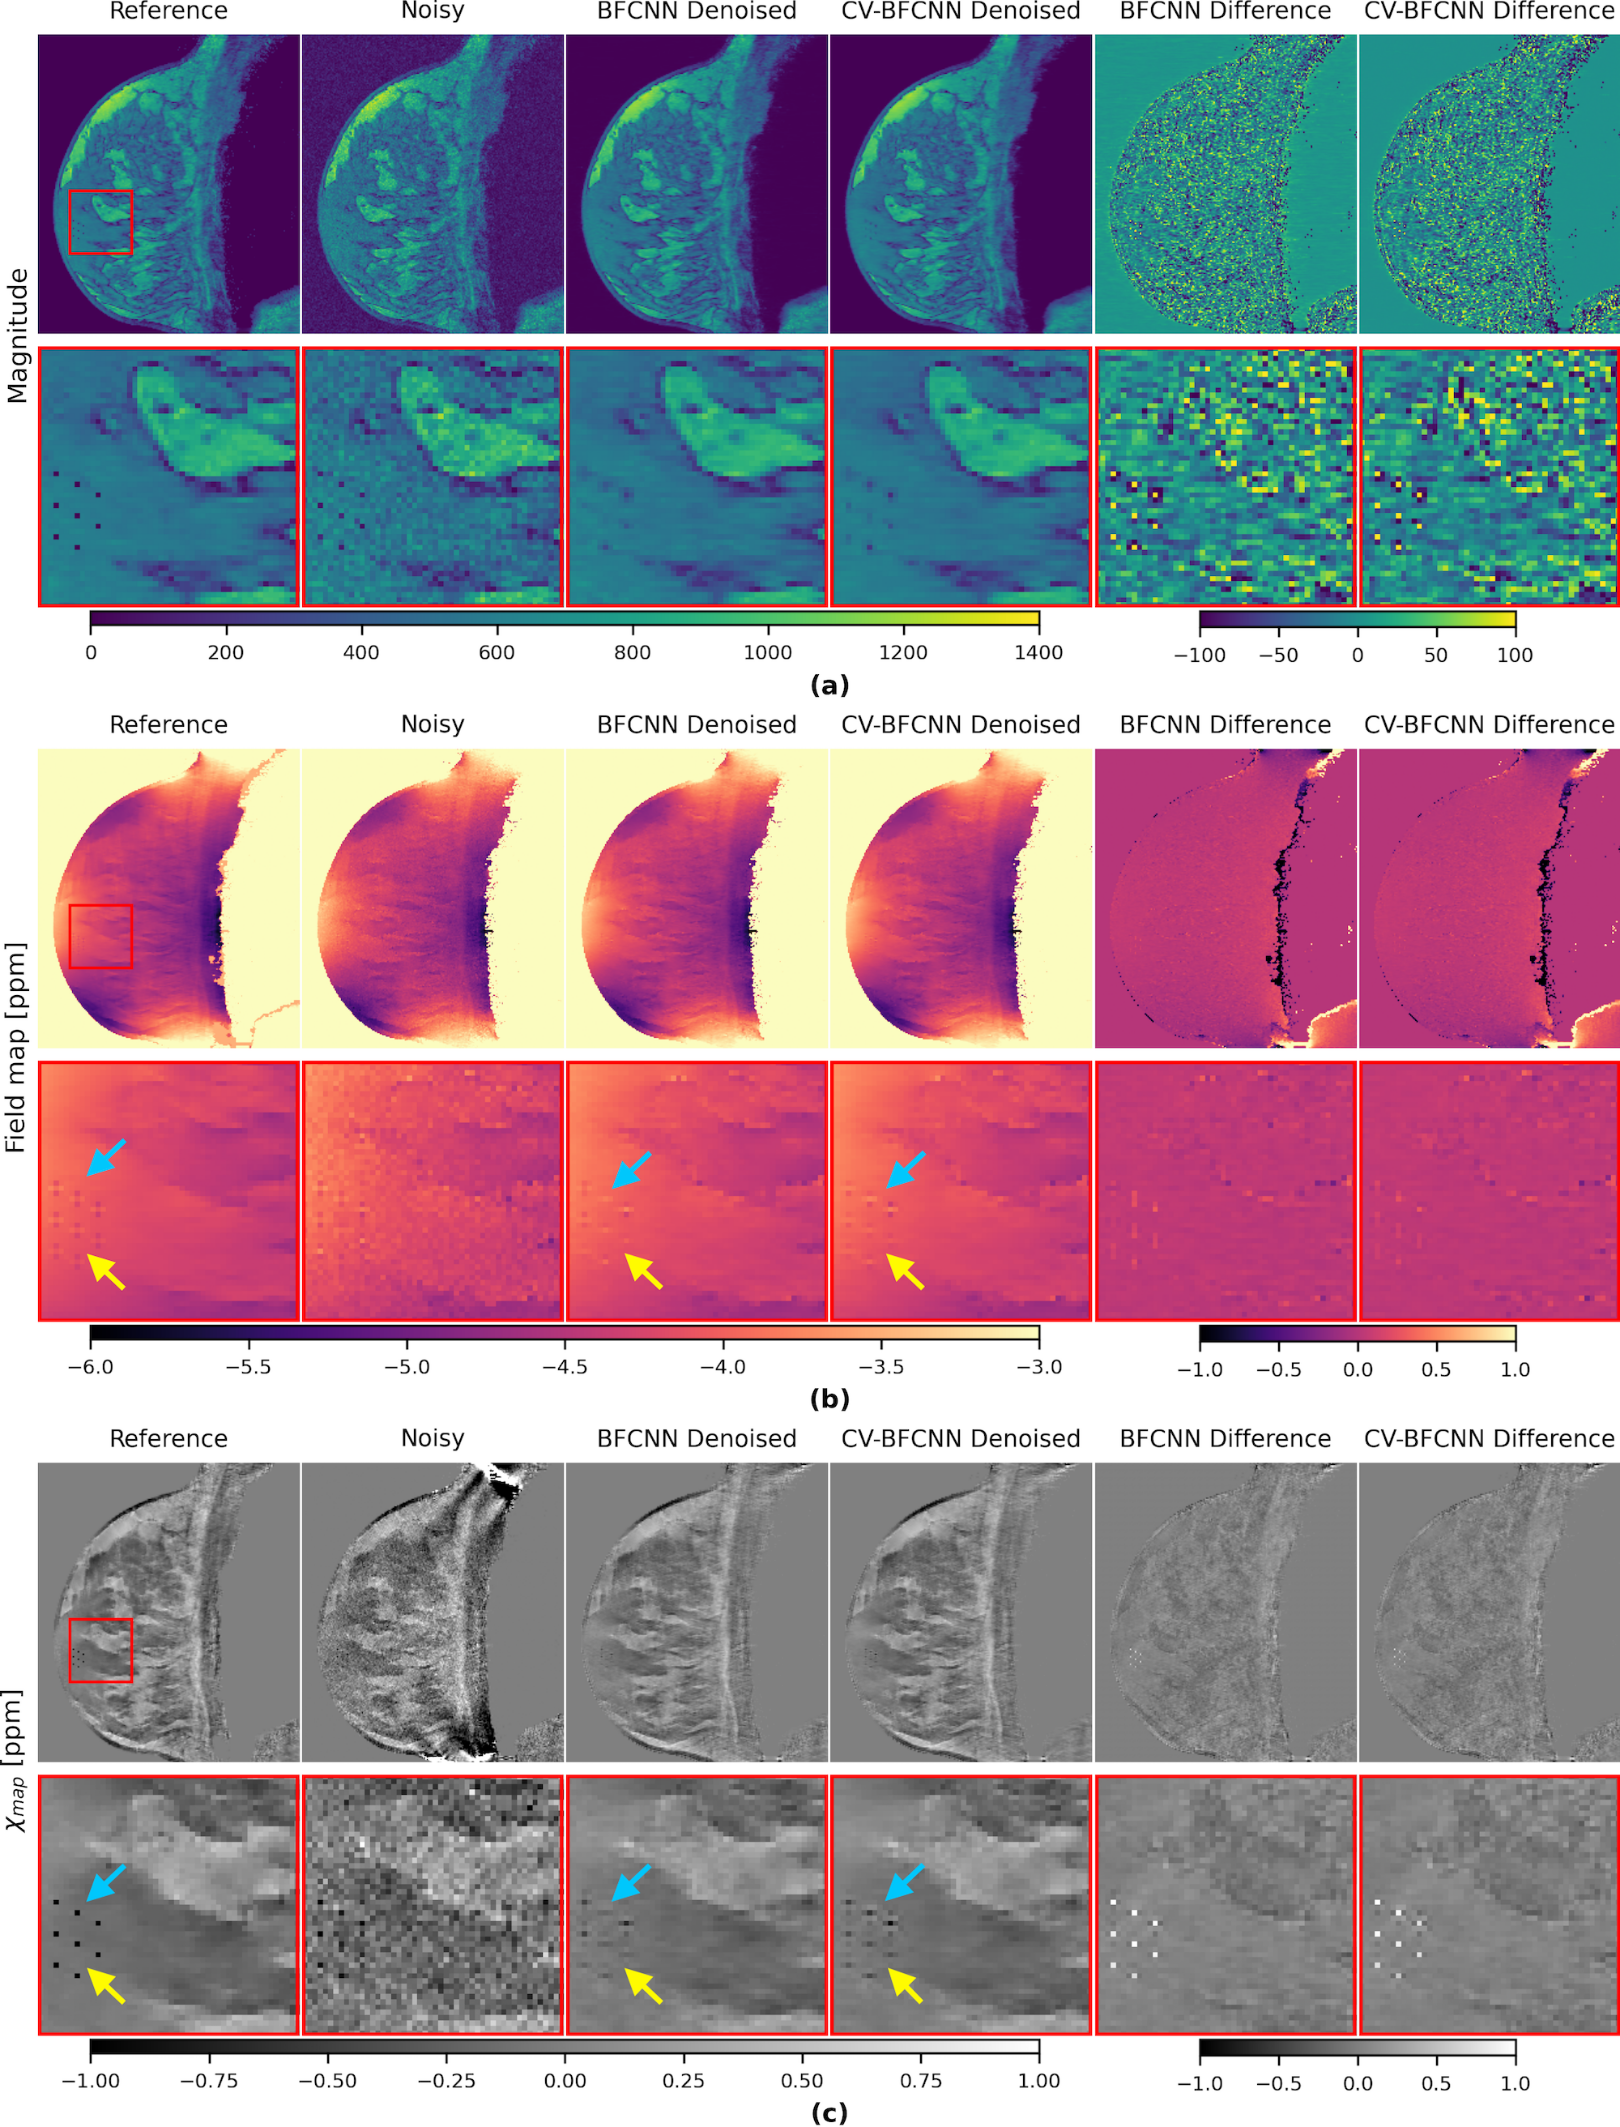
Figure 3: Simulation of MCs on in vivo breast anatomy (without clinical findings) in presence of noise: (a) Enhanced visibility of MCs in magnitude image using CV-BFCNN compared to BFCNN.
(b) Improved field map estimations are seen in CV-BFCNN denoised as highlighted by the arrows.
(c) In the Noisy χmap , it is quite hard to distinguish between noise (MCs like artefacts) and simulated MCs. BFCNN and CV-BFCNN enhance the apparent SNR in the denoised χmap. But CV-BFCNN demonstrates improved visibility of MCs in denoised χmap compared to BFCNN.
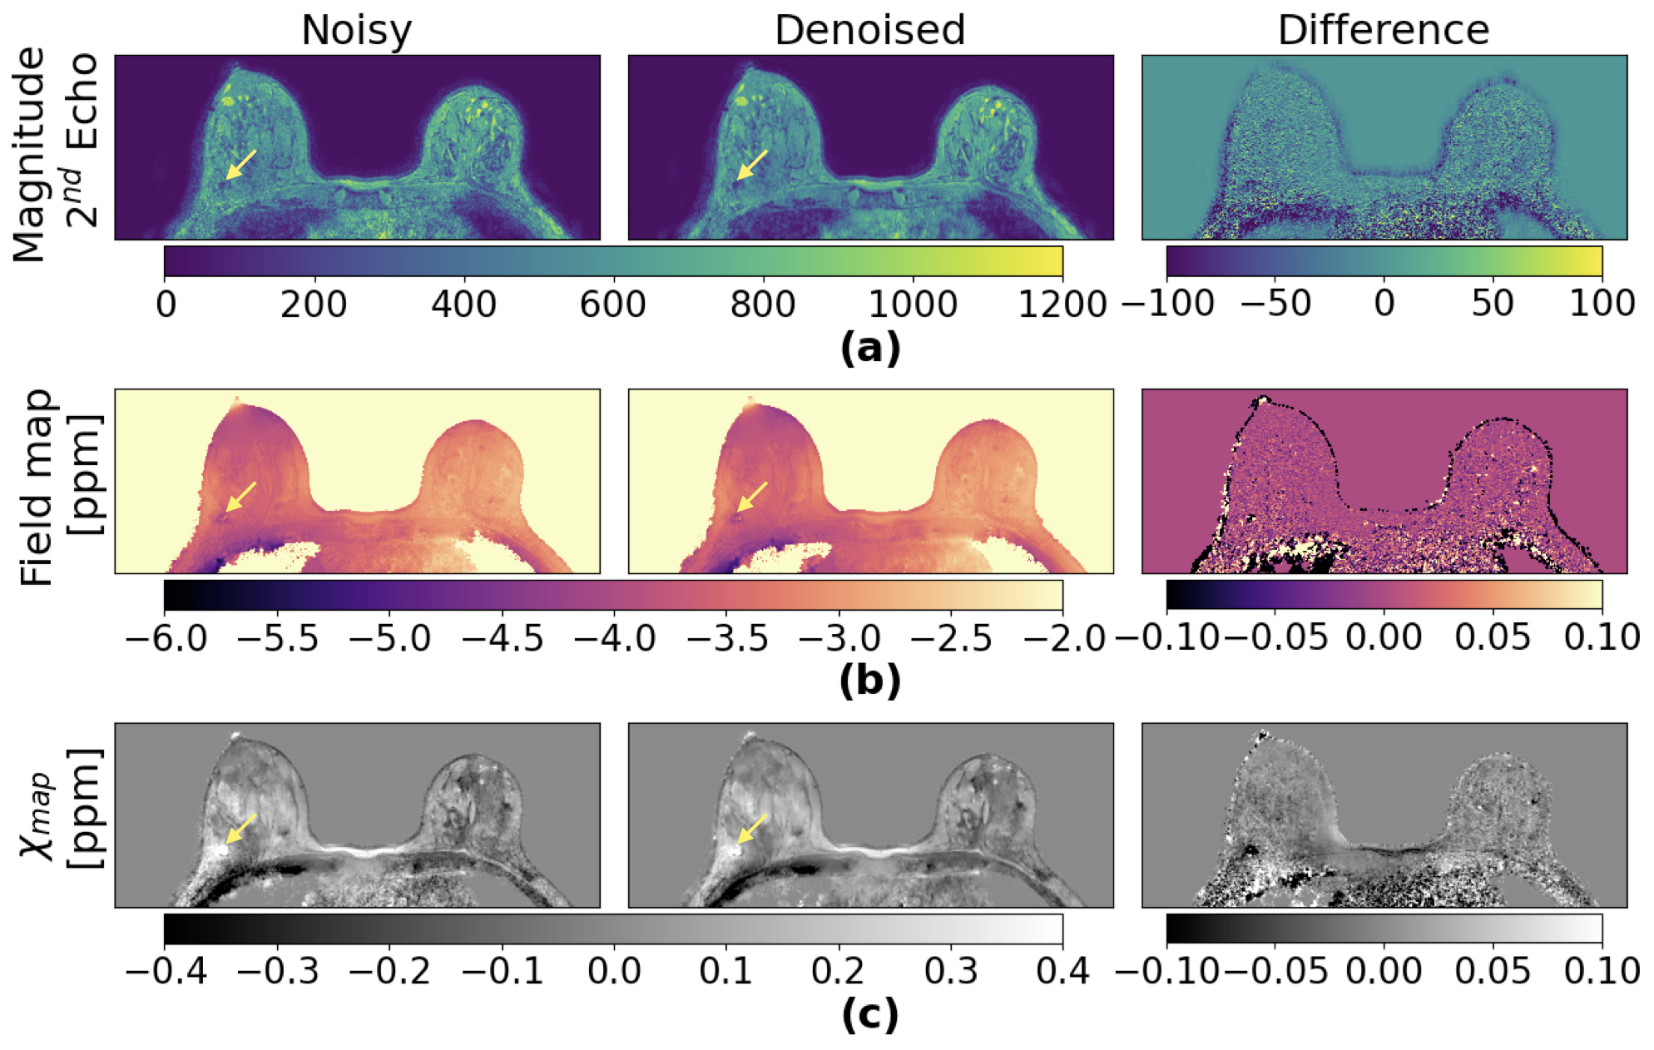
Figure 4: Axial view of the patient's breast scan after biopsy: First column shows the original (Noisy) (a) magnitude, (b) field map and (c) χmap of the in vivo patient scan. Second column shows CV-BFCNN denoised versions. The apparent SNR is improved in the denoised data, especially in the anterior-posterior direction. The difference map (last column) highlights that substantial amount of noise is eliminated closer to the chest wall (moving from the breast’s surface RF coil array to the chest wall). The yellow arrow shows the blood clot (appears bright in χmap) formed after biopsy.
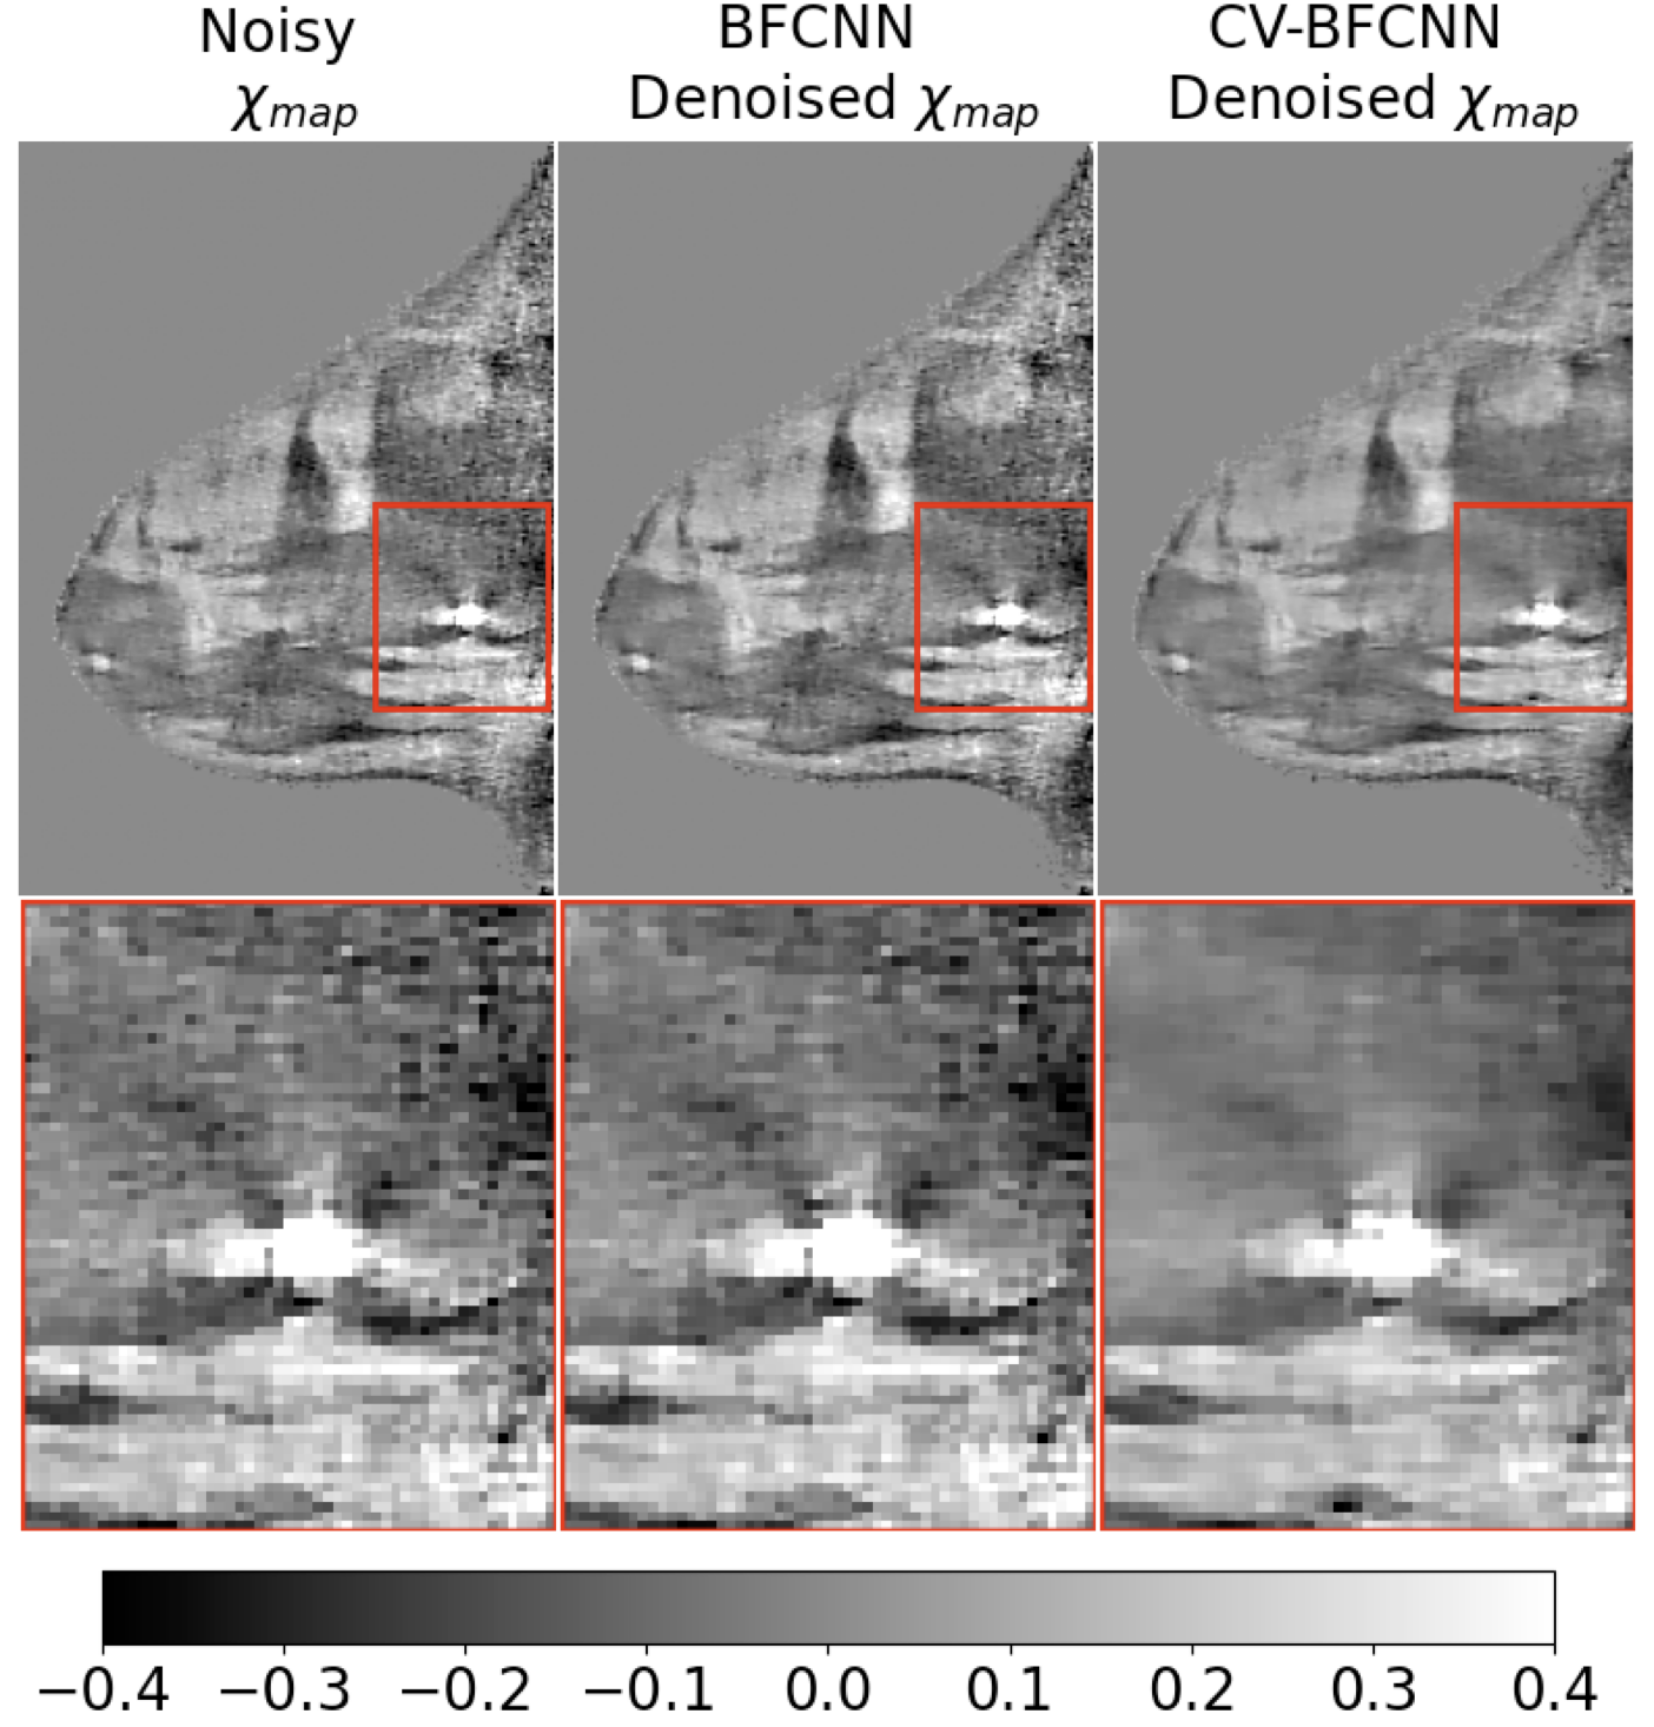
Figure 5: Sagittal view of the patient's breast scan (QSM) after biopsy: The biopsy region is highlighted by a red box. The bright spot in χmap indicates the blood clot formed after biopsy (blood has positive susceptibility). The Noisy χmap shows MCs like artefacts around the blood clot because of the noise. BFCNN slightly reduces the noise around the blood clot. But CV-BFCNN substantially reduces the noise around the blood clot.