2604
Demonstration of TE-dependence of tissue microstructure estimation1Nanjing University of Science and Technology, Nanjing, China, 2Union Hospital, Tongji Medical College, Huazhong University of Science and Technology, Wuhan, China, 3Hubei Province Key Laboratory of Molecular Imaging, Wuhan, China, 4Philips Healthcare, Wuhan, China
Synopsis
Keywords: Microstructure, Microstructure
Motivation: The microstructure properties obtained through advanced dMRI technology can be affected by MRI scanning parameter echo time’s changes.
Goal(s): This study aims to investigate the impact of increasing TE on microstructure properties derived from different dMRI techniques across various tissues and health conditions.
Approach: NODDI, FreeWater DTI, and IVIM were used to evaluate the TE dependence of tissue microstructure parameters from ten subjects with different health conditions.
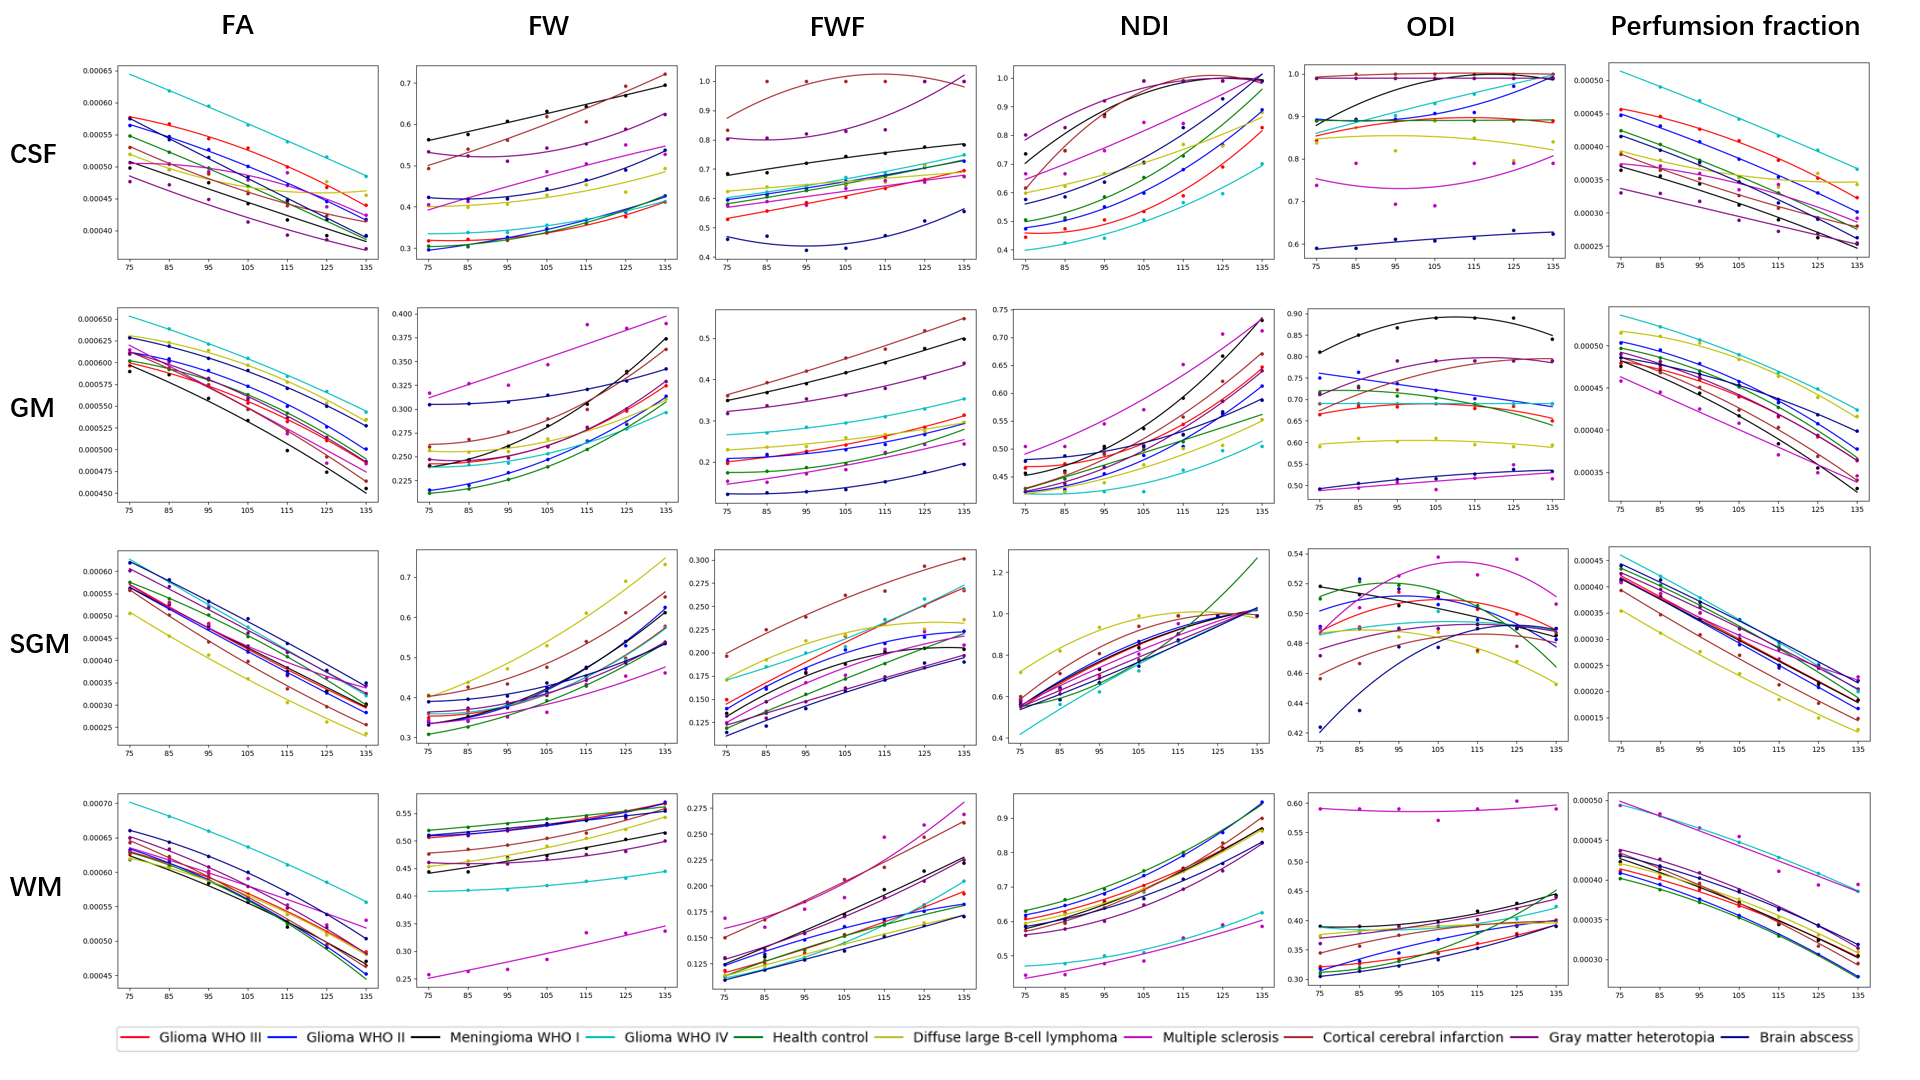
Results: As TE increases in different brain tissues (GM, SGM, WM, and CSF), FW, FWF, and NDI increase, while FA and perfusion fraction decrease. ODI remains relatively consistent in most brain regions for various health conditions.
Impact: This research examines the influence of different echo times on microstructural properties derived from advanced dMRI techniques in various brain regions and health states. The findings could aid in the interpretation of TE-dependence microstructural estimation.
Introduction
Diffusion magnetic resonance imaging (dMRI) is a powerful non-invasive tool that helps assess tissue microstructure1. Advanced diffusion techniques like Neurite orientation dispersion and density imaging (NODDI)2, Intra-voxel incoherent motion (IVIM)3, and Free water diffusion tensor imaging (FWDTI)4 provide unique insights into properties such as neurite density index (NDI), fractional anisotropy (FA), and orientation dispersion index (ODI). These properties can help us understand brain development, maturation, and disorders5–8. However, changing the acquisition protocol can affect the measurements derived from these dMRI techniques. For example, increasing the echo time (TE) can impact the conventional NODDI-derived microstructure parameters9. The effect of increasing TE on other measurements is yet to be established.Methods
Dataset: A high-quality rdMRI dataset from a cohort of 8 neurosurgical patients with different types (lesions, including glioma, meningioma, diffuse large B-cell, multiple sclerosis, cortical cerebral infarction, and brain abscess) was acquired using a Philips 3T MRI scanner. The rdMRI data is scanned using a multi-shell, multi-echo dMRI sequence with fixed diffusion time, [4, 4, 8, 8, 16] diffusion-encoding directions at each of b=[0, 400, 800, 1600, 3200] s/mm2 respectively, TE=[75, 85, 95, 105, 115, 125, 135] ms, TR=4000 ms, 1.5 mm isotropic voxel size. Each rdMRI scan is well-processed for artifact and distortion corrections using a well-designed rdMRI-specific processing pipeline. Besides, anatomical data was also acquired, which was used for the labeling of gray matter (GM), subcortical gray matter (SGM), white matter (WM) and cerebrospinal fluid (CSF) using FSL.Diffusion MRI technique: Three dMRI techniques, NODDI, FWDTI and IVIM, are used for the microstructure estimation of all subjects. We fit the NODDI model using AMICO10, and FWDTI and IVIM model using DIPY and DMIPY, respectively.
Microstructure measurements: We investigate the TE-dependence of microstructure parameters, including FWDTI-derived fractional anisotropy (FA), free water (FW), NODDI-derived free water fraction (FWF), neurite density index (NDI), orientation dispersion index (ODI), IVIM-derived perfusion fraction to quantify the microstructural properties of different tissues from all subjects.
Data Analysis: For the different microstructural measurements, brain tissues and TEs, we calculated the median of all corresponding voxels. For each measure, we used a quadratic polynomial to fit curves using the corresponding values of GM, SGM, WM, and CSF with increasing TE.
Results
We found that as TE increased from 75ms to 135ms, the values of GM, SGM, WM, and CSF for all subjects in FA and perfusion fraction decreased by 20% to 50%, as Figure 1 shows. This decrease varied depending on the health status of the subjects. For example, subjects with Diffuse large B-cell lymphoma experienced a slower decline of approximately 10% in FA and perfusion fraction on CSF. Additionally, the degree of decrease in the four brain tissues varied for the same microstructural measures and subjects, with perfusion fraction values showing a much more significant decrease in SGM, up to 60%.FW, FWF, NDI, and ODI increased in brain tissues by about 10% to 70% as TE increased. For instance, the FWF of subjects with Meningioma WHO I increased only about 10% in CSF as TE increased, as Figure 1 shows. On the other hand, the FW of subjects with Diffuse large B-cell lymphoma increased up to 85% in SGM.
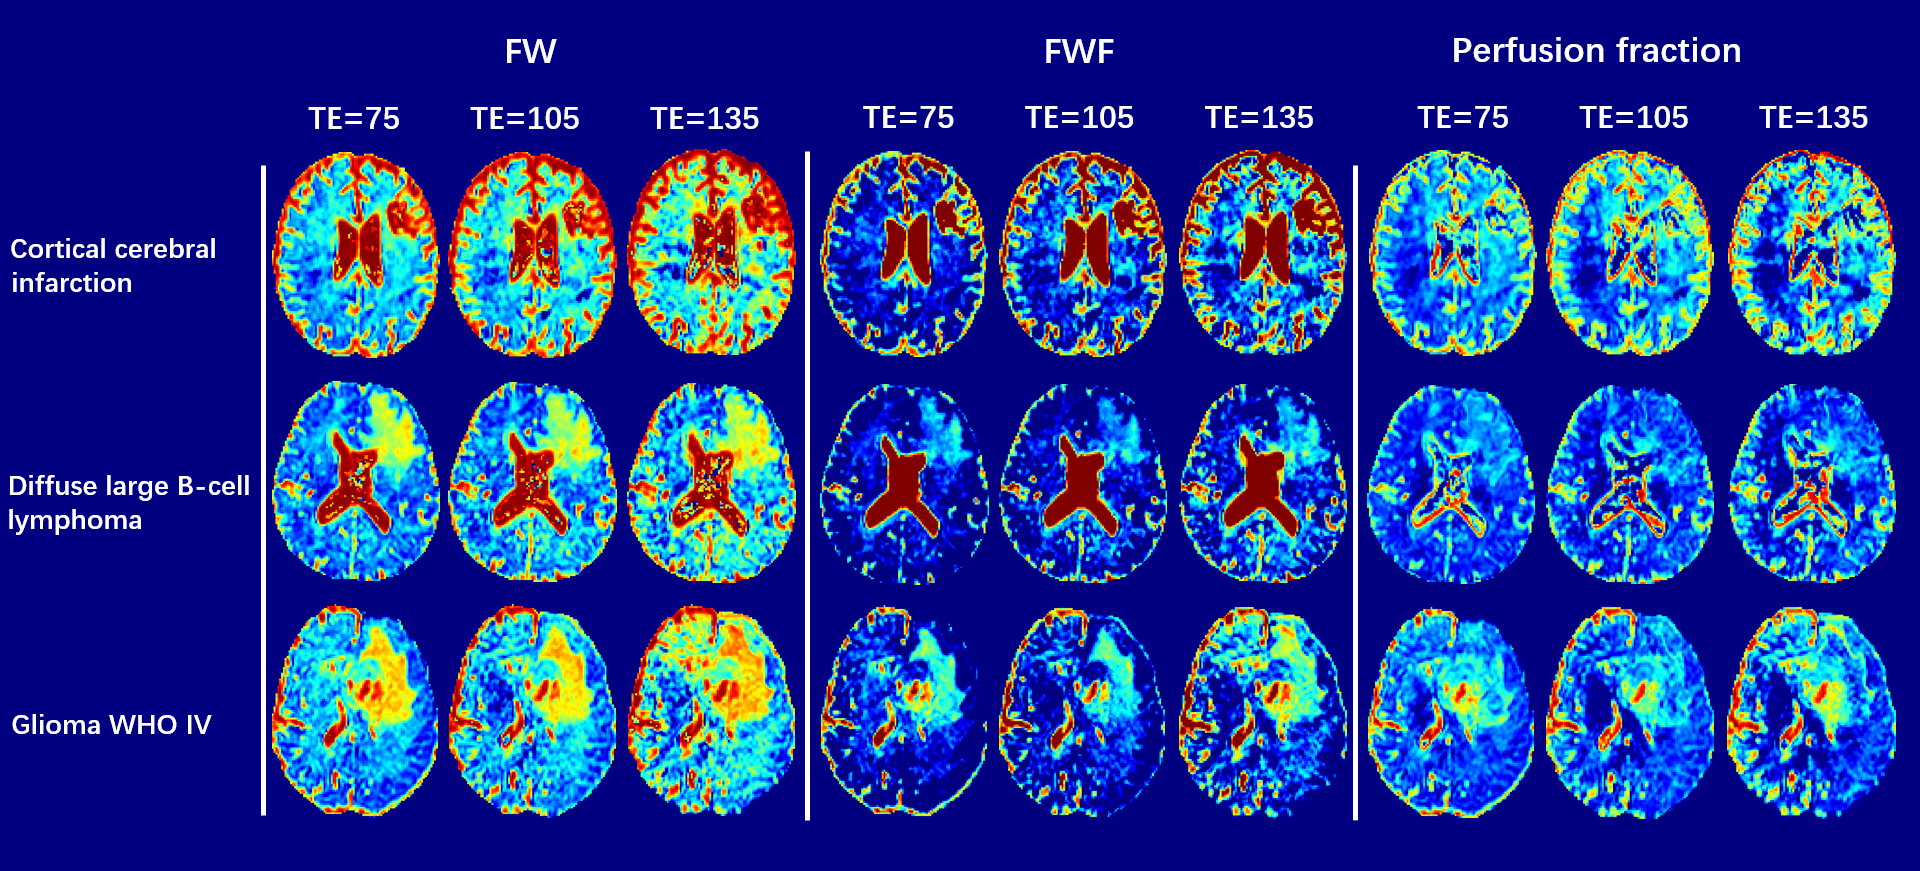
The increase of FWF in GM, SGM, and WM as TE increased was different compared to the increase in CSF. Furthermore, there were notable increases in WM as TE increased for ODI, except for subjects with Multiple Sclerosis. For most subjects, ODI in CSF and GM remained relatively constant. Figure 2 showed three demonstration results on changes of FW, FWF and perfusion fraction measurement maps with TE increasing.
Discussion & Conclusion
Our study revealed that there are significant changes in various microstructural measurements as the TE increases from 75ms to 135ms. These changes vary depending on the type of measurement, the brain tissue, and the subject's health status. Our findings showed notable increases in FW, FWF, and NDI in GM, SGM, WM and CSF. On the other hand, FA and perfusion fraction exhibited a clear decreasing trend. The ODI from most subjects remained relatively stable in most brain tissues.Acknowledgements
This work was supported by the National Natural Science Foundation of China (Nos. 62201265, 62101365, 62172228) and the Natural Science Foundation of Hubei Province of China (No. 2021CFB442).References
1. Le Bihan, Denis, and Mami Iima. "Diffusion magnetic resonance imaging: what water tells us about biological tissues." PLoS biology 13.7 (2015): e1002203.
2. Zhang H, Schneider T, Wheeler-Kingshott CA, Alexander DC. NODDI: Practical in vivo neurite orientation dispersion and density imaging of the human brain. NeuroImage. 2012;61(4):1000-1016. doi:10.1016/j.neuroimage.2012.03.072
3. Wong SM, Backes WH, Zhang CE, et al. On the Reproducibility of Inversion Recovery Intravoxel Incoherent Motion Imaging in Cerebrovascular Disease. Am J Neuroradiol. 2018;39(2):226-231. doi:10.3174/ajnr.A5474
4. Henriques RN, Rokem A, Garyfallidis E, St-Jean S, Peterson ET, Correia MM. [Re] Optimization of a Free Water Elimination Two-Compartment Model for Diffusion Tensor Imaging. Neuroscience; 2017. doi:10.1101/108795
5. Churchill NW, Caverzasi E, Graham SJ, Hutchison MG, Schweizer TA. White matter microstructure in athletes with a history of concussion: Comparing diffusion tensor imaging (DTI) and neurite orientation dispersion and density imaging (NODDI). Hum Brain Mapp. 2017;38(8):4201-4211. doi:10.1002/hbm.23658
6. Fu X, Shrestha S, Sun M, et al. Microstructural White Matter Alterations in Mild Cognitive Impairment and Alzheimer’s Disease: Study Based on Neurite Orientation Dispersion and Density Imaging (NODDI). Clin Neuroradiol. 2020;30(3):569-579. doi:10.1007/s00062-019-00805-0
7. Kamagata K, Hatano T, Okuzumi A, et al. Neurite orientation dispersion and density imaging in the substantia nigra in idiopathic Parkinson disease. Eur Radiol. 2016;26(8):2567-2577. doi:10.1007/s00330-015-4066-8
8. Rae CL, Davies G, Garfinkel SN, et al. Deficits in Neurite Density Underlie White Matter Structure Abnormalities in First-Episode Psychosis. Biol Psychiatry. 2017;82(10):716-725. doi:10.1016/j.biopsych.2017.02.008
9. Gong T, Tong Q, He H, Sun Y, Zhong J, Zhang H. MTE-NODDI: Multi-TE NODDI for disentangling non-T2-weighted signal fractions from compartment-specific T2 relaxation times. NeuroImage. 2020;217:116906. doi:10.1016/j.neuroimage.2020.116906
10.Daducci A, Canales-Rodríguez EJ, Zhang H, Dyrby TB, Alexander DC, Thiran JP. Accelerated Microstructure Imaging via Convex Optimization (AMICO) from diffusion MRI data. NeuroImage. 2015;105:32-44. doi:10.1016/j.neuroimage.2014.10.026
Figures