2601
Measuring Perfusion in Peripheral Artery Disease Using an Advanced IVIM Method1Radiology and Biomedical Imaging, Yale University, New Haven, CT, United States, 2Biomedical Engineering, Yale University, New Haven, CT, United States, 3Medicine (Cardiology), Yale University, New Haven, CT, United States
Synopsis
Keywords: IVIM, Perfusion, Peripheral Artery Disease
Motivation: Peripheral artery disease (PAD) is associated with diabetes, significant comorbidities and mortality-related to coexisting microvascular-disease (MVD) and injury.
Goal(s): To better understand and phenotype PAD, we developed a novel method for intravascular incoherent motion (IVIM) that is clinically feasible and can calculate accurate IVIM-parameter maps reflective of perfusion and tissue viability.
Approach: Our method uses mixture prior for estimating IVIM-parameters. This prior draws statistical power from all voxels to improve the estimate of every voxel's IVIM-parameters.
Results: The proposed method calculates IVIM-parameter maps with plausible range of estimated f and D*. It improves the ability to distinguish between baseline and post-intervention perfusion changes.
Impact: To better characterize and phenotype PAD, we developed a novel method based on mixture-prior for intravascular incoherent motion (IVIM). It shows improved ability to distinguish between baseline and post-intervention images, and could facilitate the early-diagnosis of PAD and coexisting MVD.
Introduction
Peripheral arterial disease (PAD) affects around 8.5 million adults in the USA and 230 million worldwide.1,2 Early diagnosis is crucial for personalized management and therapy planning. Intravoxel incoherent motion (IVIM)3,4 is an MRI method that assesses tissue perfusion and diffusion simultaneously, providing information about tissue viability and wound healing potential. IVIM can potentially detect subtle perfusion abnormalities in the microcirculation, indicating PAD before significant arterial stenosis is observed. Early detection is essential for timely intervention and disease prevention. Here, we present a novel method based on mixture prior to calculating the IVIM’s pseudo-diffusion coefficient (D*) and the flowing blood-fraction (f), which are both connected to the microcirculation in the tissues.Methods
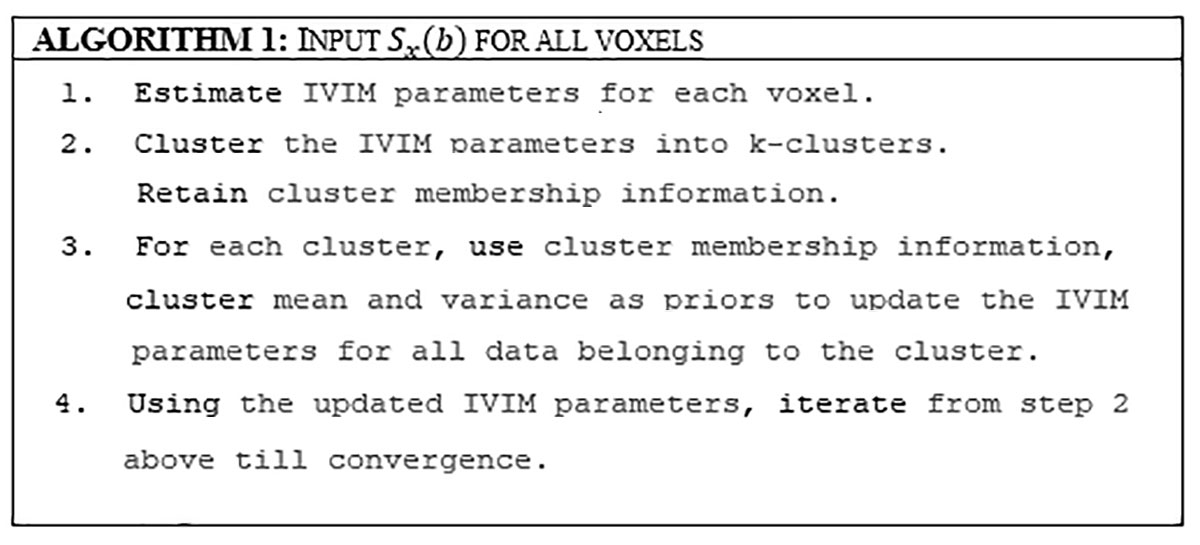
The IVIM model suggests perfusion parameters can be estimated from low b-values, but DWI data is noisy due to scanner gradient imperfections. A mixture prior can improve parameter estimates.5,6 We explain the approach using Figure 1 and the following mathematical description. The IVIM model3,4 states that the signal $$$S(b)=S_0 ( (1-f) e^{(-bD)}+fe^{(-b(D+D^* ) ) } )+n$$$, where $$$S_0$$$ is the noise-free signal at $$$b=0, f $$$ is the fraction of the signal due to perfusion, $$$D$$$ is the diffusion coefficient, $$$D^*$$$ is the pseudo-diffusion coefficient due to perfusion, and $$$n$$$ is measurement noise, which may be taken to have a Normal or a Rician distribution. Suppose $$$S_x=\left\{S(b)|b∈\left\{b_1,⋯,b_n\right\}\right\}$$$ is the set of measured $$$S(b)$$$ values at voxel $$$x$$$. Then, assuming Gaussian noise, the parameters at voxel x can be estimated by the algorithm outlined in Figure 1. In brief, this algorithm assumes a mixture of Gaussians prior for IVIM parameters. The algorithm iterates between updating the IVIM parameters and the prior. Data from all voxels contribute to updating the prior, affecting the parameter estimate at every voxel. The mixture-of-Gaussians prior models different perfusion-diffusion classes in the image.Experiments:
A healthy volunteer was scanned using a 3T MRI scanner (MAGNETOM Prismafit; Siemens Healthcare, Erlangen, Germany) using a PA-Matrix Coil. High-resolution T1W images were acquired with a turbo spin echo sequence (TSE) at 0.8×0.8×2.0 mm3 resolution, TR=819ms, TE=10ms, flip-angle=150°, 196mm field-of-view,10 slices. The experiment test the effect of post-ischemic calf reactive-hyperemia on IVIM-parameters assessed before and after 5ms thigh cuff-occlusion. IVIM datasets in the right calf were acquired using two identical scans in a healthy volunteer, expecting greater differences with greater ischemia induced by high cuff pressures. Both datasets were acquired using a resolve sequence, TE=70ms, and TR=1080ms,196mm field of view, 10 slices, isotropic resolution of 2mm. The diffusion scheme included nine-shell b-values:50,100,150,200,250,300,400,600,800s/mm2, each with six directions and five non-diffusion weighted volumes. Another experiment was conducted using an established porcine-model of hindlimb ischemia induced by injection of embolization beads (Embozene® Microspheres, 14 ml, 250 µm) into the distal external iliac to mimic MVD followed by surgical occlusion at the same location. The IVIM scanning scheme is the same one used in the volunteer.
Data Processing:
The algorithm in Figure 1 was used to estimate IVIM parameters.
Results
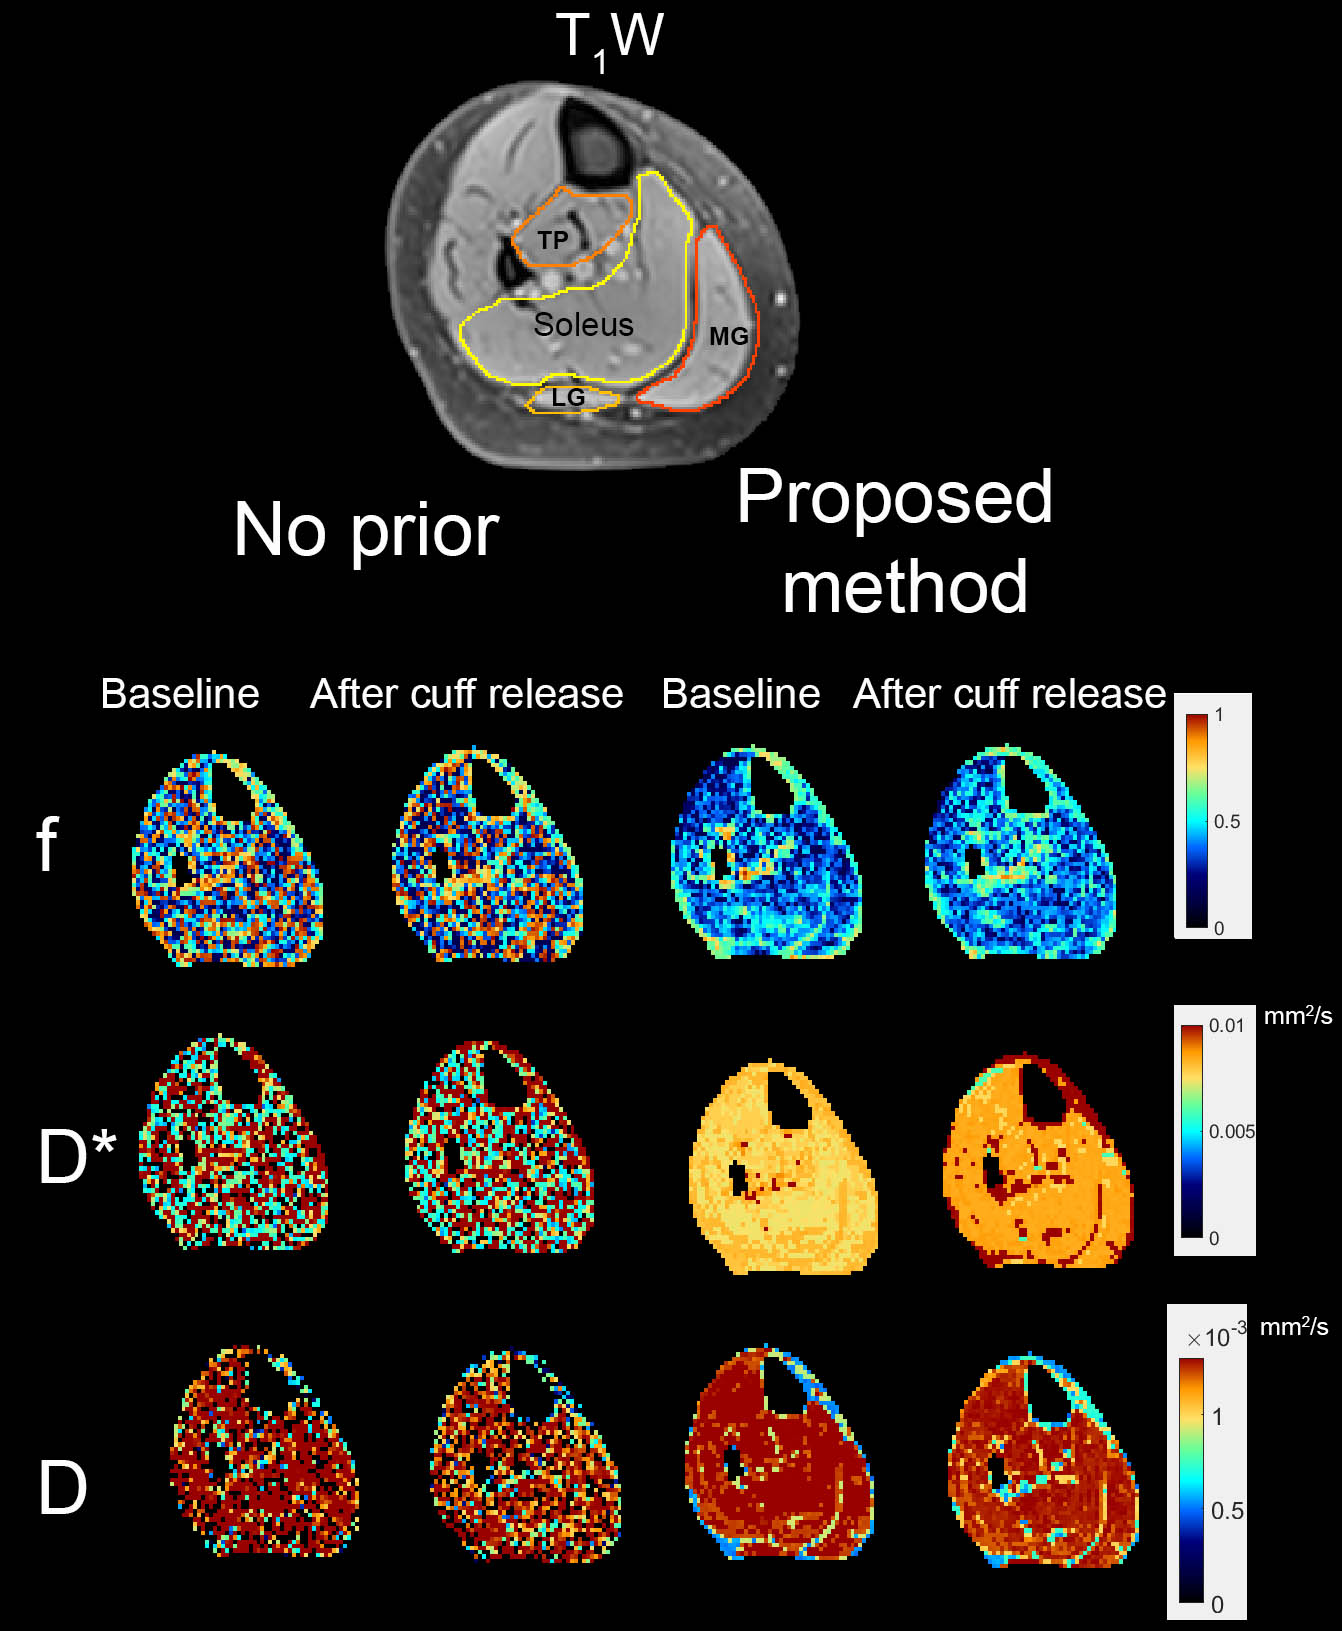
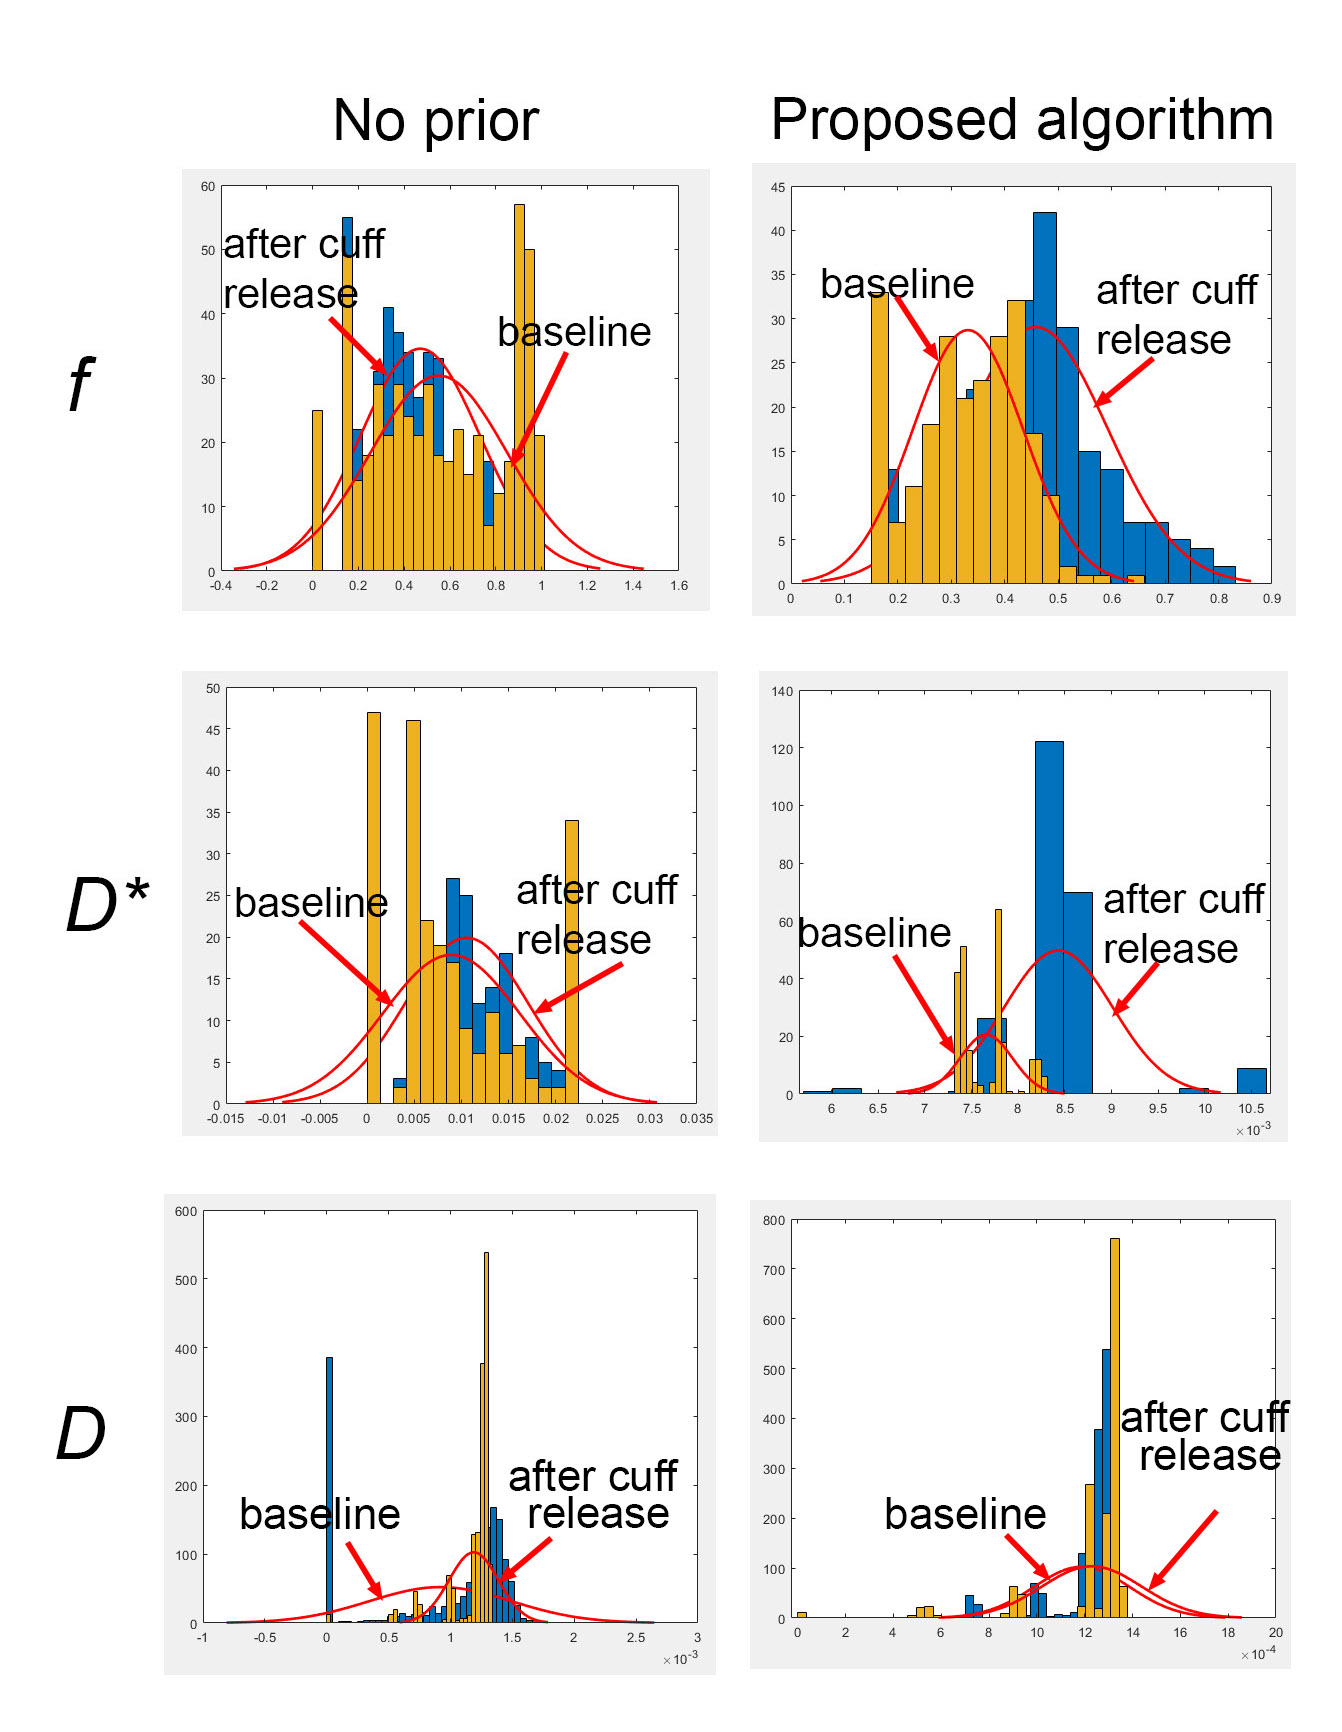
Figure 2 displays four results comparing IVIM parameters without priors and using the algorithm. The parameter estimates are not robust due to noise, and the algorithm shows vastly improved estimates and a plausible range of estimated f and D* values. The mean value of f values in the Soleus muscle with no prior is 55% at baseline and 47% after cuff release, while the D* values are 9.5x10⁻³mm2/s and 8.8x10⁻³mm2/s. The mean value of f in the Soleus muscle using the proposed method was 34% at the baseline and 49% after cuff-release. The mean value of D* in the Soleus muscle was 7.3x10⁻³mm2/s and 8.5x10⁻³ mm2/s. This is consistent with the physiological expectation that the perfusion after cuff-release is higher than baseline. Finally, note that D is unchanged by cuff-release, which follows physiologic expectations. Figure 3 shows the histograms of f and D* in the Soleus of the baseline and after cuff-release using no-prior and the proposed method. Welch’s t-test was applied on f and D* in baseline versus after cuff release, rejecting the null hypothesis of equal means at the default significance level of 5% in f and D* with f t-statstic=-17.3, p-value=1.7e-52, and D* t-statistic=-18.4, p-value=4e-38. While for D the t-test does not reject the null hypothesis, tstatistic= -0.8277 p-value=0.04.Figures 4,5 illustrate the porcine results of the proposed algorithm with a mean value of 50.8% for f and 3.8x10⁻⁴ mm2/s for D*. The mean water diffusion D was 4x10⁻⁵mm2/s.
Discussion and Conclusion
Using the proposed mixture prior method, we observed improved estimates of the IVIM parameters and a plausible range of estimated $$$f$$$ and $$$D^*$$$ values in the expected tissue locations.Acknowledgements
No acknowledgement found.References
1. Fowkes, F. G. et al. Comparison of global estimates of prevalence and risk factors for peripheral artery disease in 2000 and 2010: a systematic review and analysis. Lancet 382, 1329-1340, doi:10.1016/s0140-6736(13)61249-0 (2013).
2. Mozaffarian, D. et al. Heart Disease and Stroke Statistics-2016 Update: A Report From the American Heart Association. Circulation 133, e38-360, doi:10.1161/cir.0000000000000350 (2016).
3. Le Bihan, D. et al. Separation of diffusion and perfusion in intravoxel incoherent motion MR imaging. Radiology 168, 497-505, doi:10.1148/radiology.168.2.3393671 (1988).
4. Le Bihan, D. What can we see with IVIM MRI? NeuroImage 187, 56-67, doi:https://doi.org/10.1016/j.neuroimage.2017.12.062 (2019).
5. Koss, J., DeLorenzo, C. & Tagare, H. D. Hierarchical MAP Denoising of Longitudinal Hamilton Depression Rating Scores. Proceedings (IEEE Int Conf Bioinformatics Biomed) 2021, 1389-1394, doi:10.1109/bibm52615.2021.9669362 (2021).
6. Koss, J., Tinaz, S. & Tagare, H. D. Hierarchical Denoising of Ordinal Time Series of Clinical Scores. IEEE Journal of Biomedical and Health Informatics 26, 3507-3516, doi:10.1109/JBHI.2022.3163126 (2022).
Figures
Figure
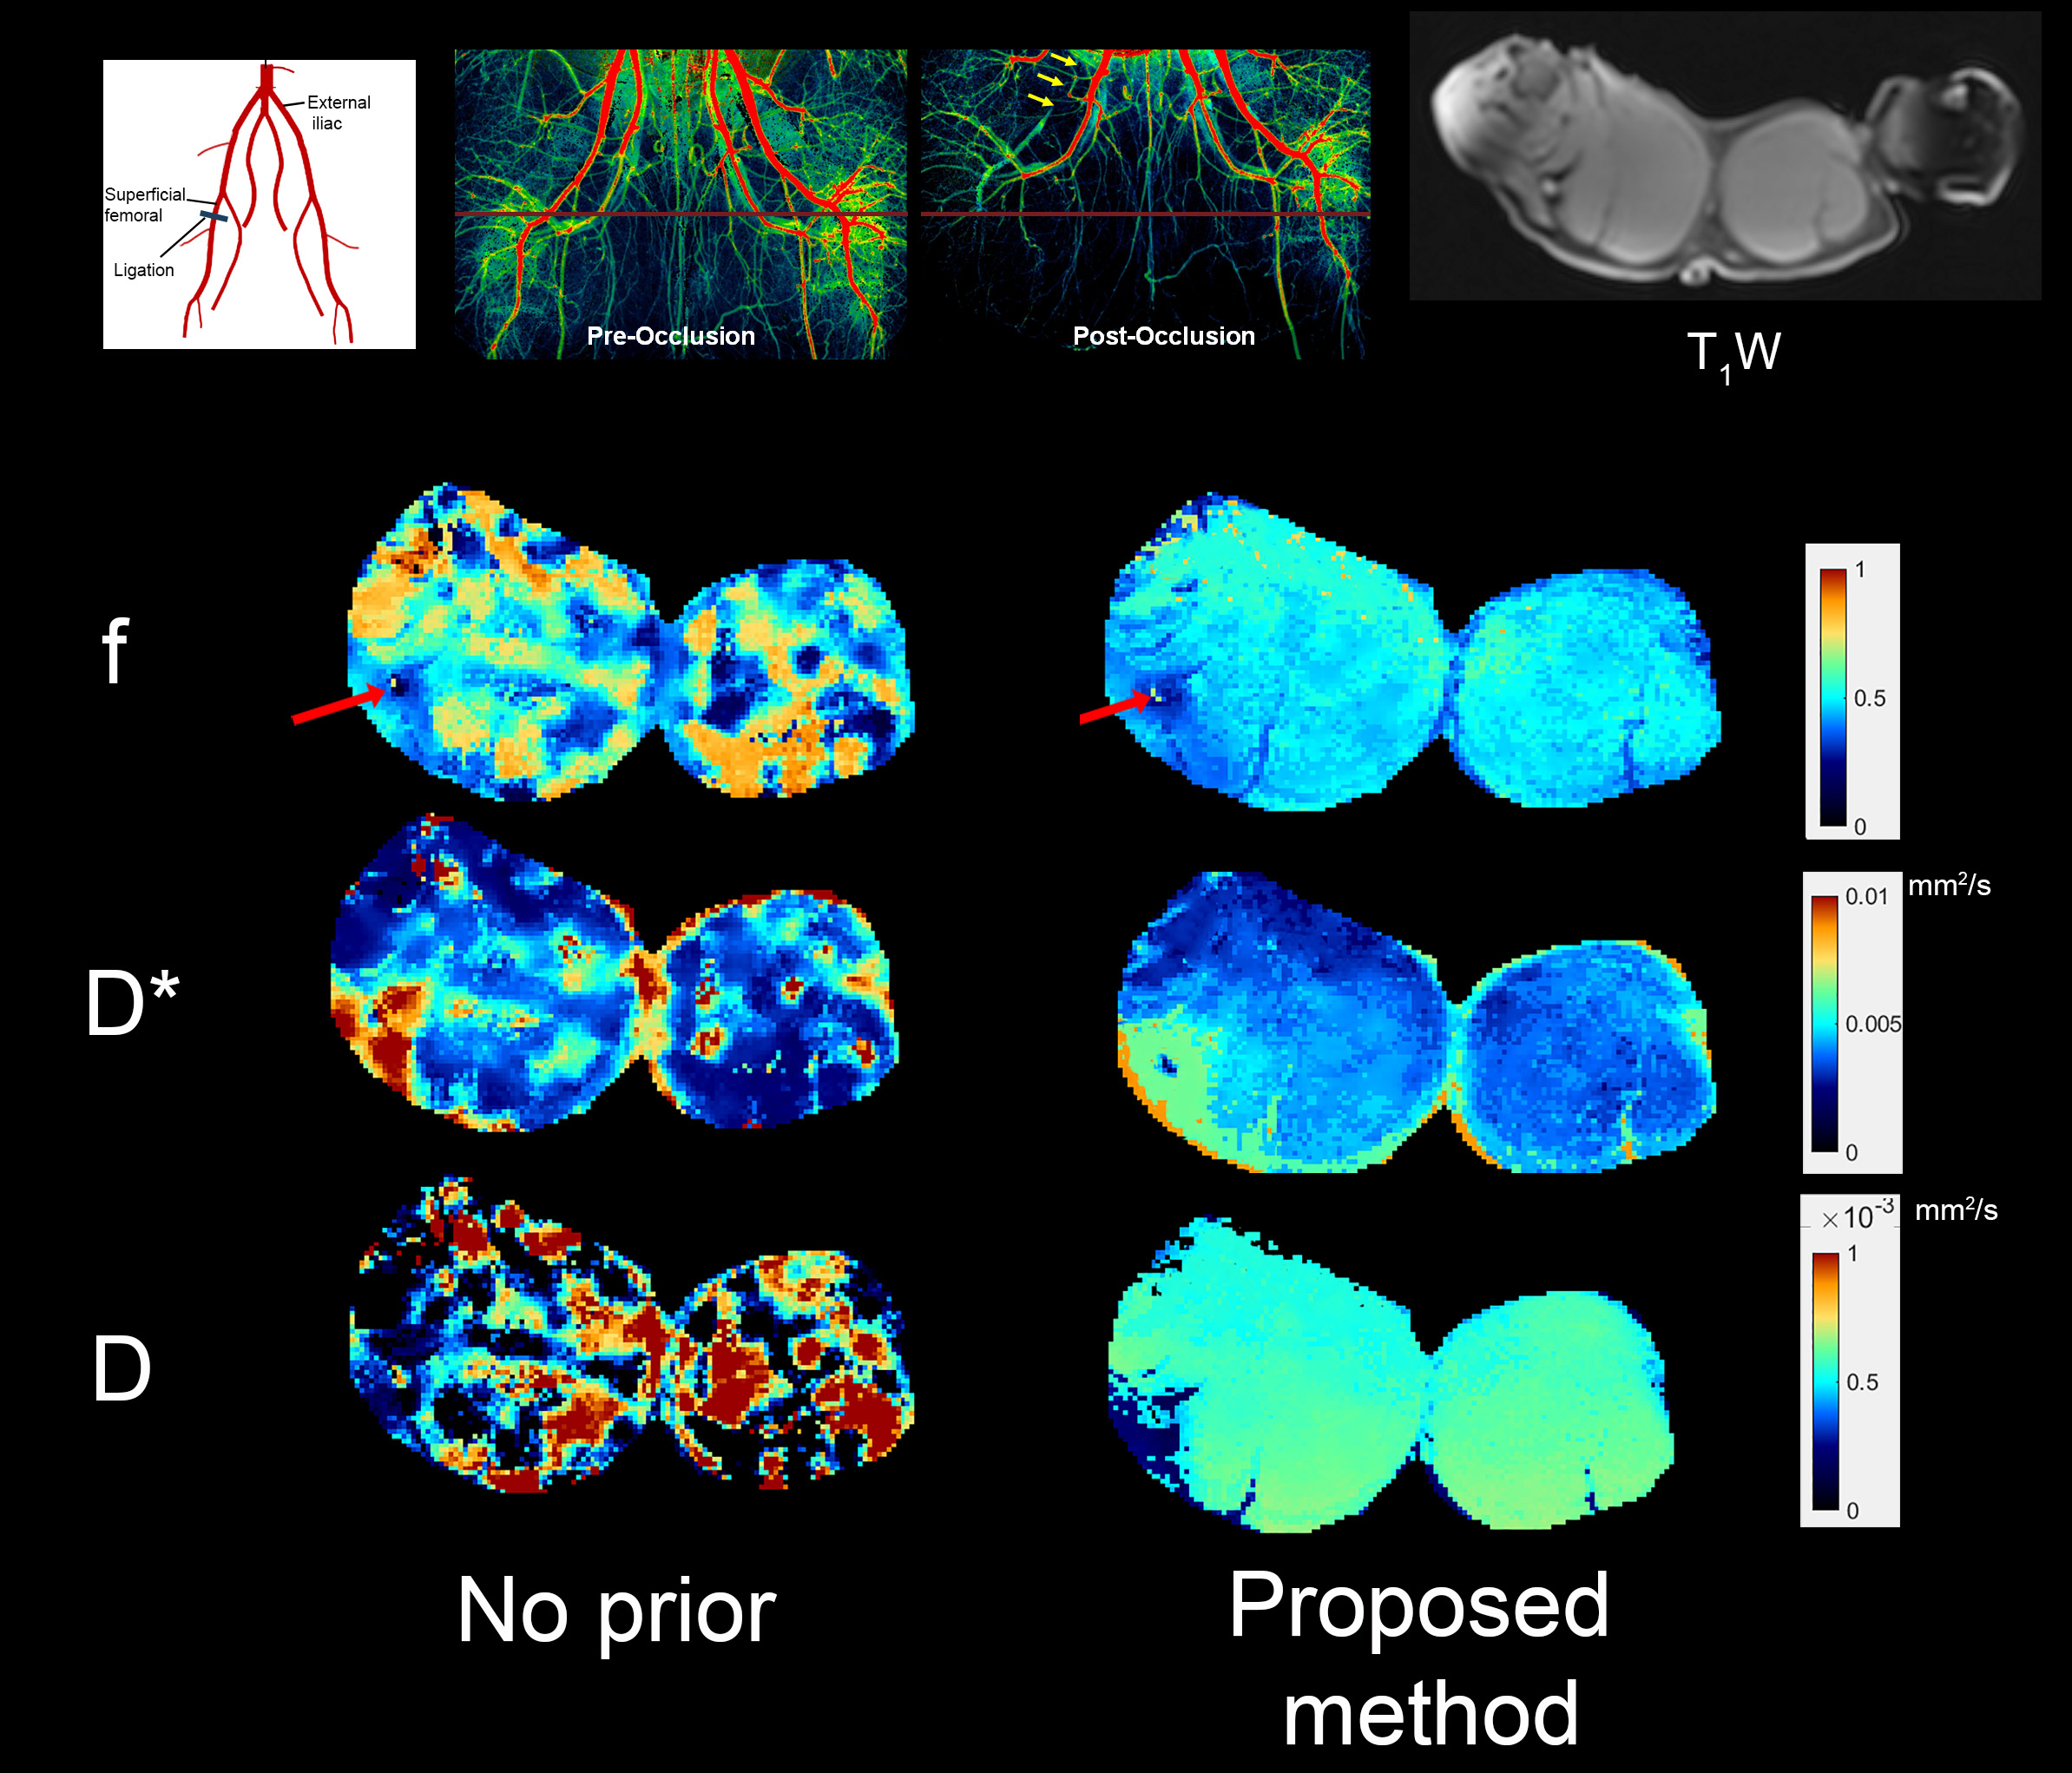
4. A porcine
femoral
artery is occluded using a model of hindlimb
ischemia by injecting embolization beads into the distal external iliac to mimic MVD followed
by surgical occlusion. The top two middle fluoroscopy images highlight pre and post-occlusion. The top right T1w image is in the same location as the DWIs. The
second row shows f images calculated by fitting without a prior versus
those calculated by the proposed method. The third row shows D* values; note the higher values in the occlusion area, which can be explained by blood leakage. Finally, the
bottom row shows the D values.
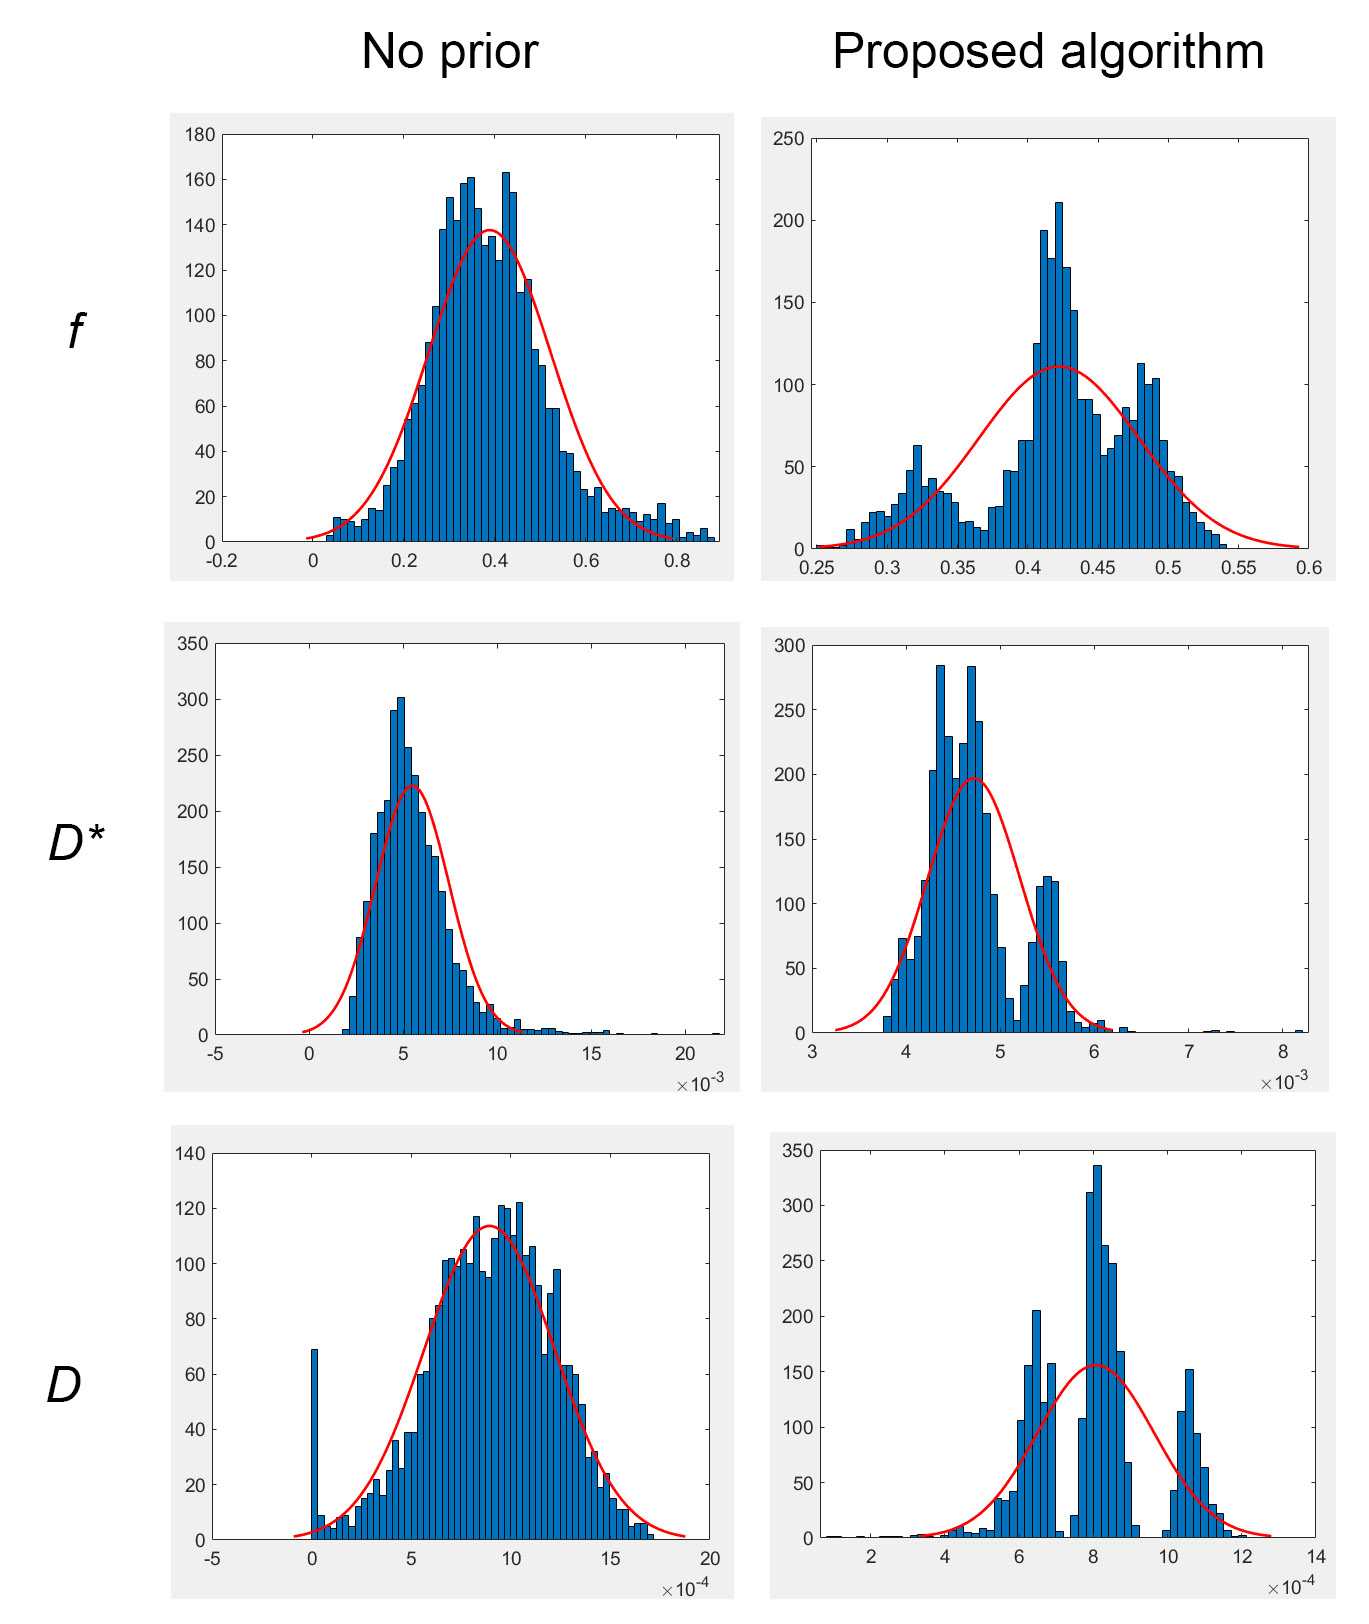
Figure 5. Histograms
of f, D*, and D values of results shown in Figure 4 in case of no-prior and the proposed algorithm with superimposed fitted normal density. Notice the unimodal histograms in the case of no-prior. A Welch’s t-test was applied on f, D*, and D between the no-prior versus the proposed algorithm, rejecting the null hypothesis of equal means at the default significance level of 5%, with the t-statistic=-12.6, p-value=5.6e-36 in case of f, t-statistic=21, p-value=1.2e-94 in case of D* and finally t-statistic = 12.99, p-value=4.1e-38 in case of D.