2599
The analysis of kidney diffusion patterns with non-linear least square method in AKI1Department of Radiology, Guangdong Provincial People’s Hospital (Guangdong Academy of Medical Sciences), Southern Medical University, Guangzhou, China, 2Department of Radiology, Hainan General Hospital, Haikou, China, 3Radiotherapy Center, Affiliated Cancer Hospital & Institute of Guangzhou Medical University, Guangzhou, China, 4Philips Healthcare, Shenzhen, China, 5Medical Imaging Center, Nanfang Hospital, Southern Medical University, Guangzhou, China, 6Guangdong Provincial Key Laboratory of Artificial Intelligence in Medical Image Analysis and Application, Guangzhou, China
Synopsis
Keywords: Diffusion Analysis & Visualization, Kidney
Motivation: Diffusion components and the initial values must be specified in advance in IVIM, which might not be sensible in tissues with complicated diffusion characteristics.
Goal(s): To reveal the changes of diffusion patterns of kidney in acute kidney injury (AKI).
Approach: Non-negative least squares (NNLS) method shown to derive the number of compartments from the data, rather than to impose it in the analysis of diffusion signals was employed.
Results: The volume fraction of tubular or/and vascular decreased significantly and restricted tissue water diffusion was detected in AKI.
Impact: Our results suggest that NNLS model is potentially a valuable tool for accurate description of diffusion in kidney.
Introduction
Diffusion Weighted Imaging (DWI) is considered a non-invasive tool in probing the microstructure and function of kidney. In well-perfused organs, multi diffusion components may be present, especially under pathologic circumstances(1, 2). Intravolxe incoherent motion (IVIM) is usually employed in the analysis of diffusion characteristics of multi-compartments. However, the number of diffusion components and the initial values must be specified in advance in IVIM. On the contrary, non-negative least squares (NNLS) method was shown to derive the number of compartments from the data, rather than to impose it in the analysis of diffusion signals(3). In kidney, at least three diffusion components of slow, intermedia and fast diffusion rate were reported(4, 5). The purpose of this study was to reveal the changes of diffusion patterns of kidney in acute kidney injury (AKI) with NNLS method.Methods
Data acquisition: The study was approved by the local ethics committee. Forty-six AKI patients and 14 healthy volunteers were included in this study after giving written informed consent. All participants underwent imaging on a 3T MR scanner (Ingenia, Philips Healthcare, Best, the Netherlands) using a 32-channel torso coil for signal reception. Diffusion weighted images of multi-b values were obtained with a single-shot spin-echo EPI sequence using respiratory trigger, with following parameters: TR/TE = ms; FOV: mm2; acquired matrix: ; slice thickness = 5mm; number of slices = 12; EPI echo train length = 55; number of averages = 2; acceleration factor = 2.5. The b values were 0, 10, 20, 40, 70, 120, 200, 400 and 800 s/mm2.Data analysis: Before fitting, the acquired images were first denoised with non-local means principal component analysis (NLM-PCA) (6).
The NNLS algorithm developed by Lawson and Hanson (7) was used for the spectral diffusion analysis of the kidneys. With NNLS method, the diffusion weighted signal of the i-th b-values yi is considered to be the sum of multiple exponentially decaying components:
$$$y_i=∑_{j=1}^M{s_je^{-b_i D_j } }, i = 1, 2, …, N$$$ (1)
where Dj is j-th diffusion coefficient, sj the relative amplitude of basis function e-biDj , M the number of diffusion coefficients, and N the number of b values. In our study, the dictionary of D included 200 logarithmically spaced values ranging from $$$0.1\times10^{-3}$$$ to $$$1$$$ mm2/s. Eq.1 can be solved numerically in a least-squares way and provides a number of relative amplitudes of the diffusion coefficients. The mean diffusivity (MD) in a specific range ( Dmin to Dmax) is calculates as:
$$$ MD =\exp [\frac{\sum_{D_{min}}^{D_{max}}s(D)logD}{\sum_{D_{min}}^{D_{max}}s(D)}]$$$ (2)
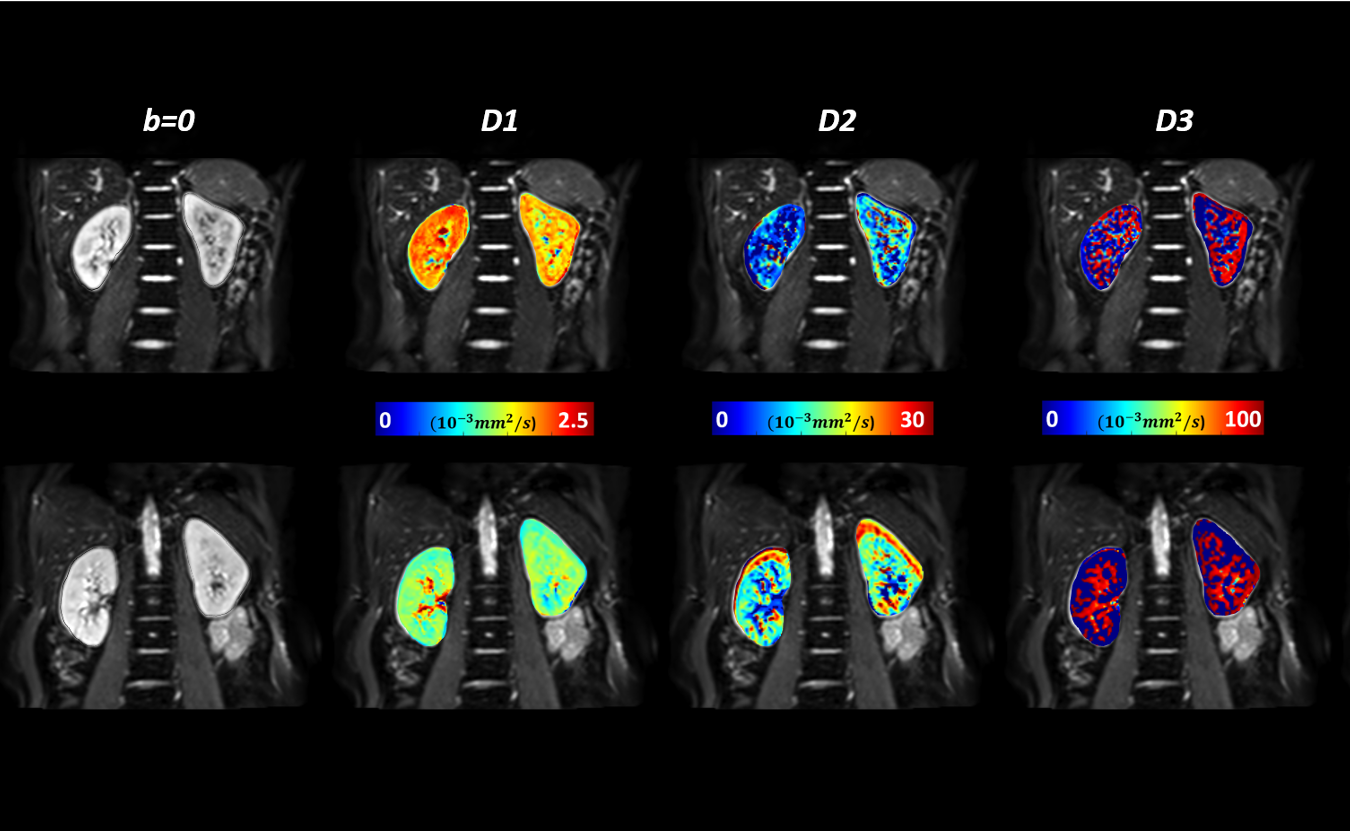
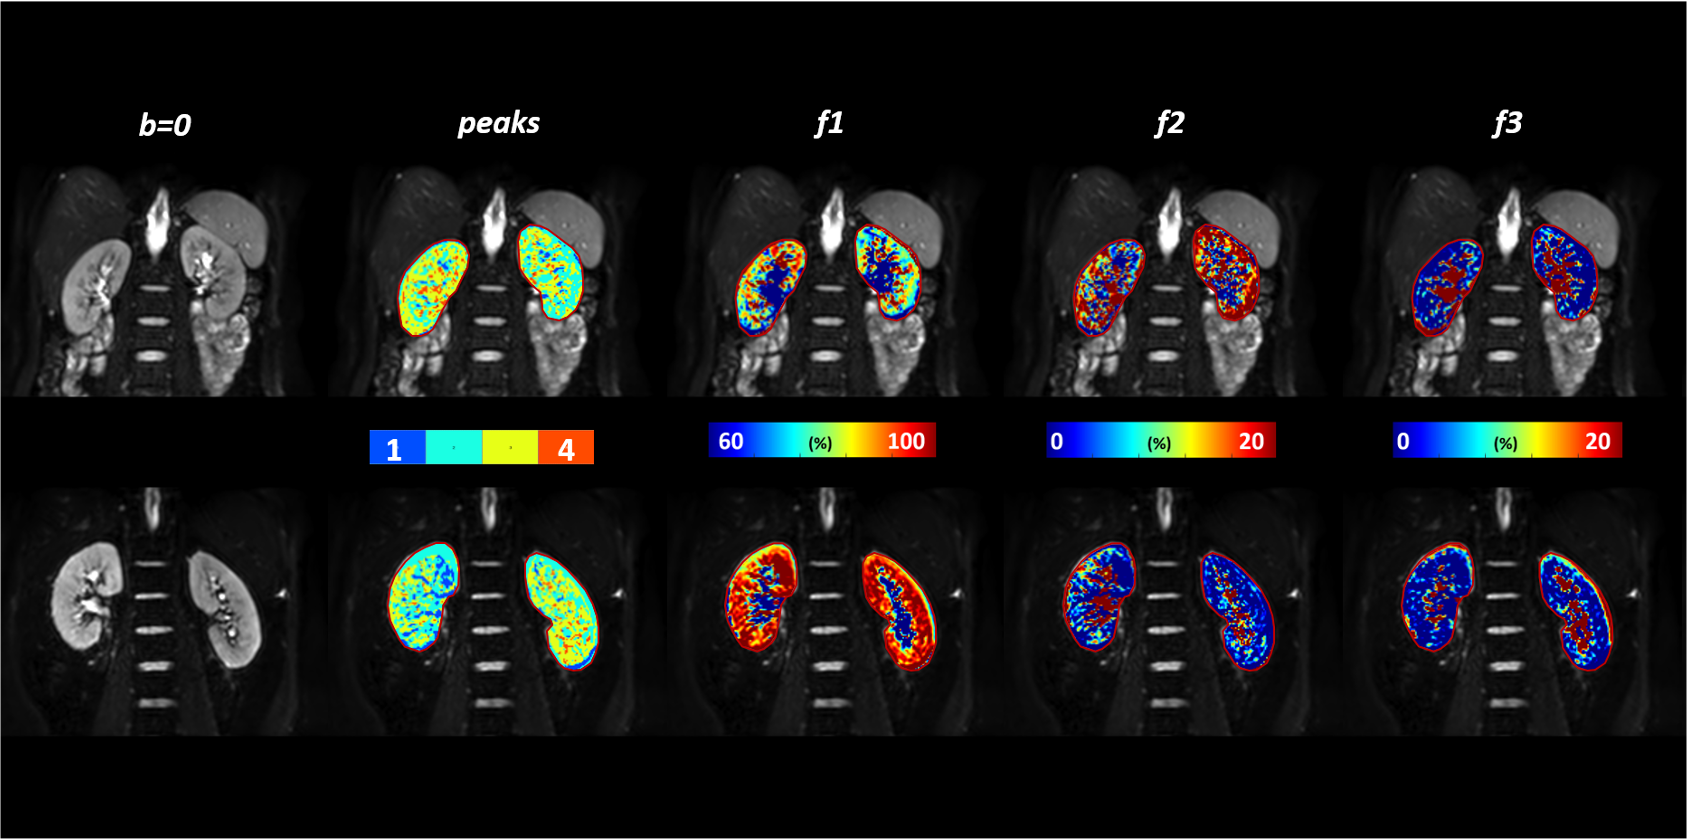
To particularly investigate the main diffusion components (tissue water diffusion, tubular and vascular flow and blood flow in larger vessels) in kidney, the diffusion spectrum was divided into three ranges:$$$0.1-5\times10^{-3}$$$, $$$5-50\times10^{-3}$$$, and $$$50-1000\times10^{-3}$$$mm2/s. The mean diffusivity (D1, D2 and D3) and corresponding signal fractions (amplitude) (f1, f2, f3) of each range were derived.
Results and Discussion
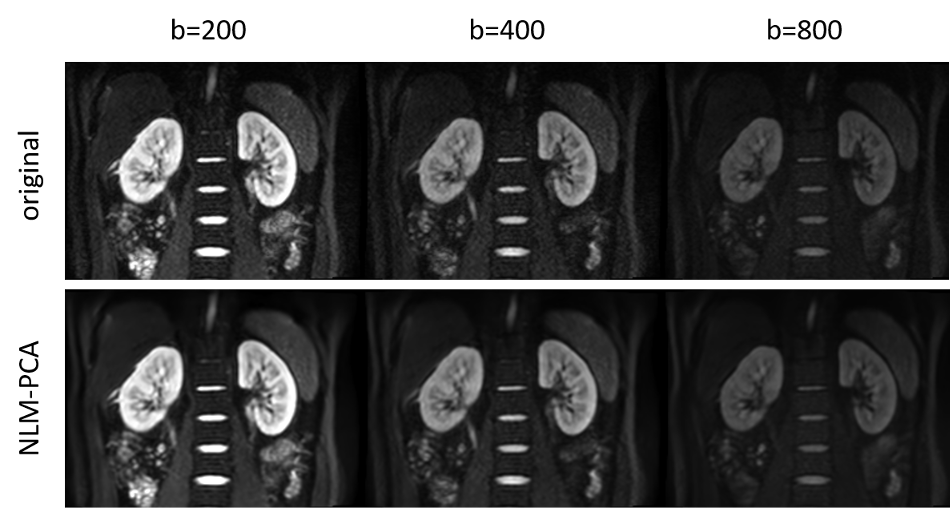
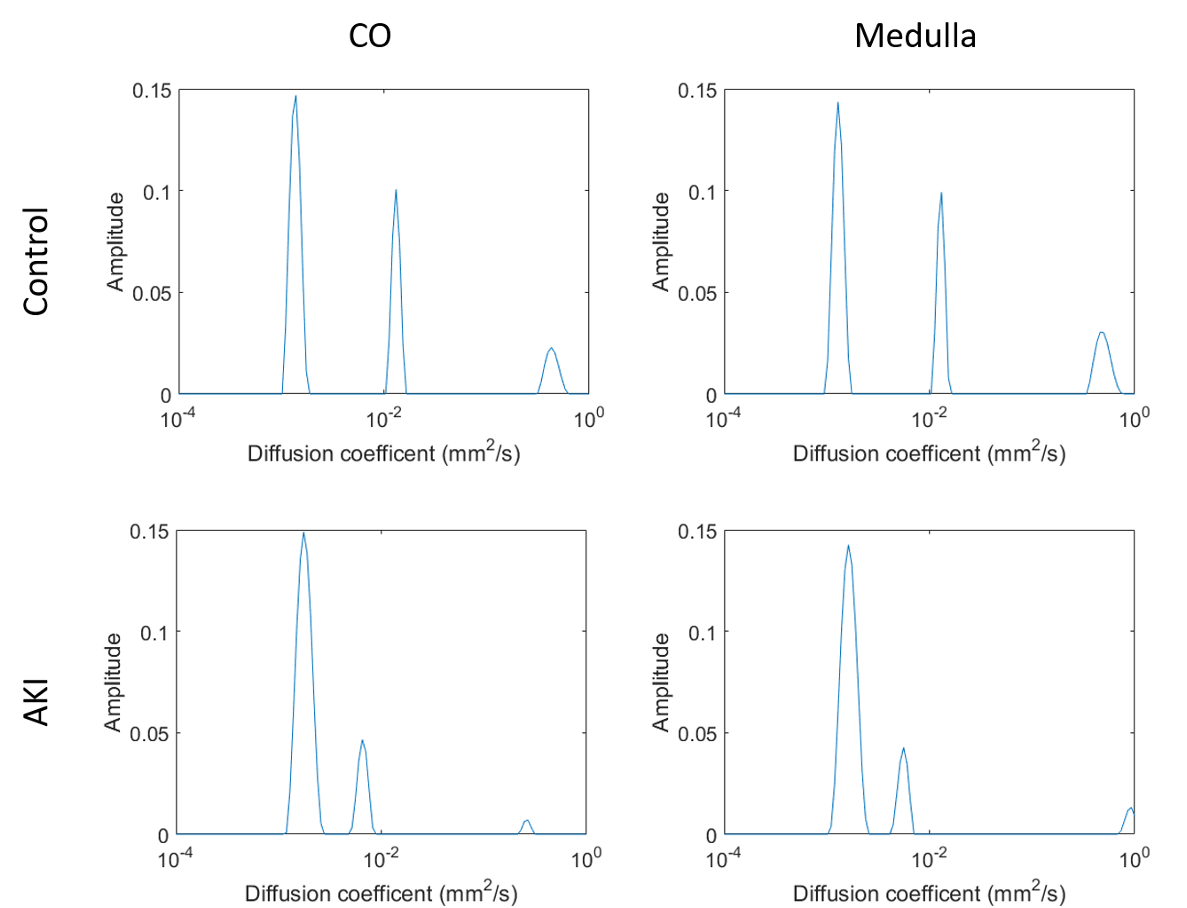
The denoised results of DWI images were shown in Fig.1. The noise was removed while the structural details were kept, which could be beneficial to the fitting afterwards.The diffusion coefficient spectrums of healthy control and AKI patient were shown in Fig.2. Both healthy control and AKI patient showed three peaks in cortex and medulla, but the peaks represent fast diffusion components of the AKI patients were lower compared to healthy control. Lower D1 and f2, higher f1 were observed in AKI patients in Fig.3 and Fig.4, which was in accordance with changes of the height and areas of the peaks Fig.2, suggesting the decrease of fraction of tubular and capillary flow in cortex and restricted tissue water motion in both cortex and medulla in AKI patients. The number of peaks in diffusion spectrum was slightly lower in AKI patients, which might implicate the decrease of diffusion components.
The diffusion coefficients and fractions were summarized in Tab.1. No significant changes of blood flow of larger vessels (D3 and f3) were observed.
In this study, the diffusion characteristics of three components (tissue water diffusion, tubular and vascular flow and blood flow in larger vessels) in AKI were analyzed with NNLS. The results showed that the volume fraction of tubular or/and vascular decreased significantly and restricted tissue water diffusion was detected in AKI. Our results suggest that NNLS model is potentially a valuable tool for accurate description of diffusion in kidney.
Acknowledgements
No acknowledgement found.References
1. Cercueil JP, Petit JM, Nougaret S, et al.: Intravoxel incoherent motion diffusion-weighted imaging in the liver: comparison of mono-, bi- and tri-exponential modelling at 3.0-T. Eur Radiol 2015; 25:1541–1550.
2. Wong SM, Backes WH, Drenthen GS, et al.: Spectral Diffusion Analysis of Intravoxel Incoherent Motion MRI in Cerebral Small Vessel Disease. J Magn Reson Imaging 2020; 51:1170–1180.
3. Marchand AJ, Hitti E, Monge F, et al.: MRI quantification of diffusion and perfusion in bone marrow by intravoxel incoherent motion (IVIM) and non-negative least square (NNLS) analysis. Magn Reson Imaging 2014; 32:1091–1096.
4. van Baalen S, Leemans A, Dik P, Lilien MR, ten Haken B, Froeling M: Intravoxel incoherent motion modeling in the kidneys: Comparison of mono-, bi-, and triexponential fit. J Magn Reson Imaging 2017; 46:228–239.
5. van der Bel R, Gurney-Champion OJ, Froeling M, Stroes ESG, Nederveen AJ, Krediet CTP: A tri-exponential model for intravoxel incoherent motion analysis of the human kidney: In silico and during pharmacological renal perfusion modulation. Eur J Radiol 2017; 91:168–174.
6. Manjón J V., Coupé P, Buades A: MRI noise estimation and denoising using non-local PCA. Med Image Anal 2015; 22:35–47.
7. Bjarnason TA, Mitchell JR: AnalyzeNNLS: Magnetic resonance multiexponential decay image analysis. J Magn Reson 2010; 206:200–204.
Figures