2593
What can be reliably measured in IVIM model: exploring the collinearity in IVIM parameter fitting.1University of Texas Southwestern Medical Center, Dallas, TX, United States, 2Johns Hopkins University, Baltimore, MD, United States
Synopsis
Keywords: Diffusion Modeling, Modelling, Quantitative Imaging, Diffusion
Motivation: Estimating IVIM diffusion MRI (dMRI) parameters through non-linear fitting is challenging due to the inherent ill-posed mathematical problem, causing large uncertainty and poor reproducibility.
Goal(s): Understand IVIM-dMRI model properties and derive a more reliable metric than individual IVIM parameters.
Approach: Given a dMRI protocol, we investigated diffusion decay signal distributions for various IVIM parameters via numerical simulations. Employing dimension reduction, we defined a new parameter that captured the largest decay signal variation and is hence most robust against noise.
Results: A new metric was proposed to have the best achievable robustness for IVIM model parameter fitting.
Impact: We proposed a new metric that attains the best achievable robustness for IVIM model parameter fitting. This study addressed the large uncertainty and poor reproducibility issue in IVIM fitting.
Introduction
In the Intravoxel Incoherent Motion(IVIM) model of diffusion MRI(dMRI), signal of each pixel is fitted in a bi-exponential decay form as a function of diffusion weighting $$$b$$$ to separate cellular diffusion component $$$(D_t)$$$ and pseudo-perfusion component $$$(F_p,D_p)$$$ as defined in Eq.(1)1. $$S=F_p*exp(-b*D_p)+(1-F_p)*exp(-b*D_t)\;\;\;\text{(1)}$$For clinical applications as reliable imaging biomarkers, it is crucial that the derived model parameters $$$(F_p, D_t, D_p )$$$ are robust against noise and sensitive2. However, it is known that the parameters obtained are often subject to a large uncertainty, particularly in the context of low signal-to-noise ratios(SNRs)3. This uncertainty arises from the ill-conditioned mathematical problem of bi-exponential model fitting4,5. To overcome this problem, we conducted an analysis to understand inherent mathematical properties of the IVIM-dMRI model. We also devised a novel metric by recombining individual fitted IVIM model parameters. The new metric attains the best achievable robustness in the presence of measurement noise. This metric can potentially serve as a biomarker, enhancing the utility of IVIM model in clinical applications.
Methods
We considered IVIM model parameters in the range of clinical relevance $$$(F_p\in (0,0.3],D_t\in (0,3\times 10^{-3}]mm^2/s,D_p\in (3\times 10^{-3},10\times 10^{-3}]mm^2/s)$$$. Each parmeter was equally sampled through the range, generating 2250 tissue types defined by $$$(F_p,D_t,D_p)$$$. For a dMRI acquisition protocol with eight $$$b$$$-values $$$(b=0,5,50,100,200,500,800,1000 s/mm^2)$$$, we computed the dMRI signal of each tissue, with the signal $$$S_0$$$ at $$$b=0s/mm^2$$$ set to unity. These generated 2250 dMRI signals each represented as a vector in the 8-D signal space.To understand the data distribution of dMRI signal, we performed principal component analysis(PCA) to explore the feasibility of approximating the data by a low-dimensional linear space, and if so, define the direction corresponding to the largest variation of signal(first principal component). We further projected the dMRI signal variation to this principal component and mapped this value back to the 3D parameter space $$$(F_p,D_t,D_p)$$$. A linear and a quadratic function was used to capture the variation in decay signal.
For application, three IVIM parameters were calculated via non-linear regression with the boundary set as $$$F_p\in (0,1),D_t\in (0,3\times 10^{-3}]mm^2/s,D_p\in (3\times 10^{-3},+\infty)mm^2/s$$$, which were then combined through the derived linear or quadratic function to form a new metric. This metric is expected to have the most achievable robustness against noise perturbation to dMRI signal and highest sensitivity to signal variations among all possible linear or quardric combinations of IVIM model parameters, as variation of this metric is directly linked to the largest variation of the dMRI signal and conversely, small noise perturbation in dMRI signal does not cause large variation of this metric.
Results
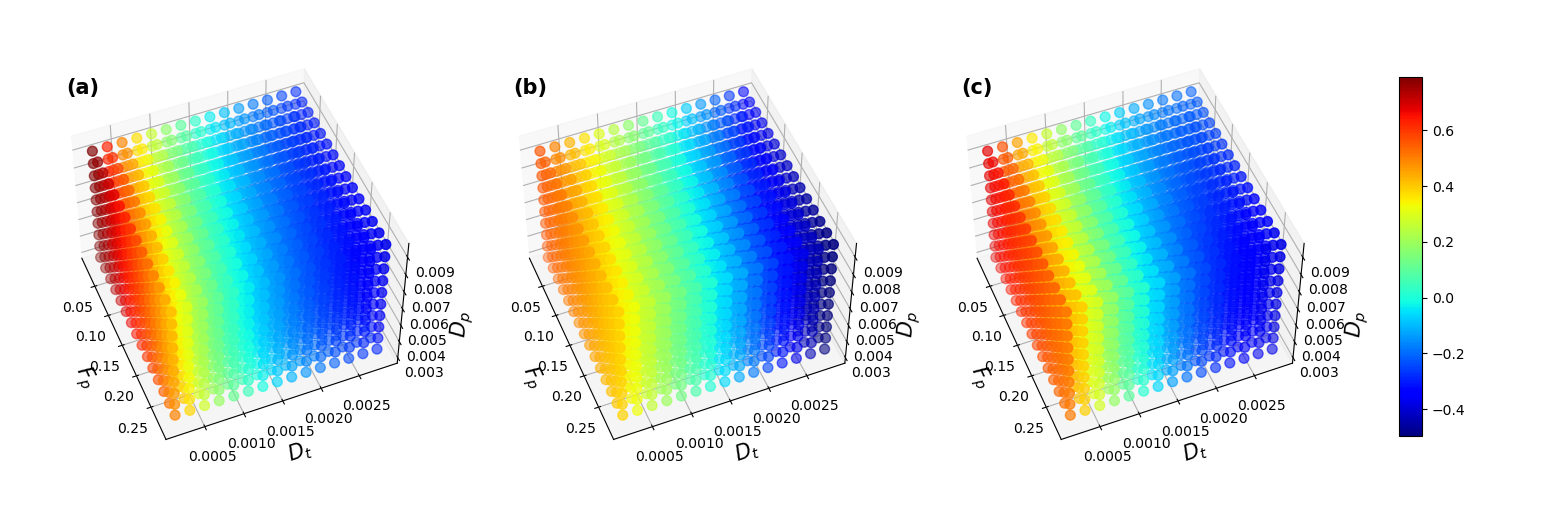
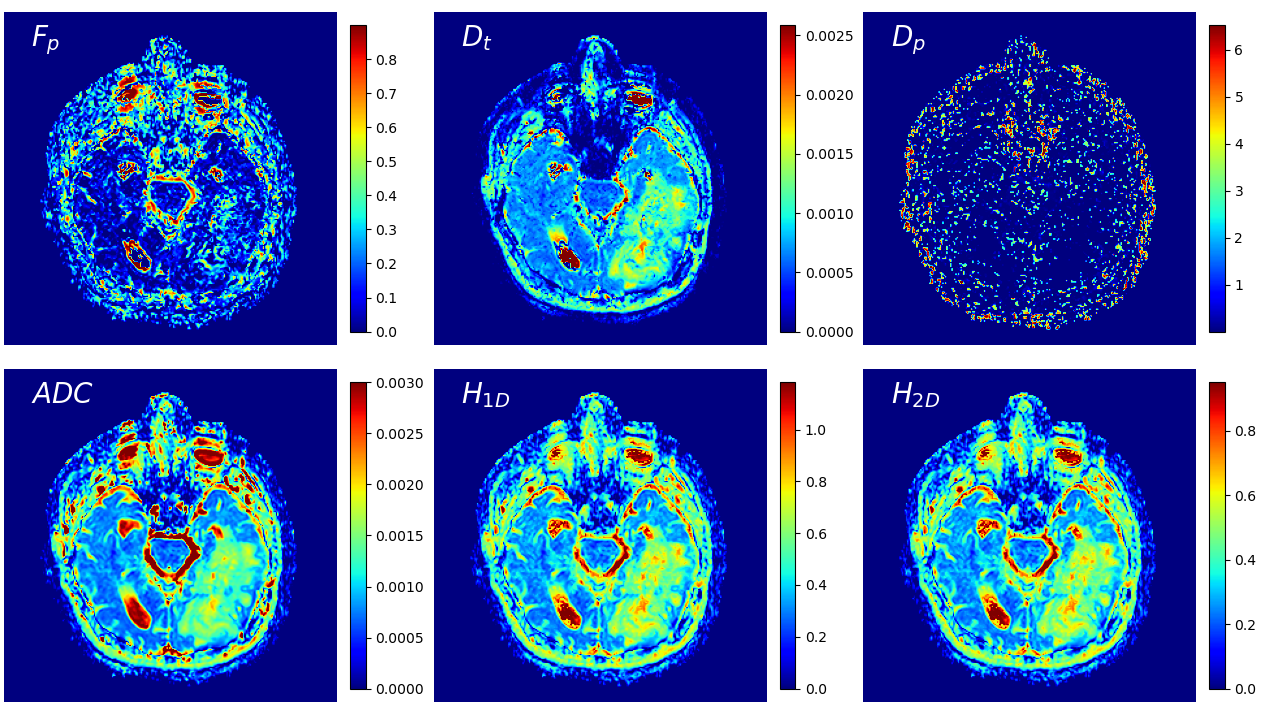
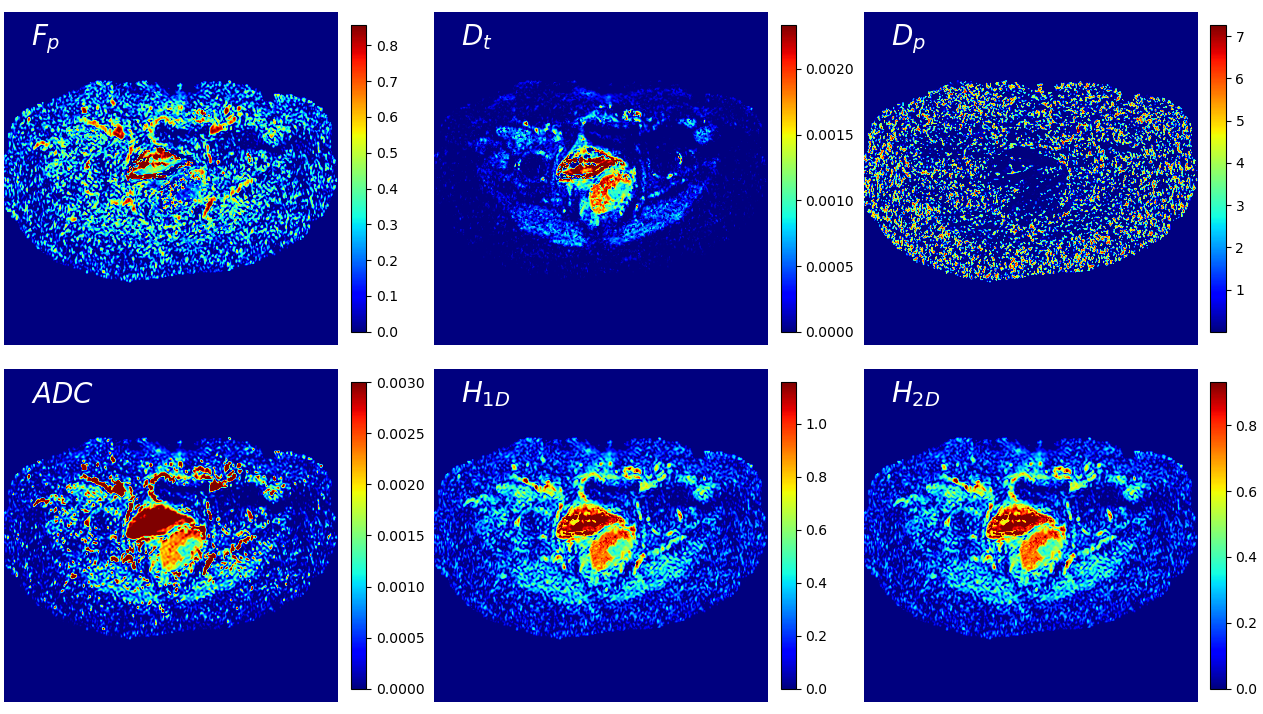
The first three principal components(PC) account for 98.0%,1.9%,0.1% of the total signal variation. Projecting dMRI signals to the first PC and mapping the value to the 3D IVIM parameter space yielded a colormap representing the signal variation in the parameter space(Fig.1a). The signal variation was fitted by a linear function as $$$H_{1D}=-0.235\frac{F_p}{0.3}-1.243\frac{D_t}{0.003}-0.084\frac{D_p}{0.01}+0.794$$$, with a relative mean squared error(RMSE) of 0.016. Considering the small coefficient for $$$\frac{D_p}{0.01}$$$ compared to that for $$$\frac{F_p}{0.3}$$$ and $$$\frac{D_t}{0.003}$$$ and the unstable fitting of $$$D_p$$$ that frequently reaches the upper bound, $$$D_p$$$ was omitted, resulting in $$$H_{1D}=0.235\frac{F_p}{0.3}+1.243\frac{D_t}{0.003}$$$. Similarily, the quadratic metric was generated as $$$H_{2D}=-1.256(\frac{D_t}{0.003})^2+0.235\frac{F_p}{0.3}+2.504\frac{D_t}{0.003}$$$ with RMSE 0.003. Both the linear and quadratic functions represented the signal variations well(Fig.1b and 1c), while the quadratic function is more accurate numerically.In a brain tumor patient(Fig.2) and a cervix cancer patient(Fig.3), the tissue contrast in $$$H_{1D}$$$ and $$$H_{2D}$$$ maps provided better image SNR and constrast and enhanced tissue delineation compared to individual IVIM parameters. Specifically, intratumoral heterogeity and tumor boundary can be better visualized on the new metric maps compared with $$$D_t$$$ map and apparent diffusion coefficient(ADC) map. No significant difference was observed between $$$H_{1D}$$$ and $$$H_{2D}$$$ maps.
Discussion and Conclusion
To further explore the impact of the range of $$$D_p$$$ on the $$$H_{1D}$$$, we increased the sampling upper bound of $$$D_p$$$ from $$$10\times 10^{-3}mm^2/s$$$ to $$$1mm^2/s$$$ in signal generation, and found the coefficient for $$$D_p$$$ decreased as the upper bound increased. This indicates $$$D_p$$$ does not have much impact on signal differentiation, further supporting ignoring the $$$D_p$$$ term in $$$H_{1D}$$$.Since $$$H_{1D}$$$ and $$$H_{2D}$$$ maps provided similar contrast, we prefer the linear metric $$$H_{1D}$$$ for computational simplicity. In this study, we explored the collinearity of IVIM parameters based on the data distribution of diffusion decay signals with various ground truth through numerical simulation. We developed a novel metric, derived as a linear or quadratic combination of individual IVIM parameters, which attains the best achievable robustness among possible combinations. The correlation of the new metric with underlying biological properties requires futher investigations.
Acknowledgements
No acknowledgement found.References
- Bihan, D. L. et al. MR imaging of intravoxel incoherent motions: application to diffusion and perfusion in neurologic disorders. Radiology 161, 401-407, doi:10.1148/radiology.161.2.3763909 (1986).
- Novikov, D. S., Kiselev, V. G. & Jespersen, S. N. On modeling. Magnet Reson Med 79, 3172-3193 (2018).
- Iima, M. & Le Bihan, D. Clinical intravoxel incoherent motion and diffusion MR imaging: past, present, and future. Radiology 278, 13-32 (2016).
- Charles, C. N. Reliability and Uncertainty in Diffusion MRI Modelling, (2016).
- Landaw, E. & DiStefano 3rd, J. Multiexponential, multicompartmental, and noncompartmental modeling. II. Data analysis and statistical considerations. American Journal of Physiology-Regulatory, Integrative and Comparative Physiology 246, R665-R677 (1984).
Figures