2592
Assessment of Low-Field 0.55T MRI for parotid gland: A Comparison with 1.5T and 3T MRI1Department of Radiology, Shanghai Ninth People’s Hospital, Shanghai JiaoTong University School of Medicine., Shang hai, China, 2MR scientific Marketing,Diagnostic Imaging, Siemens Healthineers Ltd, Shanghai, China, Shang hai, China
Synopsis
Keywords: Diffusion Analysis & Visualization, Diffusion/other diffusion imaging techniques, 0.55T MR system
Motivation: Comparing the image quality, distortion, and stability of quantitative parameters of MRI in parotid gland images across 0.55T, 1.5T, and 3T.
Goal(s): To compare the clinical performance of 0.55T magnetic resonance imaging (MRI) systems in parotid glands with 1.5T and 3T.
Approach: Evaluating image quality, distortion in DWI, and the stability and differences of quantitative parameters derived from IVIM across different field strengths.
Results: 0.55T MRI significantly reduces image distortion and maintains stable ADC values in DWI while providing comparable morphologic image quality to 1.5T. Additionally, the diffusion parameters in 0.55T showed significant differences compared to those of 1.5T and 3T.
Impact: 0.55T MRI may offer a valuable alternative with the significant altered IVIM-DKI parameters for parotid gland imagings in patients with limited conditions, maintaining image quality and stable ADC values, potentially improving the diagnostic process for certain individuals.
Introduction
Parotid tumors are the most common salivary gland tumors, comprising about 3% of all head and neck tumors, with approximately 80% being benign and 20% malignant. Functional magnetic resonance imaging (MRI) techniques, such as diffusion-weighted imaging (DWI), intravoxel incoherent motion (IVIM), and diffusion kurtosis imaging (DKI), are noninvasive methods that provide valuable insights into tumor characteristics. While MRI scans are frequently performed at 1.5T and 3T, there's growing interest in the potential of 7T MRI systems. Additionally, low-field MRI systems, equipped with advanced hardware and imaging techniques, are gaining traction for clinical applications, especially for patients with specific needs. The objective of this research is to establish parameter intervals across different MRI field strengths (0.55T, 1.5T, and 3T) and evaluate their clinical feasibility, thereby indicating the further advantages of low-field imaging for the detection of parotid tumors.Materials and Methods
Nineteen healthy volunteers underwent maxillofacial imaging using 0.55T, 1.5T, and 3T MRI machines. Scanning sequences included T2 fat-saturation (T2-FS) and diffusion imaging with various b values across the three field strengths(Table 1). Two radiologists, each with 5 and 15 years of diagnostic experience in head and neck imaging, subjectively evaluated T2-FS images using a 5-point method across five aspects in a double-blind manner. Objective image quality was assessed using signal-to-noise ratio (SNR) and contrast-to-noise ratio (CNR). The research compared the extent of parotid gland distortion in diffusion-weighted imaging (DWI), the stability, and interval range differences of apparent diffusion coefficient (ADC), and corresponding parameters obtained from intravoxel incoherent motion-diffusion kurtosis imaging (IVIM-DKI) across various field strengths. Statistical analysis and image fusion were carried out using GraphPad Prism 8.0 software and 3D slicer. Quality measurements and quantitative parameters were analyzed through one-way ANOVA. Inter-observer consistency was assessed using Spearman's coefficient correlation, and the stability of parameters was evaluated using the Bland-Altman method and coefficients of variation (CV). Differences were considered statistically significant at P<0.05.Results
T2-FS images exhibited the lowest SNR and CNR at 0.55T, with no significant differences between 0.55T and 1.5T (P>0.05) (Fig.1 and Table2). DWI distortion at 0.55T was significantly lower than at 1.5T with SS-EPI (P<0.0001), while no differences were observed in axial slices compared to RESOLVE-DWI at 3T. ADC stability was highest at 0.55T compared to 1.5T and 3T (R, CV=6.17; L, CV=6.89 vs. R, CV=8.38; L, CV=8.48 vs. R, CV=10.80; L, CV=10.20). Furthermore, parameters from different diffusion sequences at 0.55T significantly differed from those at higher field strengths (P<0.0001), except for Dt values (P>0.05) (Table 3). Dt values exhibited the highest stability across different field strengths, while Dp values were the lowest. Inter-observer agreement on morphologic image quality was good, with subjective scores showing significant differences between 0.55T and both 1.5T and 3T (p<0.0001).Discussion
Our results showed that the image quality of 0.55T with high-performance accessories is comparable to that of 1.5T in both subjective and objective assessments. Furthermore, the reduction of artifacts related to susceptibility effects is significant compared to the single-shot EPI sequence in 1.5T and comparable to the readout segmentation of long variable echo-trains diffusion weighted imaging (RESOLVE-DWI) in 3T. It is worth pointing out that the stability of ADC values measured in 0.55T was higher than that of RESOLVE-DWI in 3T. The interval range of ADC values in 0.55T had no significant difference compared with 1.5T; however, both of them were significantly higher than in 3T. Previous findings suggest that the variability in ADC values is likely influenced by both field strength, due to the noise floor effect, and anatomical sites, primarily due to tissue heterogeneities. The image noise, problem of curve fitting, sets of b values, system bias, individual differences, and different anatomical regions related to different physiologic changes can also lead to inconsistent results of measured parameter values. Thus, our results suggest that when ADC, IVIM, and DKI parameter values are used to assess a patient’s treatment response or probable outcome in parotid glands, the variability due to different field strengths imagers should be taken into account.Conclusion
The study demonstrated that 0.55T MRI significantly reduces image distortion, maintains stable ADC values in DWI, and provides image quality comparable to that of 1.5T MRI. This indicates the benefits of low field compared to higher field with higher susceptibility and distortion which would prevent the visibility and proper assessment of the parotid tumors close to sinuses and oral cavities. Additionally, caution is advised when using diffusion parameters as biomarkers for diagnosing parotid gland tumors across different field strengths, as they exhibit significant differences.Acknowledgements
NoneReferences
1. Rosenkrantz AB, Oei M, Babb JS, Niver BE, Taouli B. Diffusion-weighted imaging of the abdomen at 3.0 Tesla: image quality and apparent diffusion coefficient reproducibility compared with 1.5 Tesla. Journal of magnetic resonance imaging : JMRI 2011; 33(1): 128-135.
2. Dale BM, Braithwaite AC, Boll DT, Merkle EM. Field strength and diffusion encoding technique affect the apparent diffusion coefficient measurements in diffusion-weighted imaging of the abdomen. Investigative radiology 2010; 45(2): 104-108.
3. Campbell-Washburn AE, Ramasawmy R, Restivo MC, Bhattacharya I, Basar B, Herzka DA et al. Opportunities in Interventional and Diagnostic Imaging by Using High-Performance Low-Field-Strength MRI. Radiology 2019; 293(2): 384-393.
4. Fritzsche KH, Neher PF, Reicht I, van Bruggen T, Goch C, Reisert M et al. MITK Diffusion Imaging. Methods of Information in Medicine 2012; 51(5): 441-448.
5. Song C, Cheng P, Cheng J, Zhang Y, Sun M, Xie S et al. Differential diagnosis of nasopharyngeal carcinoma and nasopharyngeal lymphoma based on DCE-MRI and RESOLVE-DWI. Eur Radiol 2020; 30(1): 110-118. 25. Sasaki M, Yamada K, Watanabe Y, Matsui M, Ida M, Fujiwara S et al. Variability in absolute apparent diffusion coefficient values across different platforms may be substantial: a multivendor, multi-institutional comparison study. Radiology 2008; 249(2): 624-630.
6. Rao RK, Riffel P, Meyer M, Kettnaker PJ, Lemke A, Haneder S et al. Implementation of dual-source RF excitation in 3 T MR-scanners allows for nearly identical ADC values compared to 1.5 T MR scanners in the abdomen. PLoS One 2012; 7(2): e32613.
7. Lavdas I, Miquel ME, McRobbie DW, Aboagye EO. Comparison between diffusion-weighted MRI (DW-MRI) at 1.5 and 3 tesla: a phantom study. Journal of magnetic resonance imaging : JMRI 2014; 40(3): 682-690.
8. Cui Y, Dyvorne H, Besa C, Cooper N, Taouli B. IVIM Diffusion-weighted Imaging of the Liver at 3.0T: Comparison with 1.5T. European journal of radiology open 2015; 2: 123-128.
9. Barbieri S, Donati OF, Froehlich JM, Thoeny HC. Comparison of Intravoxel Incoherent Motion Parameters across MR Imagers and Field Strengths: Evaluation in Upper Abdominal Organs. Radiology 2016; 279(3): 784-794.
10. Xu XQ, Su GY, Liu J, Hu H, Hong XN, Shi HB et al. Intravoxel incoherent motion MR imaging measurements of the bilateral parotid glands at 3.0-T MR: effect of age, gender and laterality in healthy adults. The British journal of radiology 2015; 88(1056): 20150646.
Figures
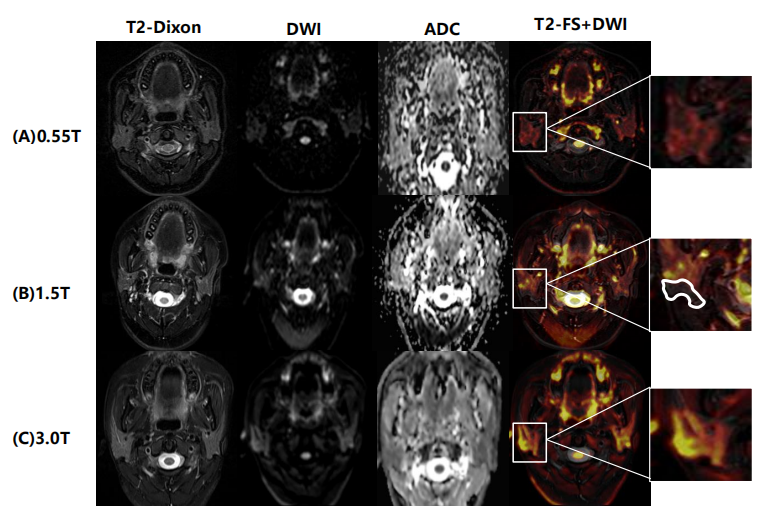
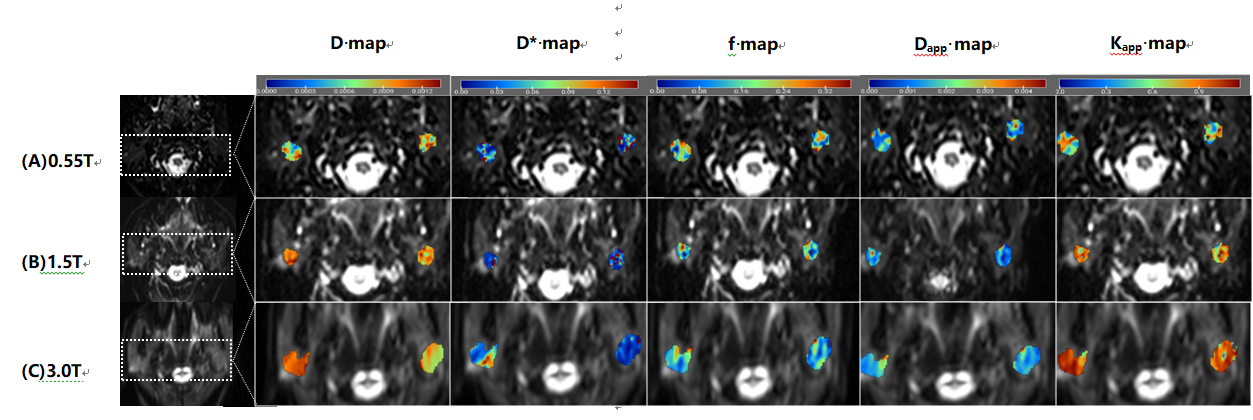
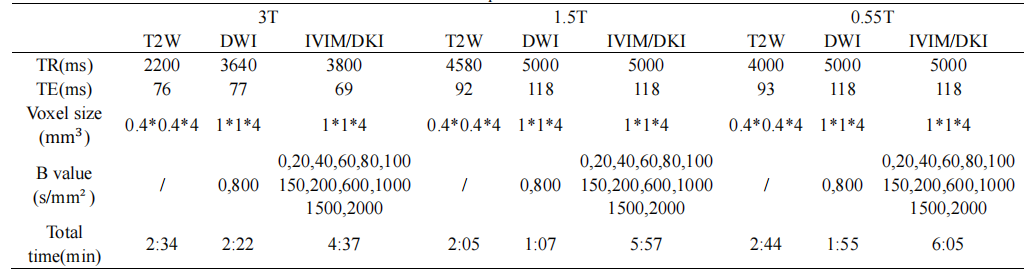
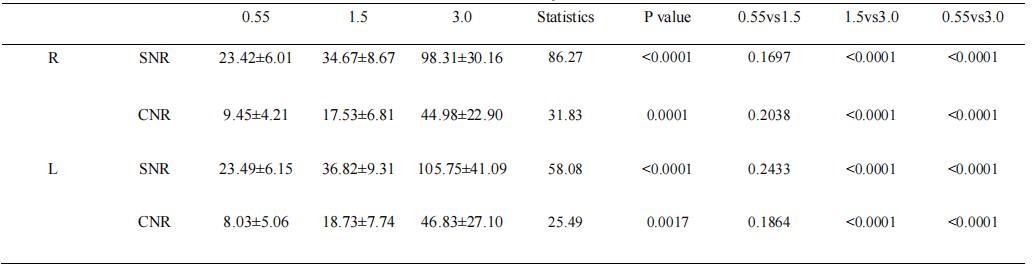
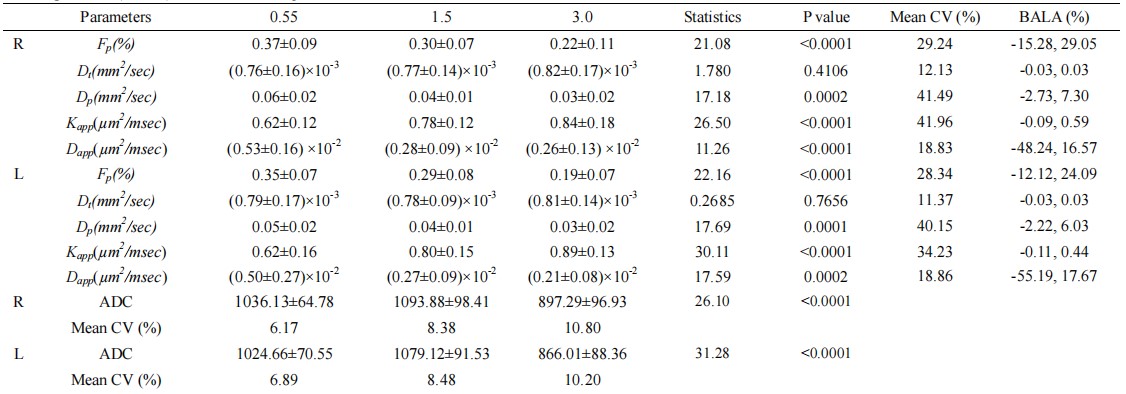
Table 3. The stability of ADC, as well as IVIM and DKI parameters at 0.55T, 1.5 T and 3.0 T with coefficients of variation (CVs) and Bland–Altman limits of agreement (BALA) between the three platforms
*R, right side of parotid gland; L, left side of parotid gland