2587
Effect of tissues T1 content on the ADC values obtained with breast DWI using STIR fat-suppression1NeuroSpin/Joliot, CEA-Saclay, Paris-Saclay University, Gif/Yvette, France, 2Radiology, Kyoto Prefectural University of Medicine, Kyoto, Japan, 3Diagnostic Imaging and Nuclear Medicine, Kyoto University Graduate School of Medicine, Kyoto, Japan, 4Institute for Advancement of Clinical and Translational Science, Kyoto University Hospital, Kyoto, Japan, 5Radiology, University of Washington School of Medicine, Seattle, WA, United States, 6Breast Imaging, Seattle Cancer Care Alliance, Seattle, WA, United States, 7Radiology, Dokkyo Medical University Saitama Medical Center, Saitama, Japan, 8Radiology, Nagoya University Graduate School of Medicine, Nagoya, Japan
Synopsis
Keywords: Simulation/Validation, Diffusion/other diffusion imaging techniques, Fat suppression
Motivation: Fat signal suppression is essential for breast DWI as the very low diffusion coefficient of fat tends to decrease ADC values. STIR is a popular method, but signal suppression/attenuation is not specific to fat.
Goal(s): To show how ADC values obtained with STIR DWI may be biased toward tissue components with long T1s.
Approach: Results were obtained from simulations and data acquired in a dedicated breast DWI phantom made of vials with water and various concentration of PVP.
Results: ADC values obtained with STIR fat suppression may be over/under estimated depending on the T1 and ADC profile within tissues.
Impact: Fat suppression is essential for DWI. Among techniques STIR leads to low SNR and ADC misestimation depending on the tissues T1/ADC content, as STIR signal attenuation is not specific to fat. Other methods should be preferred, such as SPAIR.
Introduction
Fat signal suppression is essential for breast diffusion MRI (DWI): As fat has a very low diffusion coefficient the insufficient suppression of fat signals tends to decrease ADC values, potentially leading to false positive interpretation, as low ADC values often mean malignancies. STIR (Short Tau Inversion Recovery) and SPAIR (Spectral Adiabatic Inversion Recovery) are popular methods1-3. STIR relies on the use of a short inversion time (TI) designed to null out the signal from fat which has a short T1 value. However, the STIR signal attenuation is not specific to fat, hence all tissue components exhibit a signal attenuation, depending on their T1 value (Fig.1). We investigated the impact of this effect on the ADC values obtained with STIR.Materials & Methods
Simulations were conducted to mimic signals of breast lesions components (T1=[700-2000ms], ADC=[0.7-2.0E-3mm²/s] within fibroglandular tissue (FGT) (T1=1300ms, ADC=1.6E-3mm²/s). Signals were calculated at b=0 and 800s/mm² as:S(b=0,800)= [FS .g(T1,T2).exp(-b.ADC)]
FS=|(1-2exp(-TI/T1)| for STIR (TI=200ms), FS=1 for SPAIR. g(T1,T2) is the T1/T2 weighting for a spin-echo sequence. The ADC corresponds to the value obtained at b=800s/mm² taking non-Gaussian diffusion into account4. To mimic a heterogeneous, multi-component lesion, signals Si(0) and Si(800) from several components, i, were added:
S(b=0,800)=∑ i [fi .S i(b=0,800)]
where fi is the component fraction. The multicomponent ADC was obtained from the composite signals as ln(S(b=0)/S(b=800))/800.
Phantom Study
DWI data were acquired at 3T (Achieva, Philips) on a breast DWI phantom unit (Model 206, CaliberMRI Inc, Boulder, CO, United States5) consisting of tubes containing water, FGT and fat mimic (resulting in T1fgt=1219ms T1fat=296ms), and different concentrations of polyvinylpyrrolidone (PVP), ranging from 10% to 40%. Single-shot EPI was achieved using b values of 0 and 800 s/mm2. Fat suppression was performed using SPAIR and STIR with TI values of 200ms (optimal value at 3T) and 300ms. All the other protocol parameters were set according to the ACRIN 6698 study6.
Results
Simulations: Overall absolute STIR signals were always lower than SPAIR signals. At b=800s/mm² due to the combination of T1 and diffusion effects, STIR signals relative to FGT signal appeared higher than with SPAIR for tissues with long T1 and low ADC values, but lower for tissues with short T1 and high ADC values (Fig.2 left). The STIR ADC from heterogenous tissues was under- or overestimated compared to the ground truth ADC, biased towards the ADC from tissue components with the longest T1s (Fig.2 right).Phantom experiments: T1 values and ADC values measured in the phantom are given in Table 1 (Fig.3). While SPAIR and STIR ADC values were similar in isolated vials, STIR ADC values were significantly greater (overestimation) when combining signals from vials mimicking heterogenous multicomponent tissue (Fig.3&4). In breast malignant lesions (long T1, low ADC) the overall effect would be opposite (ADC underestimation with STIR).
Signal level (and resulting SNR) was globally lower with STIR than SPAIR, with a sharp drop in SNR for the vials with shorter T1s (Fig.5 Left). Contrast was flattened out in STIR DWI images as diffusion effects (higher signal for low diffusion) were offset by T1 effects (lower signal for short T1) (Fig.5 Right). In breast malignant lesions with long T1 and low ADC the overall effect would be opposite (lesions appearing as brighter due to combined T1 and diffusion effects).
Discussion
Overall, STIR signals are lower, leading to a loss in SNR, signal amplitudes being more reduced for tissues with short T1s.This feature may be beneficial for clinical qualitative DWI, because malignant lesions often exhibit long T1 and low ADC values, thus appearing brighter than background than with SPAIR on images acquired at high b values, as exploited by the DWIBS method7. However, quantitative ADC values obtained from heterogeneous lesions with distributed ADC and T1 values will be biased toward the ADC values of the components with the longest T1s, misleading lesion classification based on ADC thresholds8. A very challenging situation will occur when acquiring STIR/DWI data after the administration of a Gadolinium-based contrast agent, resulting for malignant lesions in a decrease in visibility (similar to PVP40 in Fig.5), due to a sharp T1 decrease associated to contrast enhancement and in a large ADC overestimation, thus mimicking benign lesions.Conclusion
Fat-specific methods should be preferred over STIR for fat signal suppression in breast DWI, such as SPAIR which also provides a higher sensitivity than STIR for lesion detection3. SPAIR has been recommended by EUSOBI8 , QIBA/RSNA9, and the Korean Radiological Society10. One should remain aware, however, that efficient fat signal suppression with SPAIR requires good B0 shimming to avoid ADC underestimation from residual fat contamination.Acknowledgements
We gratefully appreciate the cooperation of the following official J-QIBA members of Japan Radiological Society (JRS), Shigeki Aoki, MD, PhD, Ukihide Tateishi, MD, PhD, Noriyuki Tomiyama, MD, PhD, Takashi Yoshiura, MD, PhD, Kei Yamada, MD, PhD, Kosuke Kudo, MD, PhD, and Toshinori Hirai, MD, PhD. We have also been given helpful suggestions by Timothy J Hall, PhD, Gudrun Zahlmann, MD, PhD, and Chung Caroline, MD, PhD, Steering Committee, Quantitative Imaging Biomarkers Alliance (QIBA), Radiological Society of North America (RSNA).References
1-Chen Lin et al. Fat suppression techniques in breast magnetic resonance imaging: a critical comparison and state of the art. Reports in Medical Imaging (2015) 8 37-49
2-Brandão, Sofia, Luísa Nogueira, Eduarda Matos, Rita Gouveia Nunes, Hugo Alexandre Ferreira, Joana Loureiro, and Isabel Ramos. Fat Suppression Techniques (STIR vs. SPAIR) on Diffusion-Weighted Imaging of Breast Lesions at 3.0 T: Preliminary Experience. La Radiologia Medica (2015) 120 (8): 705–13. .
3-Nogueira, Luisa, Sofia Brandão, Rita G. Nunes, Hugo Alexandre Ferreira, Joana Loureiro, and Isabel Ramos. Breast DWI at 3 T: Influence of the Fat-Suppression Technique on Image Quality and Diagnostic Performance. Clinical Radiology (2015) 70 (3): 286–94.
4- Iima M, Le Bihan D. Clinical Intravoxel Incoherent Motion and Diffusion MR Imaging: Past, Present, and Future. Radiology (2016) 278:13–32
5-Keenan, Kathryn E., Lisa J. Wilmes, Sheye O. Aliu, David C. Newitt, Ella F. Jones, Michael A. Boss, Karl F. Stupic, Stephen E. Russek, and Nola M. Hylton. Design of a Breast Phantom for Quantitative MRI. Journal of Magnetic Resonance Imaging: JMRI (2016) 44 (3): 610–19.
6-Newitt, D. C., Z. Zhang, J. E. Gibbs, S. C. Partridge, T. L. Chenevert, M. A. Rosen, P. J. Bolan, et al. Test-Retest Repeatability and Reproducibility of ADC Measures by Breast DWI: Results from the ACRIN 6698 Trial. Journal of Magnetic Resonance Imaging: JMRI (2019) 49 (6): 1617–28.
7-Takahara T, et al. Diffusion weighted whole body imaging with background body signal suppression (DWIBS): technical improvement using free breathing, STIR and high resolution 3D display. Radiat Med. (2004) 22(4):275-82.
8-Baltzer, Pascal, Ritse M. Mann, Mami Iima, Eric E. Sigmund, Paola Clauser, Fiona J. Gilbert, Laura Martincich, et al. Diffusion-Weighted Imaging of the Breast-a Consensus and Mission Statement from the EUSOBI International Breast Diffusion-Weighted Imaging Working Group. European Radiology (2020) 30 (3): 1436–50.
9-QIBA DWI Profile. https://qibawiki.rsna.org/images/1/1d/QIBADWIProfilev1.45_20170427_v5_accepted.pdf
10-Lee, Su Hyun, Hee Jung Shin, and Woo Kyung Moon. Diffusion-Weighted Magnetic Resonance Imaging of the Breast: Standardization of Image Acquisition and Interpretation. Korean Journal of Radiology. (2020) https://doi.org/10.3348/kjr.2020.0093
Figures
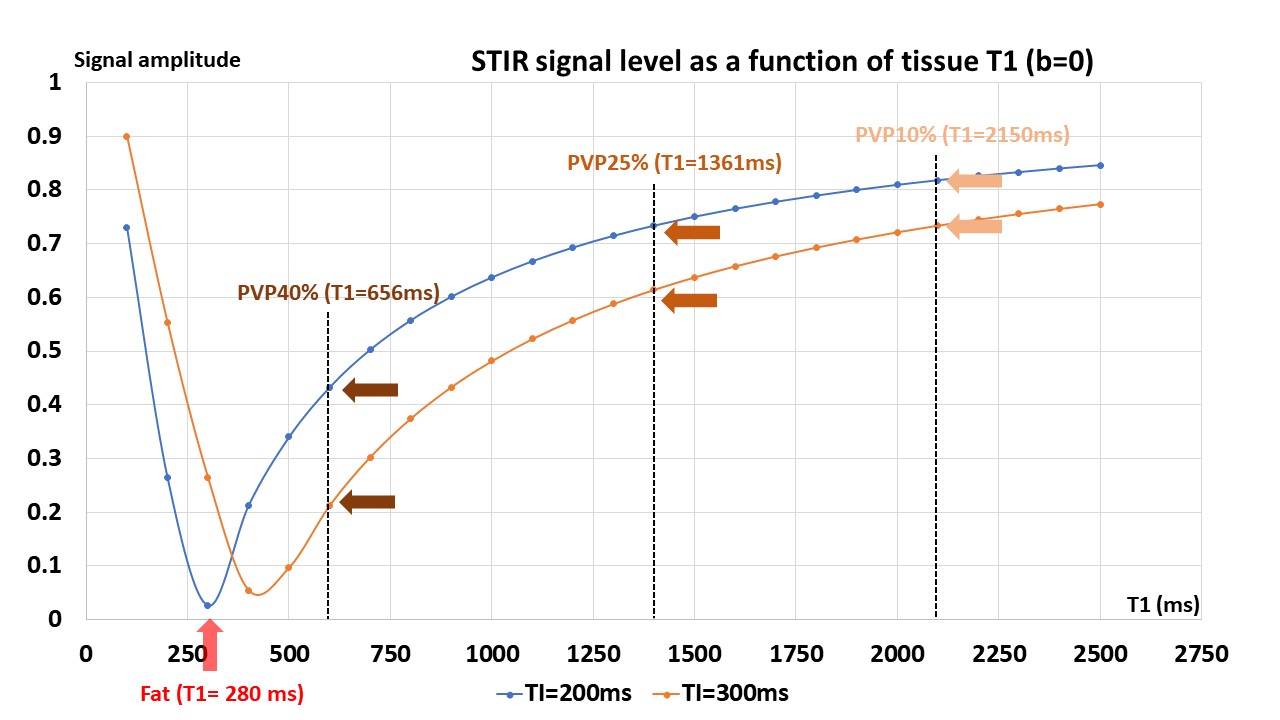
Figure 1: Remaining signal after the 180° RF inversion pulse of the STIR sequence.
Raw signal levels (b=0) were simulated for the PVP phantom vials (Table 1 in Fig.3) using 2 TI values to illustrate the respective effects of the inversion time (TI) and T1. Taking T1fat=280ms as an example, the optimal TI for fat suppression is 200ms. With TI=200ms the residual signals are 47.4%, 72.5% and 82.2%, respectively, for PVP40%, PVP25% and PVP10%.
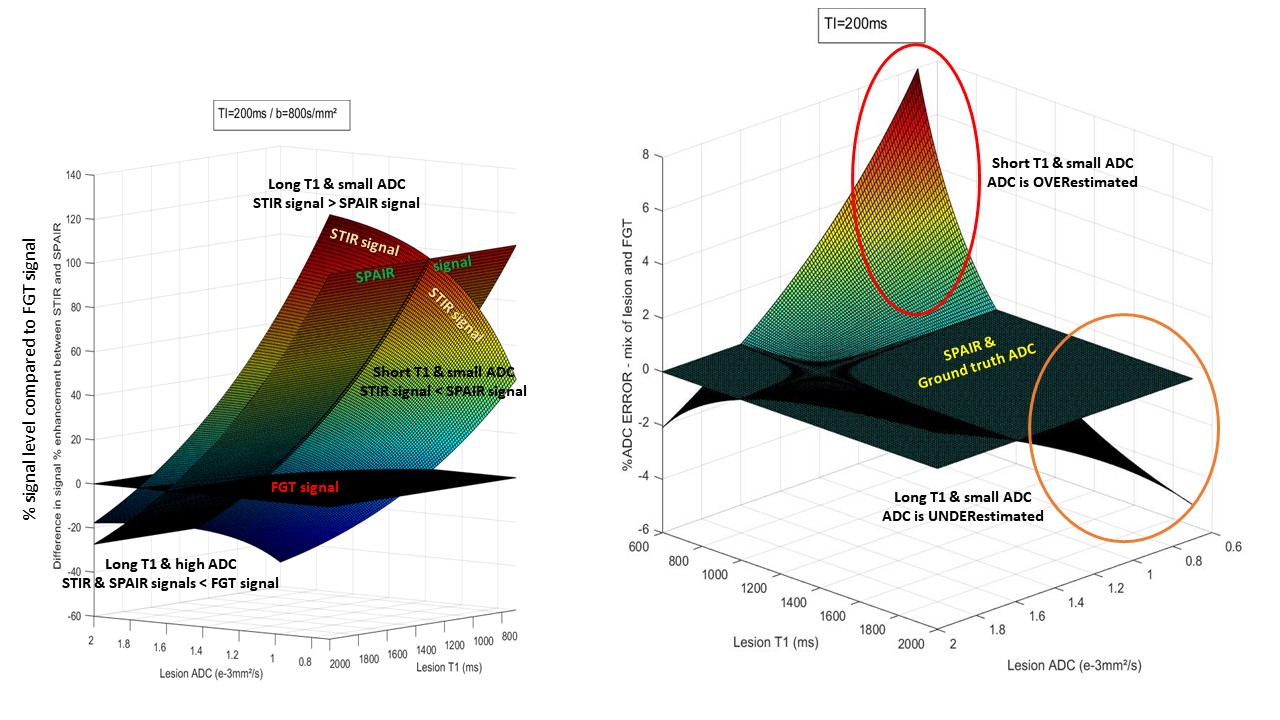
Figure 2: Left: STIR and SPAIR signals over FGT (b=800s/mm²); right: ADC error for STIR compared to ground truth and SPAIR ADC.
Left: Lesions with low ADC appear brighter (more visible) over background FGT with STIR if T1 is long, but brighter with SPAIR if T1 is short. Lesions with high ADC will appear darker than FGT. Right: the resulting ADC of a heterogeneous lesion with low ADC including 50% FGT is overestimated for lesions with short T1 and underestimated for lesions with long T1.
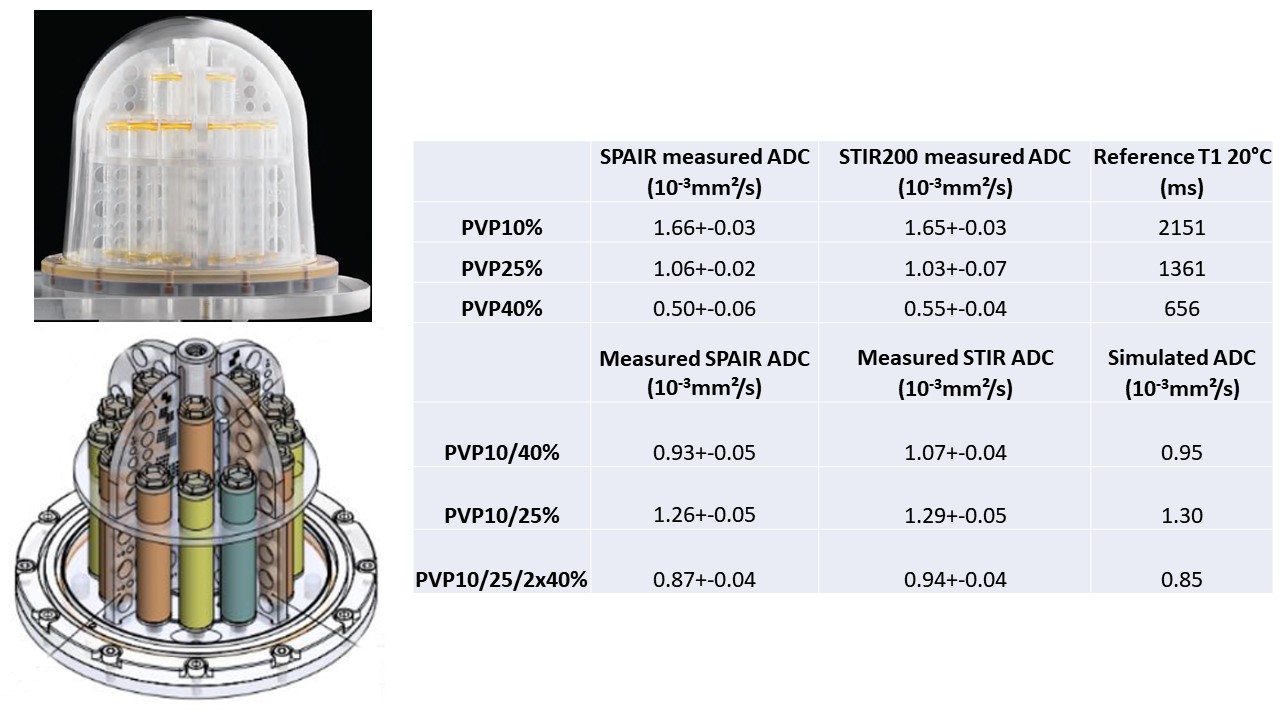
Figure 3 (Table 1): Measured phantom ADC values.
Left: DWI breast phantom from CaliberMRI, Inc
Right: The T1 values are from the manufacturer model documentation. The simulated ADC values were calculated from simulated signals using the vials T1 and ADC values, each vial contributing equally (e.g, 50% fraction each for PVP10 and PVP40 for the PVP10/40 mix, 25% each for PVP10, PVP25 and 50% for PVP40 for the PVP10/25/2x40 mix).
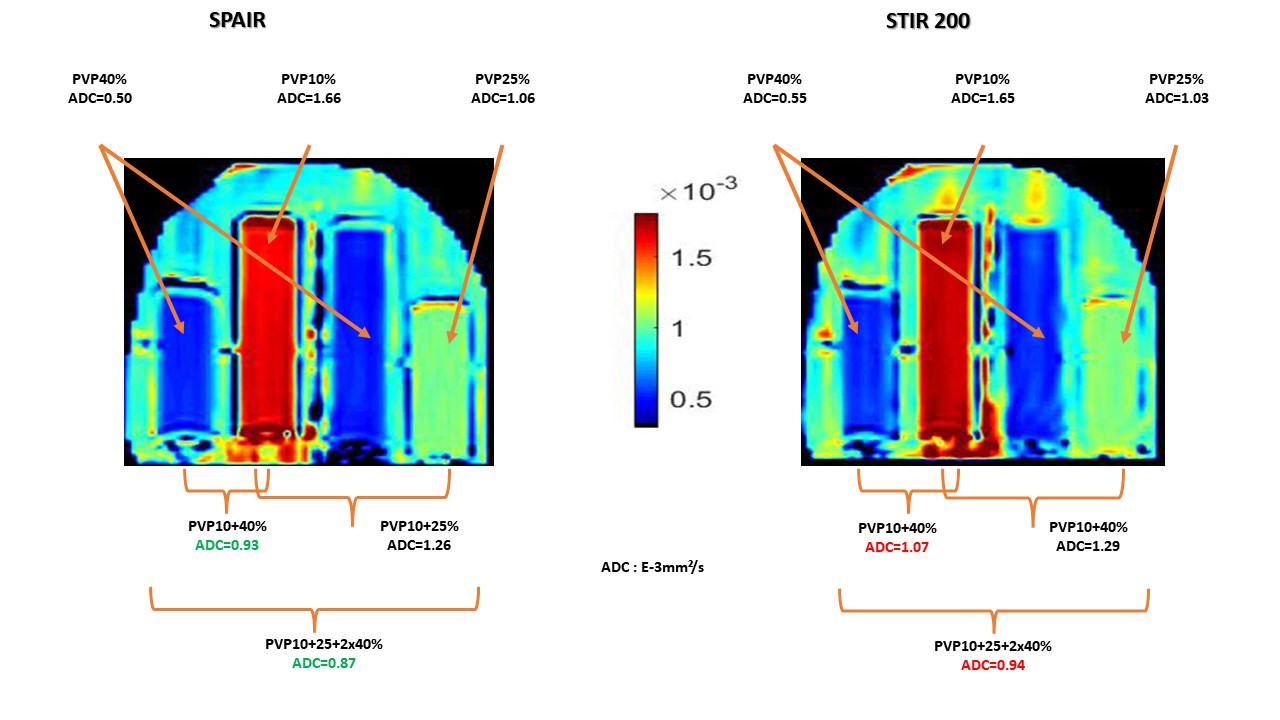
Figure 4: Phantom ADC maps obtained using SPAIR and STIR (TI=200ms).
In homogeneous vials ADC values obtained with SPAIR and STIR are comparable. However, when vial contents are mixed ADC values become overestimated with STIR, depending on the respective T1 and ADC values of mixed vials. In tissues where low ADC values would be associated long T1s the STIR ADC values would be underestimated.
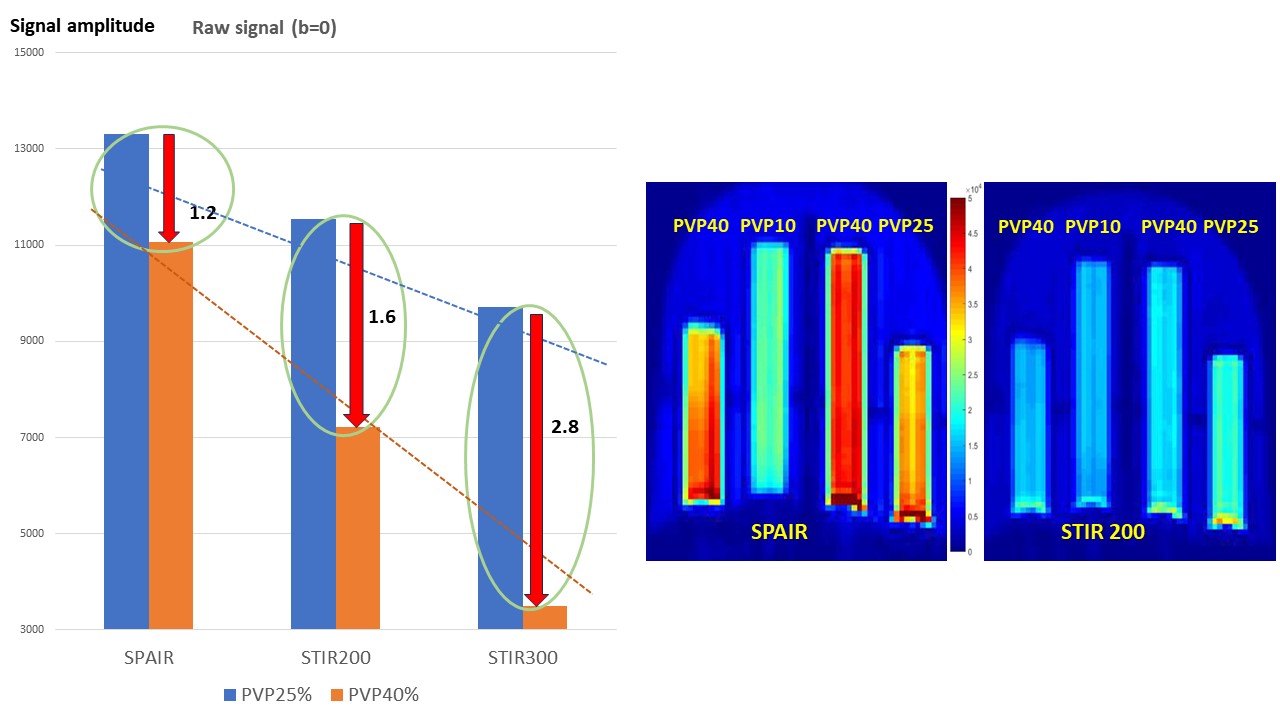
Figure 5: Left: Signal level at b=0; Right: SPAIR and STIR DWI images at b=800s/mm² (same scale).
Left: The residual signal with STIR is deeply reduced compared to SPAIR according to the TI/T1 ratio of the vials. Right: At b=800s/mm² the contrast between vials is flattened out because of the combined effect of T1 (reduced signal for short T1 components) and diffusion (reduced signal for high diffusion). Note that in a breast malignant lesion (long T1 and reduced diffusion and long T1) the aspect will be opposite, the lesion appearing as brighter.