2585
Estimating pathologic prognostic factors in epithelial ovarian cancers using apparent diffusion coefficients from functional tumour burden1The First Central Clinical School, Tianjin Medical University, Tianjin, China, Tianjin, China, 2Department of Radiology, Tianjin First Central Hospital, School of Medicine, Nankai University, Tianjin, China, Tianjin, China, 3School of Medicine, Nankai University, Tianjin, China, Tianjin, China
Synopsis
Keywords: Diffusion Analysis & Visualization, Cancer
Motivation: EOC is highly heterogeneous, meaning the average ADC value of the total tumor cannot reflect its internal components, which vary based on pathology.
Goal(s): This study sought to assess the utility of ADC values from total and functional tumor burdens to determine pathologic prognostic factors in EOC.
Approach: Using k-means clustering to divide the tumor into 2 clusters based on their ADC values, the low ADC cluster was considered to be high cellular. Furthermore, minimum, maximum and average ADC values of functional tumor were calculated.
Results: ADC values derived from functional tumor could be used to assess preoperative prognostic factors in EOC.
Impact: ADC values derived from functional tumor could be used to assess preoperative prognostic factors in EOC.
Introduction
EOC, a fatal gynecological cancer, is heavily influenced by poor differentiation, lymph node metastasis, high-risk molecular features, and tumor cell proliferation. Earlier studies have investigated using the average of ADC values to differentiate ovarian tumors, however, this calculation is only done on a single slice, potentially introducing sampling bias and differences in ROI selection between observers. Due to the size and complexity of ovarian masses, mean ADC values can mask some heterogeneous information. Functional tumor burdens could provide additional information about ovarian carcinomas and better reflect the heterogeneity of these tumors. The purpose of this study was to evaluate prognostic factors in EOC through the ADC value of the total and functional tumor burden.Method
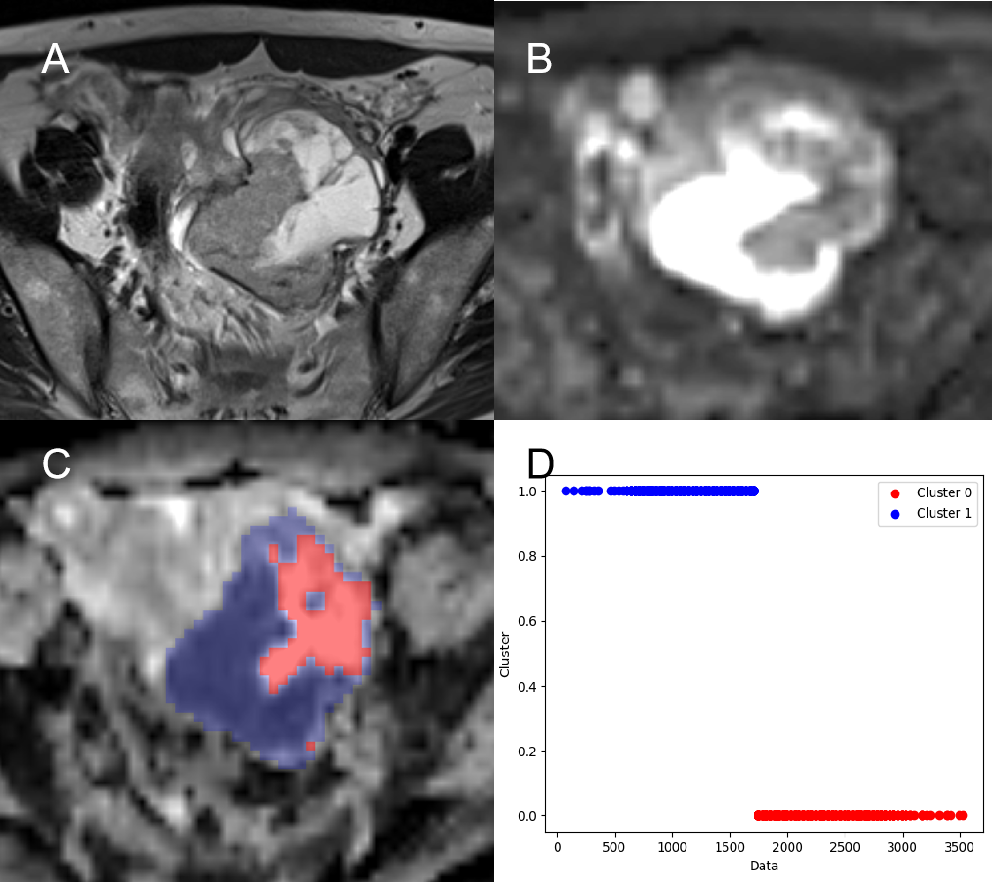
A total of 155 consecutive patients had diagnoses of EOC confirmed via postoperative pathology between January 2017 and August 2022 were enrolled in the study. The inclusion criteria were to have undergone preoperative MRI examination including DWI. The exclusion criteria were as follows: (1) insufficient image quality due to motion artefacts; (2) recurrent or metastatic lesions; (3) received radiotherapy, chemotherapy or other treatment prior to MRI examination. A 3T MR scanner was used for the MR examination (Siemens Healthcare, Erlangen, Germany). Conventional imaging protocols were as follows: axial T1 TSE (TR/TE 630/11ms, FOV 32 × 32 cm, matrix 320 × 224), and axial, sagittal, and coronal T2 fat-suppressed TSE (TR/TE 4064–4381/90–101 ms, FOV 22 × 22 cm, matrix 288 × 288). Axial DWI was performed using a single-shot EPI sequence(TR/TE 2290/62 ms, FOV 34 × 34 cm, matrix 160 × 160, parallel imaging factor 2). ADC maps were generated using the images of two b factors (0 and 1000 s/mm2). DICOM data of ADC maps were imported into the FireVoxel software (build 427, https://firevoxel.org/). Two radiologists reviewed the T2WI and DWI images and determined the location of the tumor. The volumes of interest (VOIs) were drawn strictly to include the entirety of the tumors on all slices. The minimum, maximum and average ADC values of total tumor and total tumor volume (TTV) were calculated. The VOIs were segmented into 2 clusters based on their ADC values using k-means clustering. The high ADC cluster was considered cystic tissues. The low ADC cluster was regarded as solid tumor component with high cellular. The minimum, maximum and average ADC values of functional tumor and functional tumor volume (FTV) were calculated (Fig. 1). Cases were divided into lymph node positive (LN+) and lymph node negative (LN-) groups based on the presence or absence of lymph node metastasis. The ki-67 index was divided into high and low proliferation groups using a 20% cut-off. Expression of p53 was categorized as wild-type (wt-p53) or mutant (mu-p53) based on whether the expression was focal or diffuse and strongly nuclear or completely absent, respectively. The ADC values and volumes were averaged between the two radiologists. Student’s t tests and Mann-Whitney U test were used to compare statistical difference in different groups. Univariate and multivariate logistic regression analyses were sequentially performed among ADC values and volumes to screen out the independent risk factors for histology type, LNM, ki-67 index and p53 expression. Optimal cutoffs for each ADC parameter were determined at points that maximized Youden’s J index based on receiver operating characteristic (ROC) curves. P < 0.05 represents statistical significance.Result
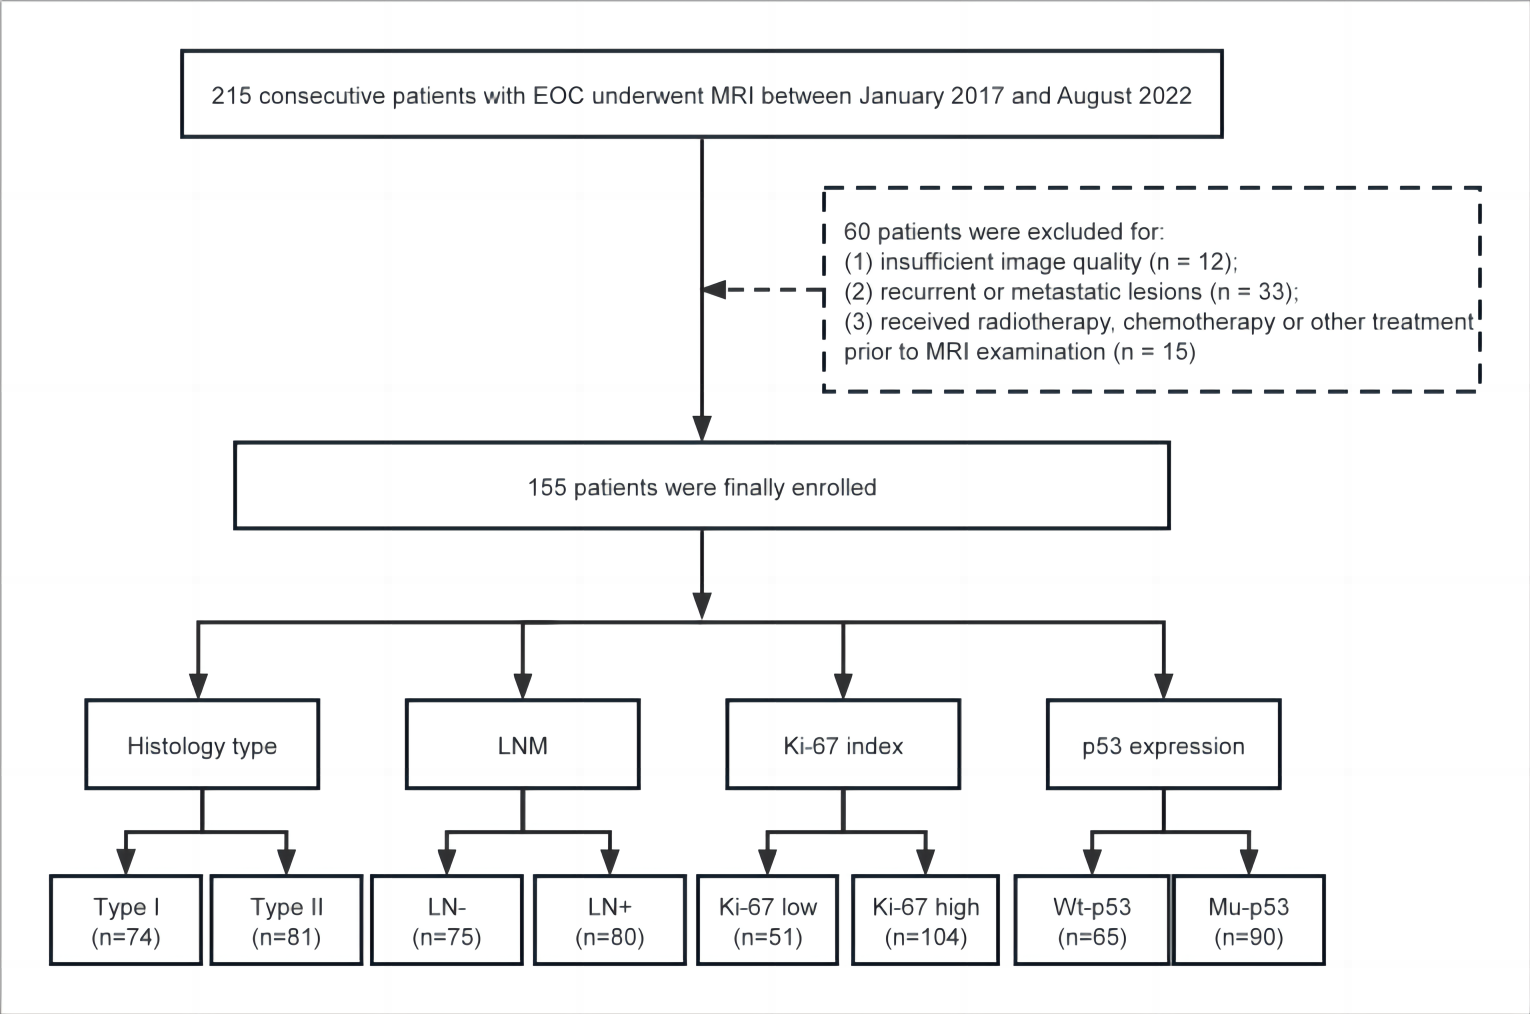
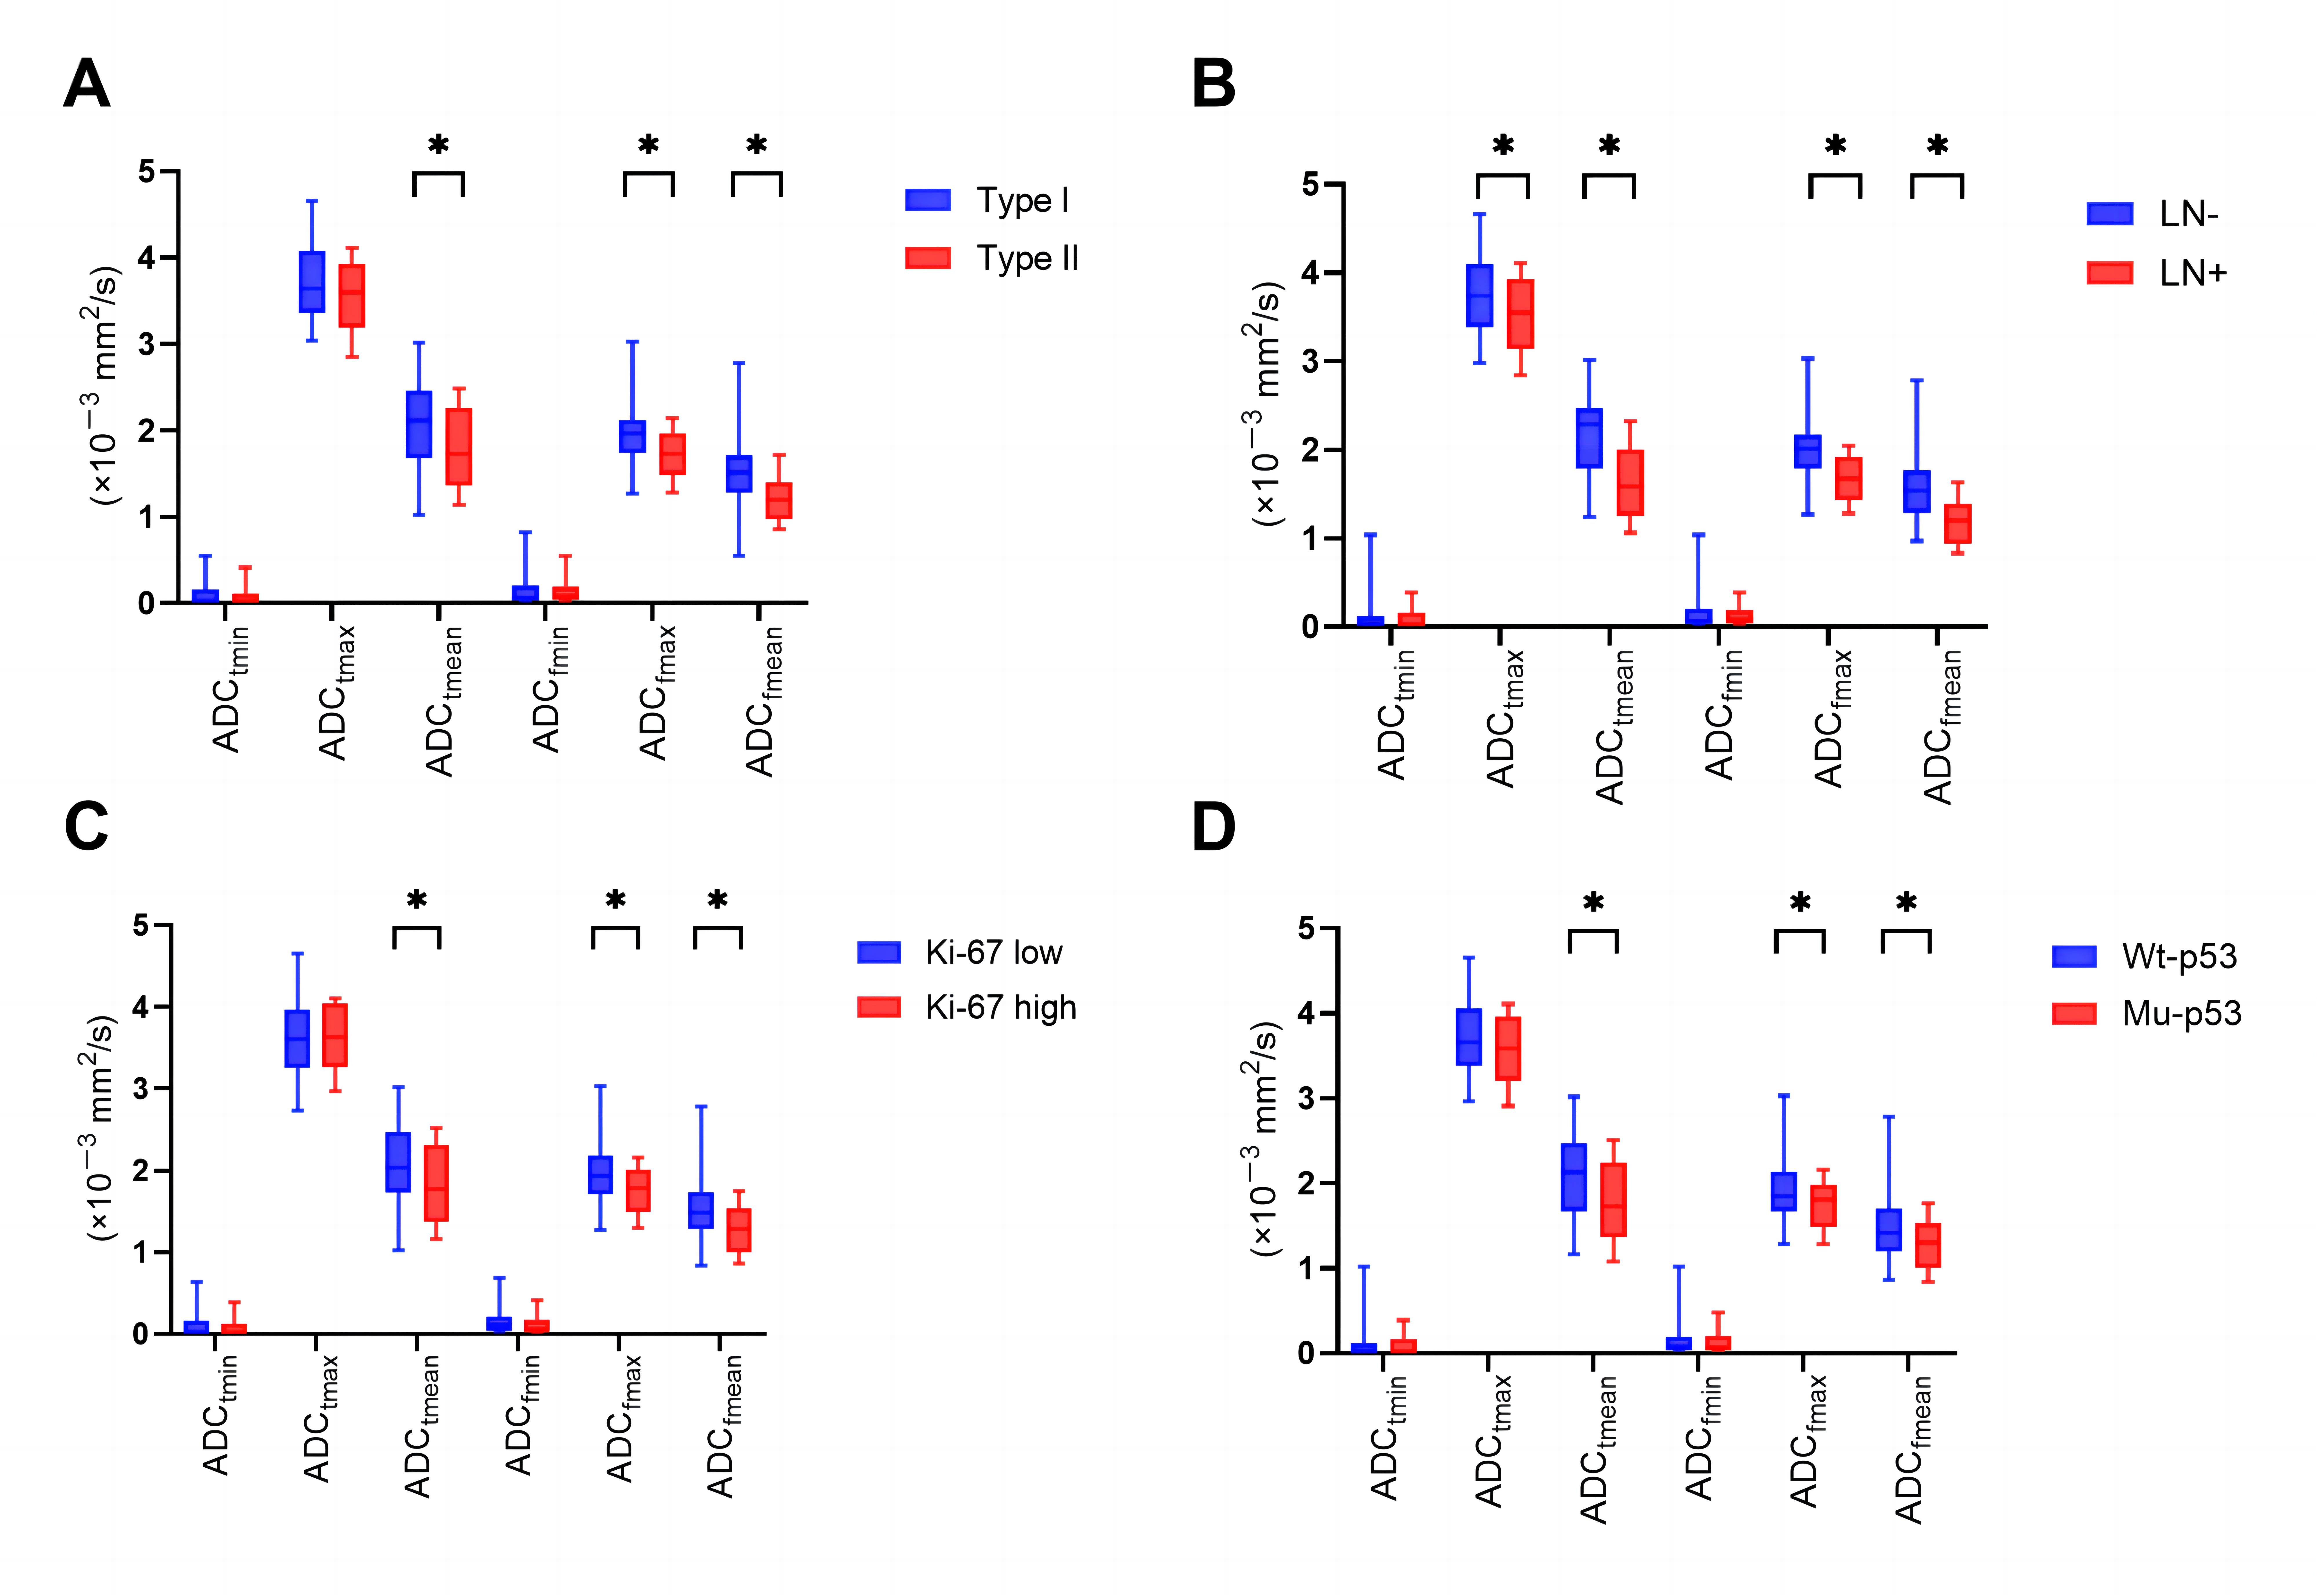
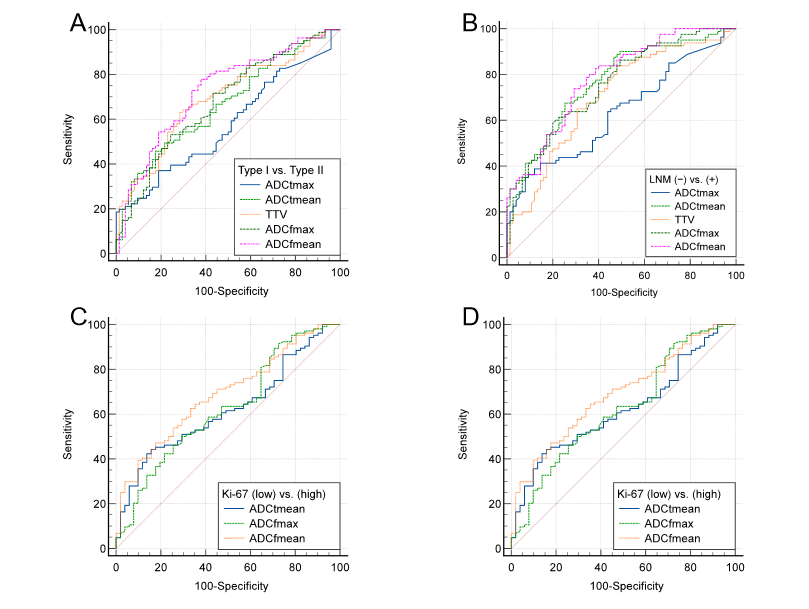
The remaining 155 patients constituted the population of the current study (Fig. 2). The results of correlations between prognostic factors and ADC parameters are shown in Fig. 3. The univariate and multivariate logistic regression results for screening out the independent risk factors for prognosis are summarized in table 1. ADCfmean was independent risk factor for histology type, LNM and Ki-67 index (odds ratio [OR] with 95% confidence interval [CI], 0.031 [95% CI: 0.002–0.522], 0.016 [95% CI: 0.001–0.327], and 0.015 [95% CI: 0.001–0.213]; p = 0.016, 0.007 and 0.002, respectively). ADCtmean was independent risk factors for predicting p53 expression (OR with 95% CI, 0.120 [95% CI: 0.024–0.607]; p = 0.010). Diagnostic performance for ADC parameters and volumes in discrimination of pathologic characteristics of epithelial ovarian cancer are shown in Fig. 4.Conclusion
ADC values derived from functional tumor could be used to assess preoperative prognostic factors in EOC. Among all kinds of ADC parameters, the ADCfmean holds potential as a useful indicator for assessing prognostic factors. However, it should be noted that the ADC values derived from the total tumor were found to be less reliable.Acknowledgements
We sincerely thank the participants in this study.
References
[1] Mimura R, Kato F, Tha KK, Kudo K, Konno Y, Oyama-Manabe N, et al. Comparison between borderline ovarian tumors and carcinomas using semi-automated histogram analysis of diffusion-weighted imaging: focusing on solid components. Jpn J Radiol. 2016 Mar;34(3):229–37.
[2] Li HM, Zhang R, Gu WY, Zhao SH, Lu N, Zhang GF, et al. Whole solid tumour volume histogram analysis of the apparent diffusion coefficient for differentiating high-grade from low-grade serous ovarian carcinoma: correlation with Ki-67 proliferation status. Clinical Radiology. 2019 Dec;74(12):918–25.
[3] Wang F, Wang Y, Zhou Y, Liu C, Liang D, Xie L, et al. Apparent Diffusion Coefficient Histogram Analysis for Assessing Tumor Staging and Detection of Lymph Node Metastasis in Epithelial Ovarian Cancer: Correlation with p53 and Ki-67 Expression. Mol Imaging Biol. 2019 Aug;21(4):731–9.
[4] Yuan Y, Chen X li, Li Z lin, Chen G wen, Liu H, Liu YS, et al. The application of apparent diffusion coefficients derived from intratumoral and peritumoral zones for assessing pathologic prognostic factors in rectal cancer. Eur Radiol. 2022 Aug 1;32(8):5106–18.
[5] P D, L GD, M HR, W S, K C. The Value of Magnetic Resonance Diffusion-Weighted Imaging and Dynamic Contrast Enhancement in the Diagnosis and Prognosis of Treatment Response in Patients with Epithelial Serous Ovarian Cancer. Cancers [Internet]. 2022 May 17 [cited 2022 Nov 23];14(10). Available from: https://pubmed.ncbi.nlm.nih.gov/35626067/
[6] Mokry T, Mlynarska-Bujny A, Kuder TA, Hasse FC, Hog R, Wallwiener M, et al. Ultra-High- b -Value Kurtosis Imaging for Noninvasive Tissue Characterization of Ovarian Lesions. Radiology. 2020 Aug;296(2):358–69.
[7] An H, Perucho JAU, Chiu KWH, Hui ES, Chu MMY, Ngu SF, et al. Association between High Diffusion-Weighted Imaging-Derived Functional Tumor Burden of Peritoneal Carcinomatosis and Overall Survival in Patients with Advanced Ovarian Carcinoma. Korean J Radiol. 2022 May;23(5):539–47.
[8] Lee EYP, An H, Perucho JAU, Chiu KWH, Hui ES, Chu MMY, et al. Functional tumour burden of peritoneal carcinomatosis derived from DWI could predict incomplete tumour debulking in advanced ovarian carcinoma. Eur Radiol. 2020 Oct 1;30(10):5551–9.
[9] Gong NJ, Wong CS, Chu YC, Guo H, Huang B, Chan Q. Increasing the Accuracy of Volume and ADC Delineation for Heterogeneous Tumor on Diffusion-Weighted MRI: Correlation with PET/CT. International Journal of Radiation Oncology*Biology*Physics. 2013 Oct;87(2):407–13.
[10] Wu Q, Xu X. Combining Diffusion-Weighted Imaging and T2-Weighted Imaging to Delineate Tumorous Tissue in Peritoneal Carcinomatosis: A Comparative Study with 18F-Fluoro-Deoxyglucose Positron Emission Tomography with Computed Tomography (FDG PET/CT). Med Sci Monit [Internet]. 2022 Feb 3 [cited 2023 Feb 16];28. Available from: https://www.medscimonit.com/abstract/index/idArt/934664
[11] Rundo L, Beer L, Ursprung S, Martin-Gonzalez P, Markowetz F, Brenton JD, et al. Tissue-specific and interpretable sub-segmentation of whole tumour burden on CT images by unsupervised fuzzy clustering. Computers in Biology and Medicine. 2020 May 1;120:103751.
Figures