2577
APTWI and stretch-exponential model DWI based 18F-FDG PET/MRI for differentiation of benign and malignant solitary pulmonary lesions1Henan Provincial People’s Hospital, zhengzhou, China, 2Central Research Institute, United Imaging Healthcare Group, Shanghai, China, 3Beijing United Imaging Research Institute of Intelligent Imaging, Beijing, China
Synopsis
Keywords: IVIM, Lung
Motivation: Although most solitary pulmonary lesions (SPLs) are eventually determined to be benign, early differentiation between benign and malignant lesions remains crucial for effective patient management.
Goal(s): This study aimed to perform simultaneous chest 18F-FDG PET, APTWI, MEM-DWI, and SEM-DWI scans in patients with SPLs to compare the differences in each parameter between the benign and malignant groups.
Approach: The AUC was used to assess diagnostic efficacy. The Logistic regression analysis was used to identify independent predictors.
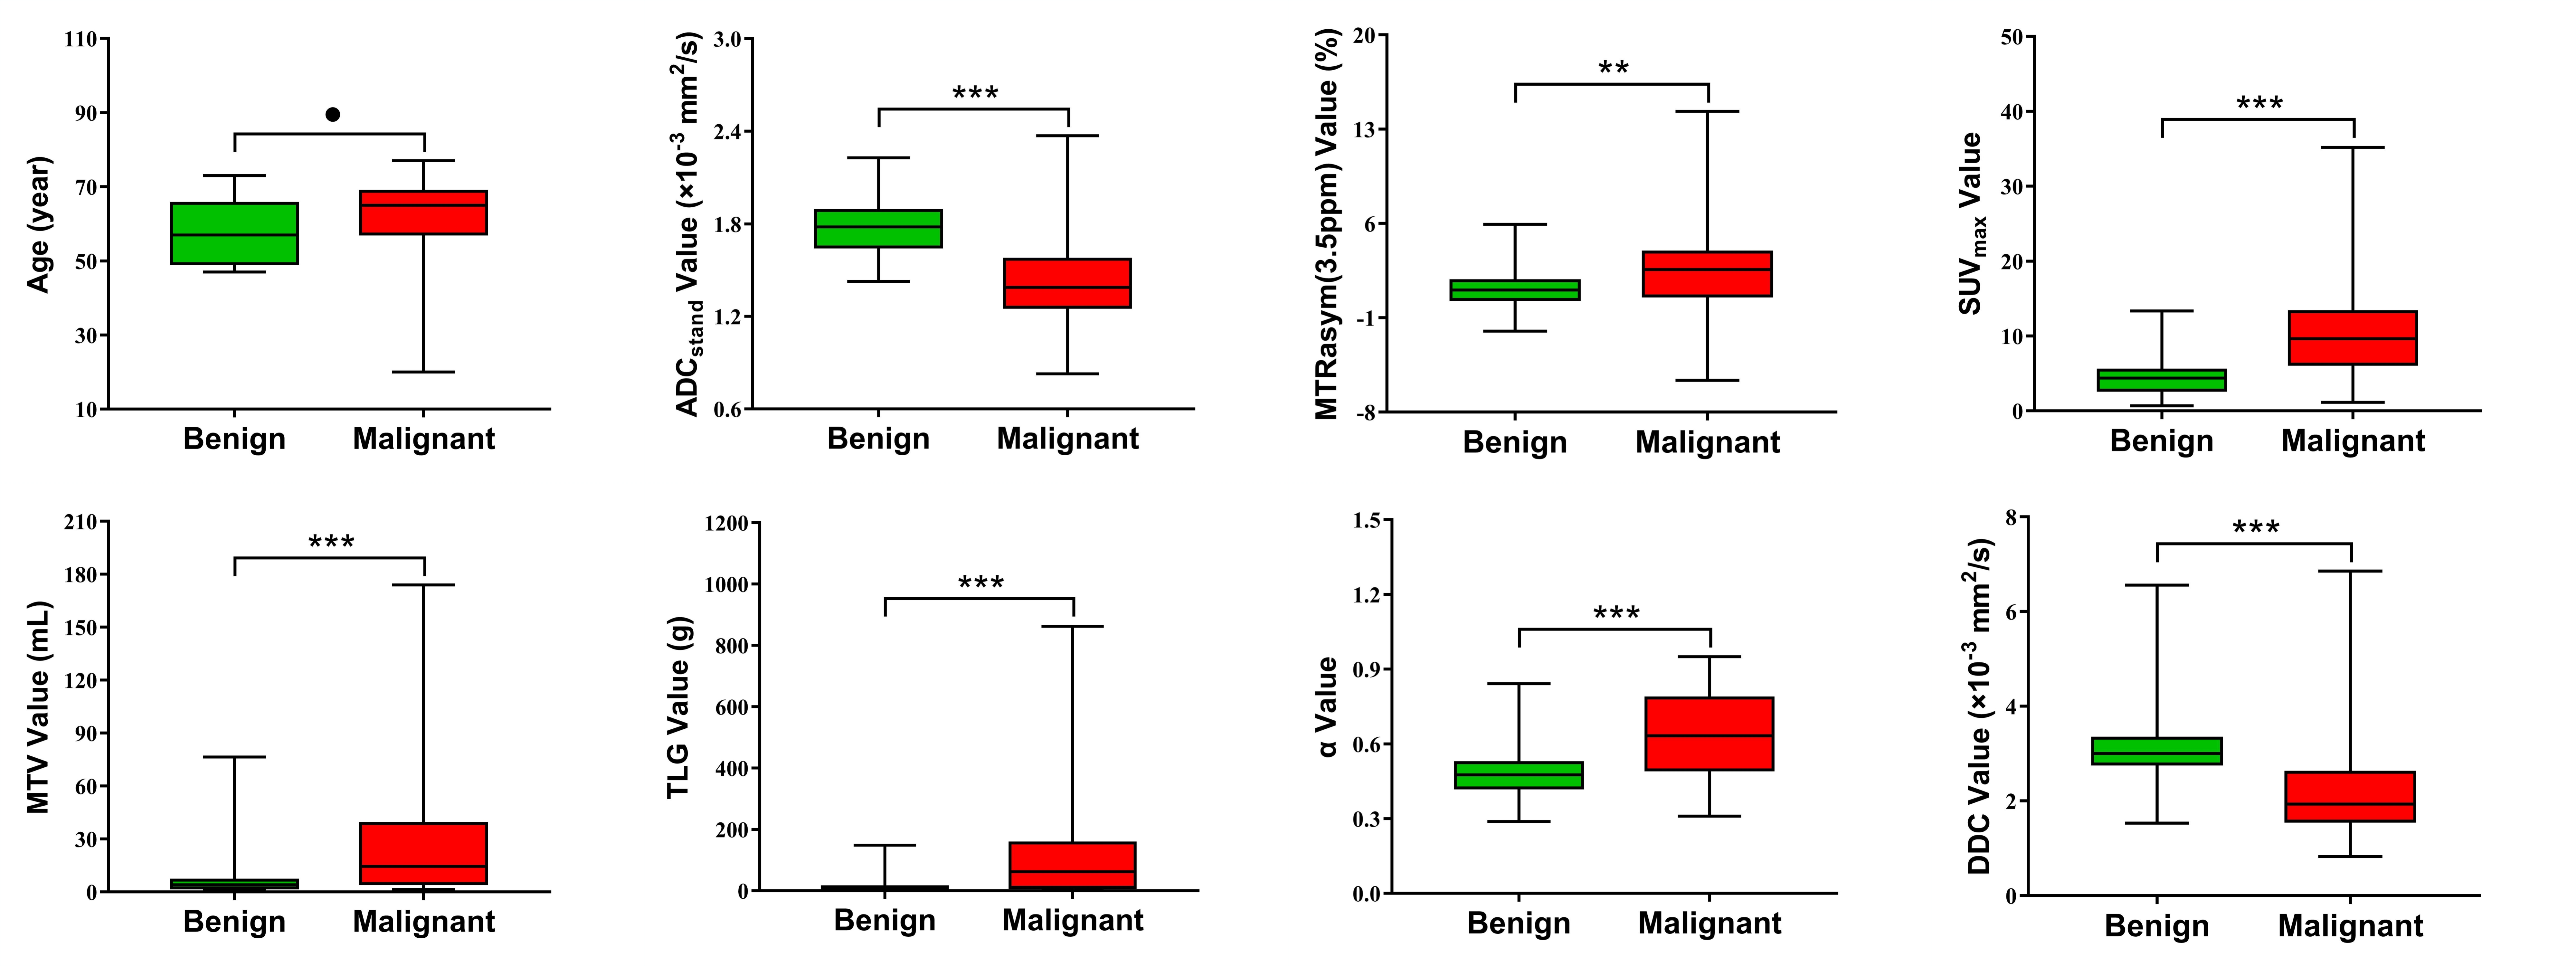
Results: SUVmax, MTV, TLG, α, and MTRasym(3.5ppm) values were lower and ADC, DDC values were higher in benign SPLs than malignant SPLs (all P < 0.01).
Impact: Multiparametric PET/MRI based on 18 F-FDG PET, MEM-DWI, SEM-DWI, and APTWI can effectively evaluate the characteristics of SPLs. The prediction model comprising SUVmax, ADC, and MTRasym (3.5 ppm) demonstrated superior diagnostic efficacy compared with individual parameters.
Introduction
Although most solitary pulmonary lesions (SPLs) are eventually determined to be benign, early differentiation between benign and malignant lesions remains crucial for effective patient management [1]. Multi-parametric positron-emission tomography / magnetic resonance imaging (PET/MRI), including 18F-FDG PET, amide proton transfer-weighted imaging (APTWI), mono-exponential model diffusion-weighted imaging (MEM-DWI), and stretched exponential model DWI (SEM-DWI) is sensitive to the glucose metabolism, water molecular diffusion, and mobile protein and peptide metabolism in biological tissues [2, 3]. This study aimed to use a hybrid 18F-FDG PET/MRI scanner to perform simultaneous chest 18F-FDG PET, APTWI, MEM-DWI, and SEM-DWI scans in patients with SPLs to compare the differences in each quantitative/semi-quantitative parameter between the benign and malignant groups, identify independent predictors, and establish a prediction model and validate it.Material and Methods
A total of 120 SPLs patients underwent chest 18F-FDG PET/MRI were enrolled, including 84 in the training set (28 benign and 56 malignant) and 36 in the test set (13 benign and 23 malignant). A hybrid 3.0 T PET/MR system (uPMR 790, UIH, Shanghai, China) with a 12-channel phased-array body coil was performed. The PET scan was initiated 60 minutes after injection of 18F-FDG (0.11 mCi/kg). A Dixon method-based water-fat imaging sequence was performed for attenuation correction and ordered subset maximum expected iteration methods were used to reconstruct the images. The MEM-DWI was performed by using two b values (0, 600 s/mm2). The SEM-DWI was performed by using ten b values (0, 25, 50, 100, 150, 200, 400, 600, 800, 1000 s/mm2). For APTWI: ETL = 39, B1 = 1.3 μT and 2.5 μT, Gaussian pulse, 100 ms duration, 10 repeats, Δ spanned from [-4.5 4.5] ppm in 31 steps, plus one S0 with no CEST saturation pulse for normalization; 11 low power B1 = 0.13 μT, Δ spanned from [-1.0 1.0] ppm images were collected as WASSAR images for B0 map correction.Statistical analyses were performed with Python (Version 3.10; Python Software Foundation) software. The Mann–Whitney U test, independent samples t-test, and chi-square test were used to compare different variables. The diagnostic efficacy was evaluated using the area under the receiver operating characteristic curve (AUC), and differences in AUCs were assessed using the DeLong test. The logistic regression (LR) analysis was used to identify independent predictors and establish a prediction model. Calibration curves and decision curve analysis (DCA) were used for evaluating the prediction model. Statistical significance was set at P <0.05.
Results
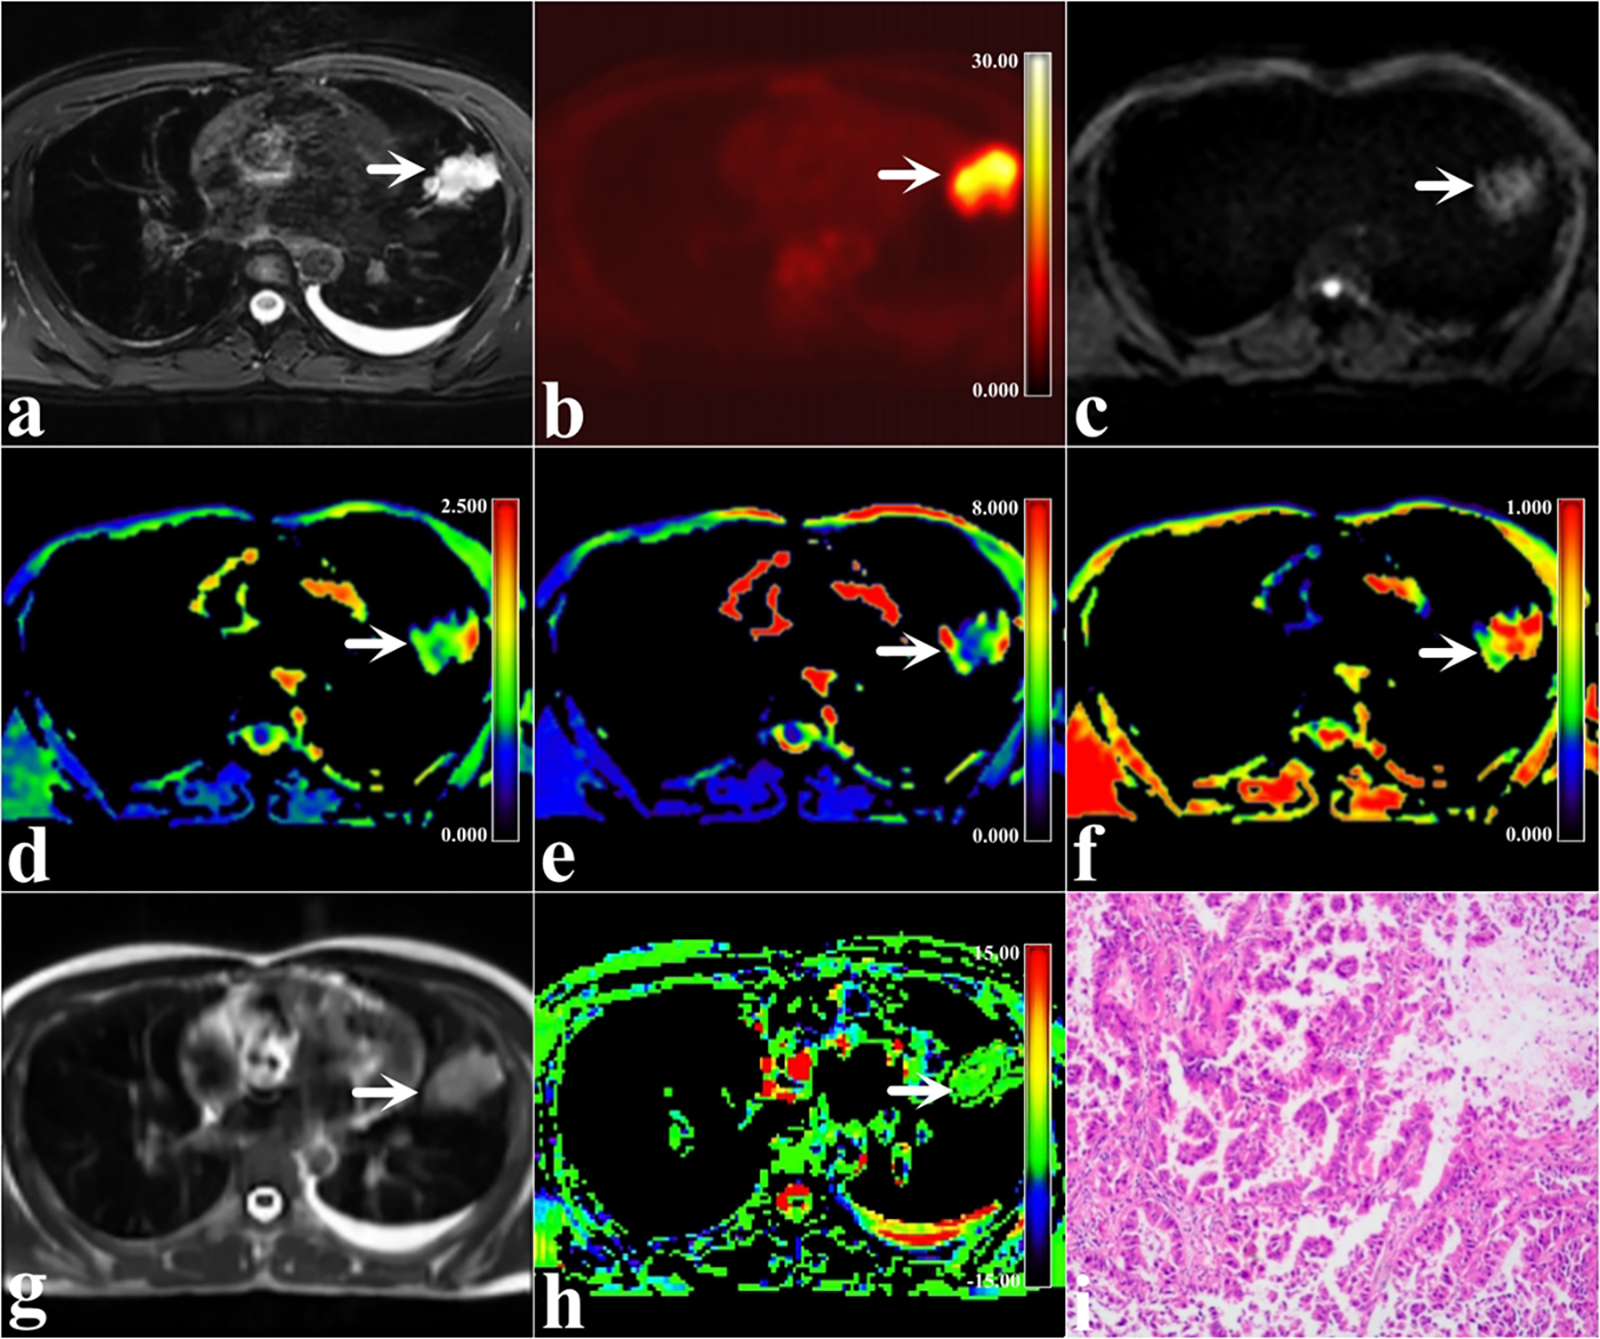
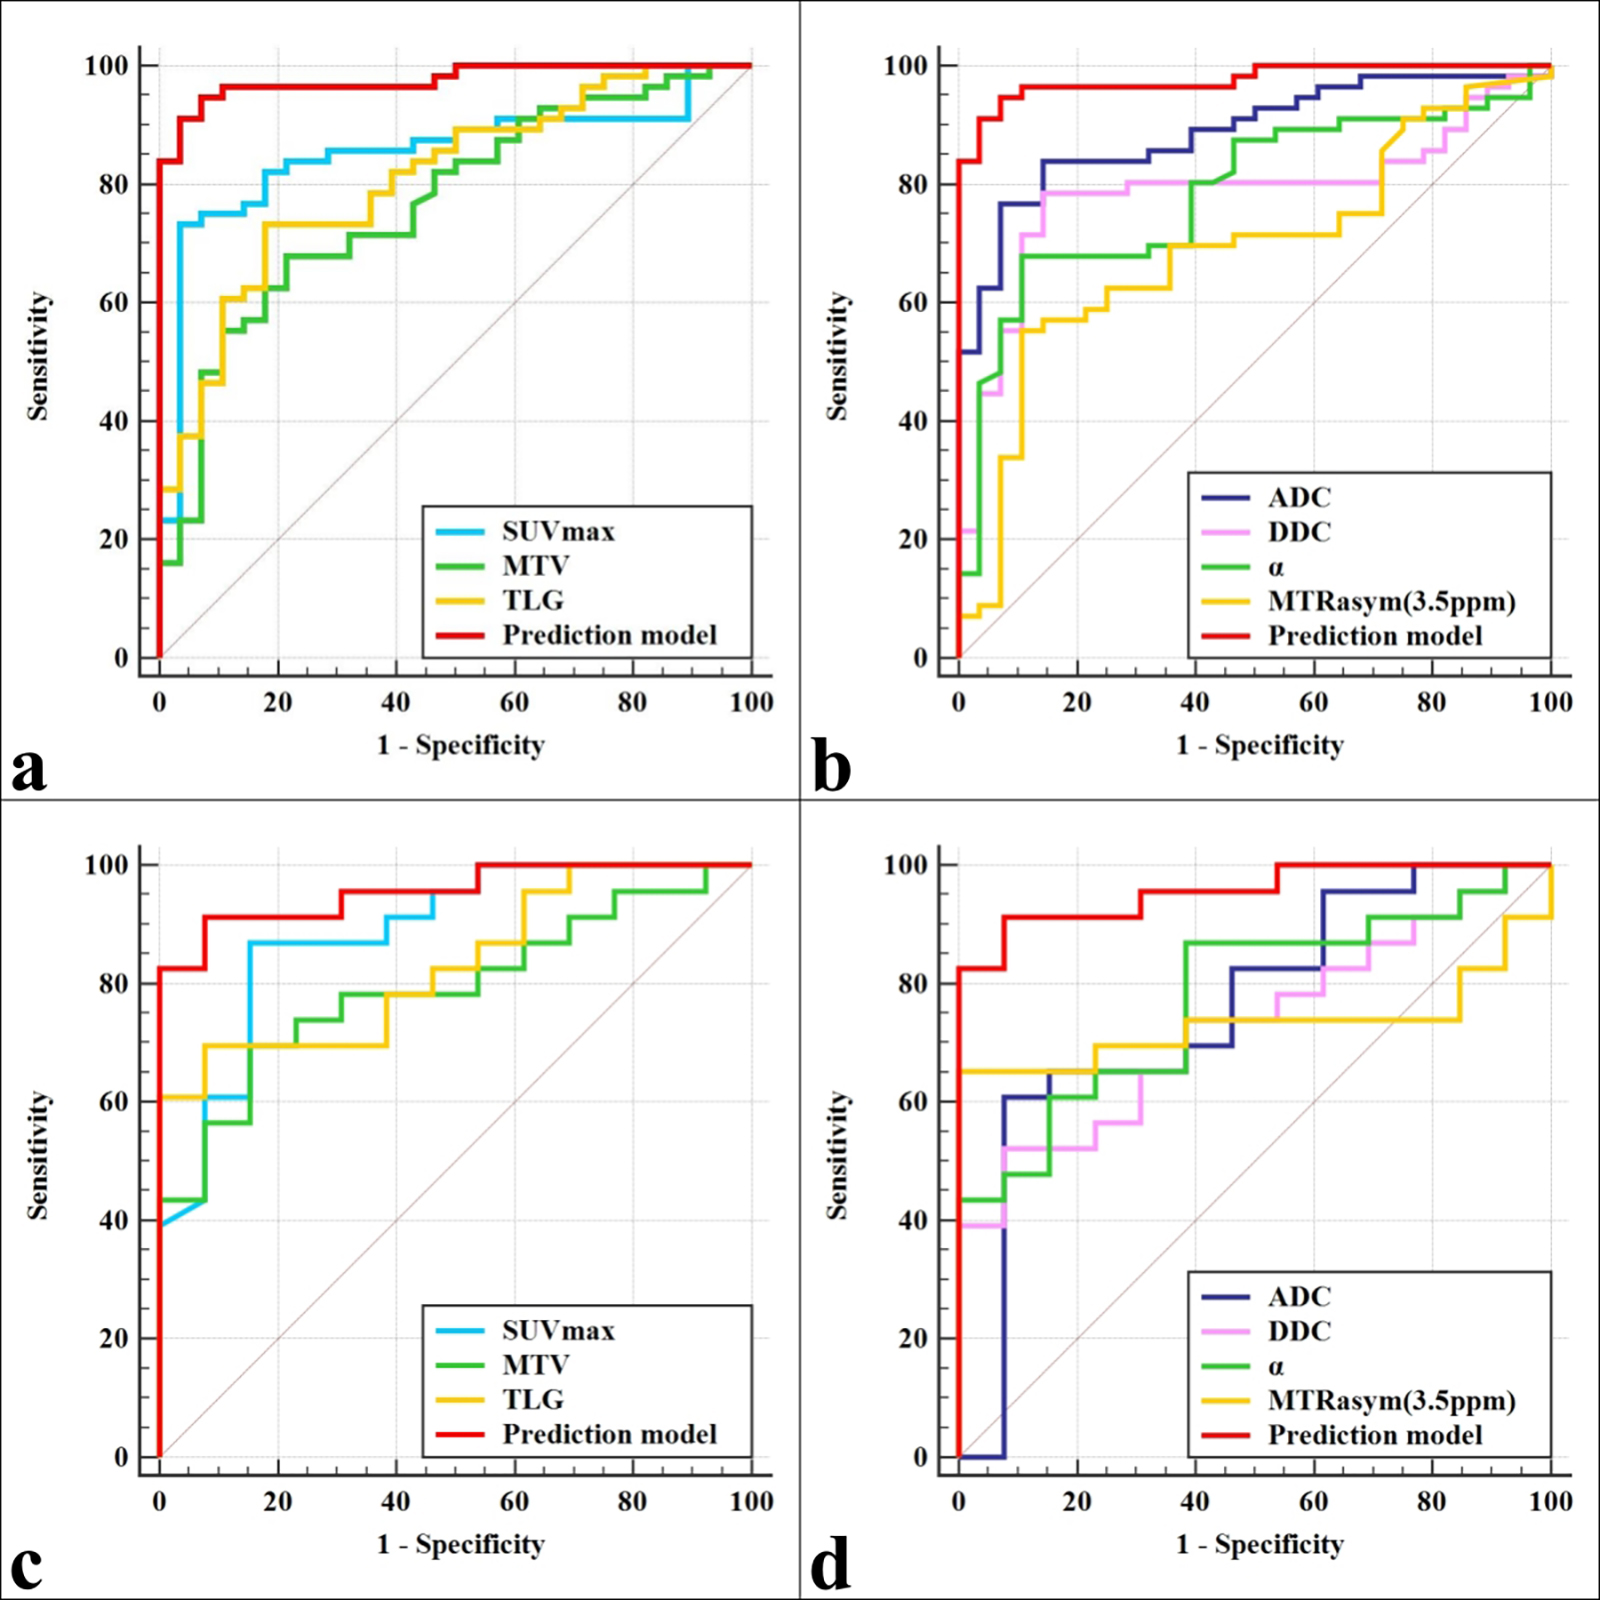
SUVmax, MTV, TLG, α, and MTRasym(3.5ppm) values were significantly lower and ADC, DDC values were significantly higher in benign SPLs than malignant SPLs (all P < 0.01). SUVmax, ADC, and MTRasym(3.5ppm) were independent predictors. Within the training set, the prediction model based on these independent predictors demonstrated optimal diagnostic efficacy (AUC, 0.976; sensitivity, 94.64 %; specificity, 92.86 %), surpassing any single parameter with statistical significance. Similarly, within the test set, the prediction model exhibited optimal diagnostic efficacy. The calibration curves and DCA revealed that the prediction model not only had good consistency but was also able to provide a significant benefit to the related patients, both in the training and test sets (Figure.1,2,and 3).Discussion
Our results showed that SUVmax, MTV, TLG, α, and MTRasym(3.5ppm) values were significantly lower and ADC, DDC values were significantly higher in benign SPLs than malignant SPLs (all P < 0.01). A possible explanation is that compared to benign SPLs, malignant SPLs are more aggressive, with more active cell proliferation and more haemorrhagic and necrotic components, which not only limits diffusion of water molecules but also increases the level of glucose metabolism, the amount of mobile proteins and peptides, and the tissue complexity, resulting in smaller ADC and DDC values, and larger α, SUVmax, MTV, TLG and MTRasym (3.5 ppm) values [4, 5, 6]. This study also found that the prediction model based on independent predictors (SUVmax, ADC, and MTRasym(3.5ppm)) demonstrated optimal diagnostic efficacy, surpassing any single parameter with statistical significance. We speculate that this may be related to the fact that combinations of multiple parameters may more accurately characterise lesions.Conclusion
Multiparametric PET/MRI based on 18 F-FDG PET, MEM-DWI, SEM-DWI, and APTWI can effectively evaluate the characteristics of SPLs. The prediction model comprising SUVmax, ADC, and MTRasym (3.5 ppm) demonstrated superior diagnostic efficacy compared with individual parameters. It holds promise as a reliable imaging marker for differentiating between benign and malignant SPLs.Acknowledgements
The National Key R&D Program of China (2017YFE0103600), the National Natural Science Foundation of China (81720108021 and 31470047), the Zhongyuan Thousand Talents Plan Project - Basic Research Leader Talent (ZYQR201810117), the Zhengzhou Collaborative Innovation Major Project (20XTZX05015), the Key Project of Henan Province Medical Science and Technology Project (LHGJ20190602), and the Henan provincial science and technology research projects (212102310689).References
1. Zhu LH, Wang FN, Wang YW, et al (2022) Differentiation Between Solitary Pulmonary Inflammatory Lesions and Solitary Cancer Using Gemstone Spectral Imaging. J Comput Assist Tomogr. 46:300-307.
2. Zhou J, Payen JF, Wilson DA, et al (2003) Using the amide proton signals of intracellular proteins and peptides to detect pH effects in MRI. Nat Med. 9: 1085-1090.
3. Bennett KM, Schmainda KM, Bennett RT, et al (2003) Characterization of continuously distributed cortical water diffusion rates with a stretched-exponential model. Magn Reson Med. 2003;50:727-734.
4. Ohno Y, Yui M, Koyama H, et al (2016) Chemical Exchange Saturation Transfer MR Imaging: Preliminary Results for Differentiation of Malignant and Benign Thoracic Lesions. Radiology. 279:578-589.
5. Ohno Y, Kishida Y, Seki S, et al (2018) Amide proton transfer-weighted imaging to differentiate malignant from benign pulmonary lesions: Comparison with diffusion-weighted imaging and FDG-PET/CT. J Magn Reson Imaging. 47: 1013-1021.
6. Suo S, Cheng F, Cao M, et al (2017) Multiparametric diffusion-weighted imaging in breast lesions: Association with pathologic diagnosis and prognostic factors. J Magn Reson Imaging. 46:740-750.
Figures