2576
Analysis of Changes in Quantitative MRI with Time in Muscle Denervation of the Lower Extremities1Radiology & Imaging, Hospital for Special Surgery, New York, NY, United States, 2Rutgers New Jersey Medical School, Newark, NJ, United States, 3Biostatistics Core, Hospital for Special Surgery, New York, NY, United States
Synopsis
Keywords: Diffusion Analysis & Visualization, Quantitative Imaging, Peripheral nerves, denervation
Motivation: Quantitative muscle MRI (qMRI) metrics (T2, diffusion diameter, and fat fraction (FF)) are sensitive to tissue microstructure, and altered in denervated muscle. However, the time-dependencies of these metrics as they relate to denervated muscle have not yet been analyzed in humans.
Goal(s): Assess patterns of qMRI changes in the lower extremity in denervated muscle.
Approach: Muscles from 24 lower extremity exams (23 patients) were categorized as non-denervated or denervated (chronically- or acutely-involved) using electromyography findings.
Results: Increased T2 in denervated muscles, and increased FF in chronically-involved muscles, and alternating patterns of diffusion diameter with time.
Impact: Quantitative MRI changes in lower extremity denervated muscles may complement peripheral nerve MRI and electromyography by providing tissue sensitive information relevant to the extent of disease at specific timepoints from initial injury.
Introduction
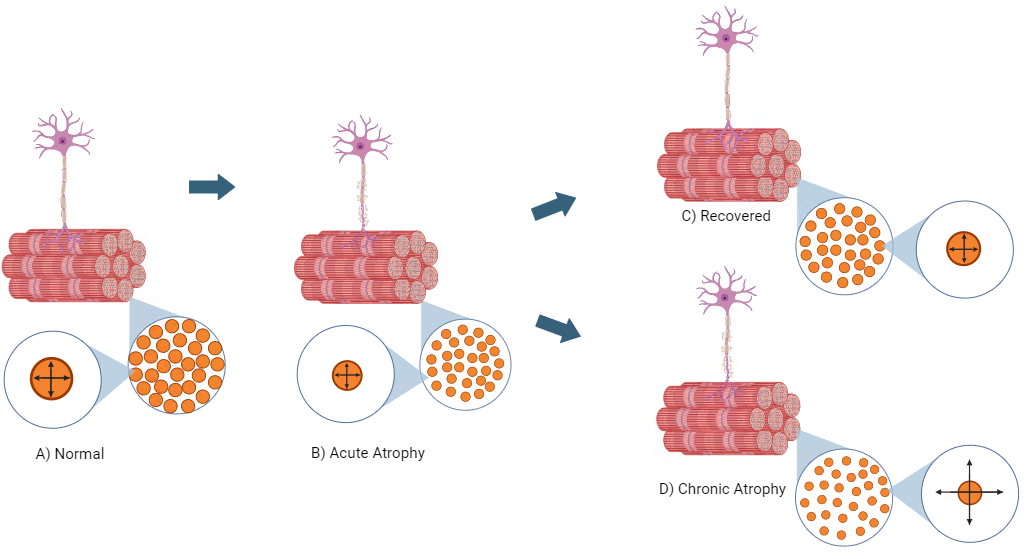
MRI complements needle electromyography (EMG) to provide a direct but qualitative assessment of nerves and muscles involved in peripheral neuropathies1,2. Quantitative MRI (qMRI) techniques have previously been shown sensitive to muscle tissue changes due to denervation; T2 is sensitive to early extracellular fluid changes in denervated muscle from muscle edema3 and correlates with electromyography4, while diffusion MRI-based apparent fiber diameter (AFD)5 can depict muscle atrophy. Diffusivity may also be sensitive to increased muscle perfusion and capillary permeability and may be reflected by the apparent fluid weight (AFW)5. Chronically, further diffusivity changes may occur due to muscle fibrosis, alongside fat fraction (FF) increases due to onset of fatty infiltration6, typically from around 6-7 months post onset7, if neither recovery nor reinnervation occurs (Fig.1). In this study, we aimed to compare qMRI changes of lower extremity involved muscles over time via grouped stages: 1) ‘acute’ (combining both acute (<1 week) and subacute (1 week to 6 months) stages) and 2) chronic (>6 months). We hypothesized that qMRI changes would be observed between normal muscles and denervated muscles in acutely- and chronically involved muscle denervation.Methods
Data acquisition – Under an IRB-approved protocol (IRB 2015-441), we prospectively recruited and obtained written consent from 23 patients (9 female, 14 male, 1 bilateral for a total of 24 exams) undergoing standard-of-care MRI at 3.0T field strength with suspected lower extremity denervation, and with positive EMG findings of muscle denervation and/or ‘reduced’ to ‘none’ motor unit recruitment. qMRI acquisitions (T2-mapping for T2 values, multi-b-valued diffusion for AFD, AFW, and radial diffusivity (RD), and 3D multi-echo gradient echo for FF were also obtained8.Muscle Analysis – By listing the specific muscles evaluated with EMG and comparing these against the availability of the same muscle regions in the imaged field-of-view and the estimated time of denervation onset, all available muscles were categorized into three groups: non-denervated (n=28), denervated (≤6 months, n=31) and denervated (>6 months, n=16). One musculoskeletal radiologist and one medical student independently segmented muscle regions of interests (ROIs) on three axial slices for each muscle from the 3D gradient-echo acquisition using ITK-Snap9.
Statistical Analysis – qMRI metrics, including T2, AFD, AFW, RD, and FF of segmented ROIs were analyzed with ANOVA and Tukey pairwise post-hoc tests for comparison across the three groups: non-denervated, denervated (≤6 months), and denervated (>6 months), and at a significance level of α=0.05.
Results
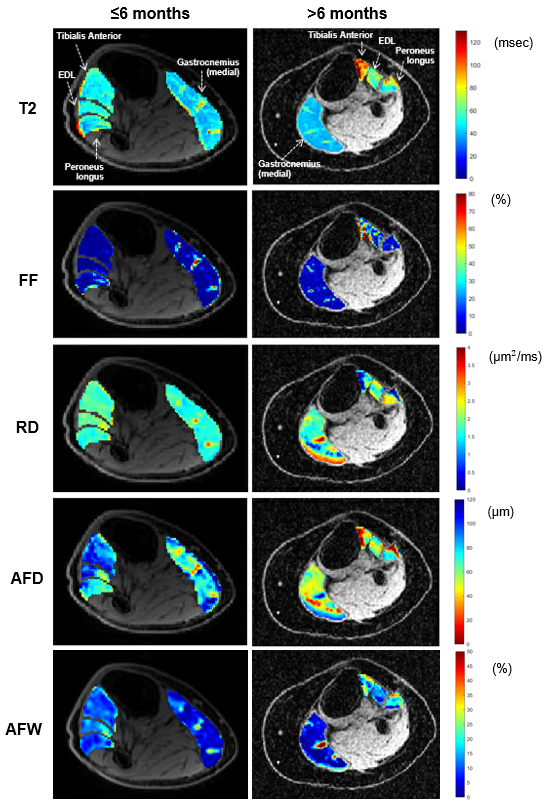
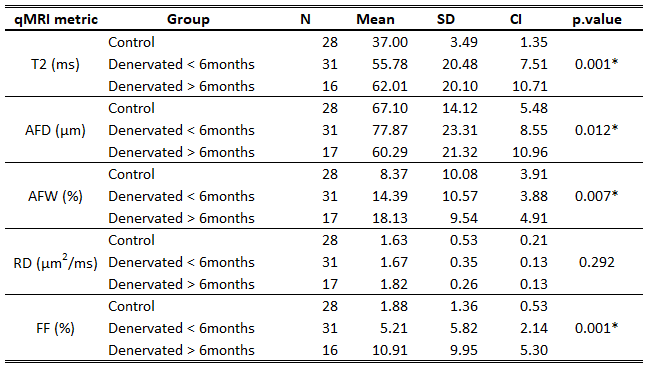
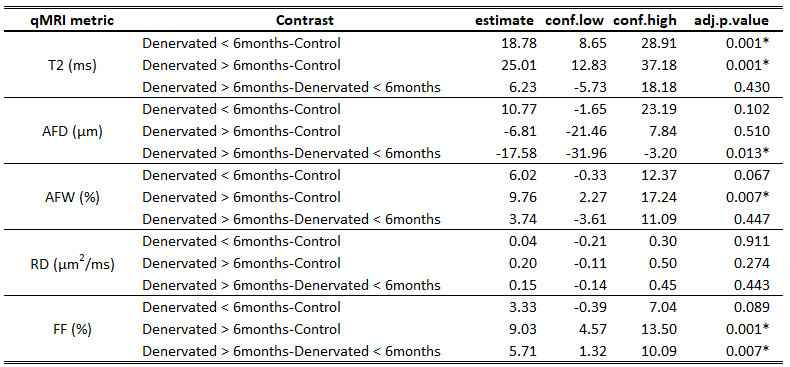
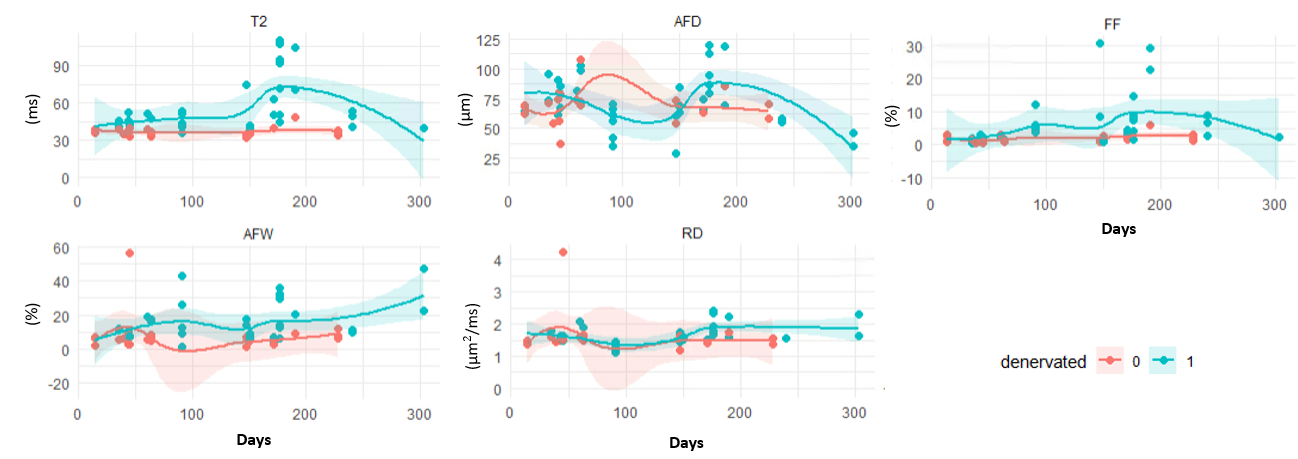
Fig. 2 depicts qMRI changes in two different subjects with acutely and chronically-involved foot drop. The ANOVA (Table 1) and Tukey tests (Table 2) showed increased T2 in both denervated groups (55.78ms and 62.01ms) vs 37.00ms in the non-denervated group. For FF, denervated muscles >6 months had higher FF (10.91%) than both control muscles and denervated muscles ≤6 months (1.88% and 5.21%). AFD was significantly lower in denervated muscles >6 months than in denervated muscles <6 months (60.29µm vs 77.87µm). AFW showed significant increase in denervated >6 months vs the non-denervated group (18.13% vs 14.39%). RD did not reflect significant differences among the groups.To visualize qMRI trends with time, smoothed scatterplots (Fig. 3) demonstrated T2 increase peaking just past 6 months. AFD decreased to about 4 months, before increasing rapidly and decreasing after 7 months. FF steadily increased to about 7 months before decreasing. RD was relatively flat, but showed a slight increase at about 7 months.
Discussion
In this study, we observed differences in qMRI metrics in acutely- and chronically-involved denervated muscle vs. non-denervated lower extremity muscles, which included assessments of the extracellular fluid space (with T2), muscle atrophy (AFD), perfusion (AFW) and fatty infiltration (FF). The patterns of change in these qMRI metrics with time may depict progression of nerve injury/disease, and subsequent recovery in the affected muscles. Study limitations included a broad inclusion/exclusion criteria for all types of nerve injury (traumatic or atraumatic). We also did not compare associations of qMRI against EMG, as EMGs were performed by many different providers and is known to have a low inter-observer agreement. We plan to continue enrolling patients in this ongoing study to determine the potential varying effects of different types of nerve pathology, and to select specific patient cohorts for a longitudinal study of lower extremity denervation.Conclusion
The qMRI metrics may provide a more comprehensive, quantitative understanding of the physiological changes in denervated muscle, which can complement qualitative MRI and electromyography in assessing patients with lower extremity denervation, and may provide prognostic indicators for recovery.Acknowledgements
The authors thank Yan Wen and Maggie Fung for technical assistance.References
1. Faridian-Aragh N, Chalian M, Soldatos T, et al. High-resolution 3T MR neurography of radial neuropathy. J Neuroradiology. 2011;38(5):265-274. doi:10.1016/j.neurad.2011.05.006
2. Kim SJ, Hong SH, Jun WS, et al. MR Imaging Mapping of Skeletal Muscle Denervation in Entrapment and Compressive Neuropathies. Radiographics. 2011;31(2):319-332. doi:10.1148/rg.312105122
3. POLAK JF, JOLESZ FA, ADAMS DF. Magnetic Resonance Imaging of Skeletal Muscle Prolongation of T1 and T2 Subsequent to Denervation. Invest Radiol. 1988;23(5):365-369. doi:10.1097/00004424-198805000-00007
4. Tan ET, Serrano KC, Bhatti P, et al. Quantitative MRI Differentiates Electromyography Severity Grades of Denervated Muscle in Neuropathy of the Brachial Plexus. J Magn Reson Imaging. 2022;56(4):1104-1115. doi:10.1002/jmri.28125
5. Argentieri EC, Tan ET, Whang JS, et al. Quantitative T2‐mapping magnetic resonance imaging for assessment of muscle motor unit recruitment patterns. Muscle Nerve. 2021;63(5):703-709. doi:10.1002/mus.27186
6. Kim HS, Yoon YC, Choi B, Jin W, Cha JG. Muscle fat quantification using magnetic resonance imaging: case–control study of Charcot–Marie–Tooth disease patients and volunteers. J Cachexia Sarcopenia Muscle. 2019;10(3):574-585. doi:10.1002/jcsm.12415
7. Carlson BM. The Biology of Long-Term Denervated Skeletal Muscle. European J Transl Myology. 2014;24(1):3293. doi:10.4081/ejtm.2014.3293
8. Tan ET, Zochowski KC, Sneag DB. Diffusion MRI fiber diameter for muscle denervation assessment. Quant Imaging Med Surg. 2022;0(0):0-0. doi:10.21037/qims-21-313
9. Yushkevich PA, Piven J, Hazlett HC, et al. User-guided 3D active contour segmentation of anatomical structures: Significantly improved efficiency and reliability. Neuroimage. 2006;31(3):1116-1128. doi:10.1016/j.neuroimage.2006.01.015
Figures