2574
Imaging analysis of subcutaneous tumors based on time-dependent diffusion MRI1Faculty of Life Sciences, Kumamoto University, Kumamoto, Japan, 2Research Institute for Biomedical Sciences, Tokyo University of Science, Noda, Chiba, Japan, 3Nippon Medical School, Tokyo, Japan, 4National Institute of Advanced Industrial Science and Technology (AIST), Tsukuba, Japan
Synopsis
Keywords: Microstructure, Tumor
Motivation: Diffusion MRI is a non-invasive imaging method that depicts the water molecule diffusion, but its use for studying peripheral cancers has lagged behind that for deep cancers.
Goal(s): To develop a highly accurate MRI method of peripheral cancer diagnosis that is comparable to biopsy-based diagnosis.
Approach: To determine the differences in diffusion time-dependency between subcutaneous tumor tissues from normal tissues in tumor-bearing mouse models, we utilized a wide range of diffusion times and obtained information about intra- and inter-tumor cell microstructures.
Results: In subcutaneous tumor models, time-dependent diffusion MRI can discriminate tumor tissues and identify cancer cell lines.
Impact: The improved MRI method for non-invasive tumor diagnosis based on time-dependent diffusion MRI not only helps physicians determine the grade of malignancy, but also contributes to early detection by its ability to evaluate microstructures.
Introduction
Obtaining biopsy specimens from tumors in the brain and deeper layers of organs, and from gynecological tumors such as ovarian cancer, involves invasive techniques. MRI is very useful as a non-invasive cancer diagnosis method. Diffusion MRI is a technique to observe the diffusion of water molecules, which is restricted by the cell membrane and intracellular organelles, and thus reflects the structural information of the cells and surrounding tissues (Fig. 1)1,2. Since the diffusion distance of water molecules depends on the diffusion time, an appropriate diffusion time must be set for the size of each structure. Accordingly, we utilized a wide range of diffusion times. In addition to middle~longer diffusion times (of 7.5–100 ms) using Pulse Gradient Spin Echo (PGSE), shorter diffusion times (of 1.875–7.5 ms) using Oscillating Gradient Spin Echo (OGSE) were applied3. There are over 100 types (about 40 malignant types) of subcutaneous soft-tissue tumors, a type of peripheral cancer, and tissue diagnosis can be difficult, especially with deeper localization. Diffusion MRI may provide important information to distinguish between cystic tumors with hemorrhage and necrosis, cellularly-rich tumors, fatty tumors, and tumors with mucous humor, based on water diffusion. The frequency of subcutaneous soft tissue tumors is low, complicating systematic human studies. In this study, LLC- and B16-bearing mice were used as subcutaneous tumor models. The former is accompanied with inflammatory changes such as hemorrhage and necrosis, while the latter is rich in cellular components. Based on the Apparent Diffusion Coefficient (ADC) values from the diffusion time measurements, the ability to discriminate between normal and tumor tissues was evaluated. We also analyzed the ability to discriminate between the two cancer cell lines.Methods
Mice (male C57BL/6, 9–12 weeks old) were inoculated subcutaneously with either LLC or B16 cells into the right dorsal area. When each tumor reached 300–500 mm3, MR imaging was performed. Mice were anesthetized with 2% isoflurane before and during scanning with a 7T MRI (Bruker BioSpec). The imaging parameters for PGSE and OGSE acquisitions were as follows: TR/TE 5000/80 ms; FOV = 20×20 mm2; resolution = 200×200 μm2; slice thickness = 1 mm; number of slices = 10; b value = 100–500 s/mm2; diffusion time = 7.5–100 ms for PGSE, 1.875–7.5 ms for OGSE. The diffusion time in the OGSE method can measure 3–5 μm structures, and that in the PGSE method can measure 5–20 μm structures (Fig. 2). Averaged ADC values, obtained by averaging nine ADC calculation regions (six in tumor tissues and three in normal skin tissues), were set up on the images. Based on the ADC values from the diffusion time measurements, the ability to discriminate between normal and tumor tissues was evaluated. We also analyzed the ability to discriminate between the two cancer cell lines. Since the ADC values comprehensively reflect not only cell density but also cell size and intra- and extracellular structures, we used the IMPULSED model fitting tool (MRI signals are defined as signals arising from the intracellular and extracellular spaces, and cells are modeled as opaque spheres for simplicity) to calculate the parameters of the cell properties4. In the future, we will modify the IMPULSED model into a fitting model that can successfully explain our MRI data and improve MRI diagnostic accuracy.Results and discussion
The relationships between diffusion times and ADC values measured by OGSE and PGSE sequences are graphed as a scatter diagram (Fig. 3). For both tumor-bearing mice (LLC and B16), the ADC values were significantly lower in tumor tissues than in normal skin tissues for lower diffusion times (1.875–6.75 ms, p < 0.001). The water diffusion appears to be more restricted in tumor tissues, resulting in lower ADC values (Fig. 1)5. Our MRI data indicated that tumor tissues can be discriminated from normal tissues, based on the ADC values (Fig. 3). The ADC values for LLC mice tended to be smaller than those for B16 mice. The central parts of the tumor sites in LLC mice were inflamed and ulcerated. The chronic inflammatory responses may induce fibrosis of the surrounding tissues, resulting in the diffusion disturbance of water molecules and the ADC reduction6. Our MRI data indicated that the two tumor cell lines may be discriminated according to their ADC values.Conclusions
Based on the ADC values from the diffusion time measurements (OGSE and PGSE) for subcutaneous tumor model mice, tumor tissues can be discriminated from normal tissues. In addition, two types of tumors can be discriminated.Acknowledgements
No acknowledgement found.References
1. Le Bihan, D. et al. Radiology 161, 401–407 (1986)
2. Martin, M. Magn. Reson. Insights 6, 59–64 (2013)
3. Wu, D. et al. Magn. Reson. Med. 72, 1366–1374 (2014)
4. Jiang, X. et al. Magn. Reson. Med. 75, 1076–1085 (2016)
5. Shrinkhin, E. G. et al. Int. J. Mol. Sci. 23, 15780 (2022)
6. Kim, S. et al. Nature 457, 102106 (2009)Figures
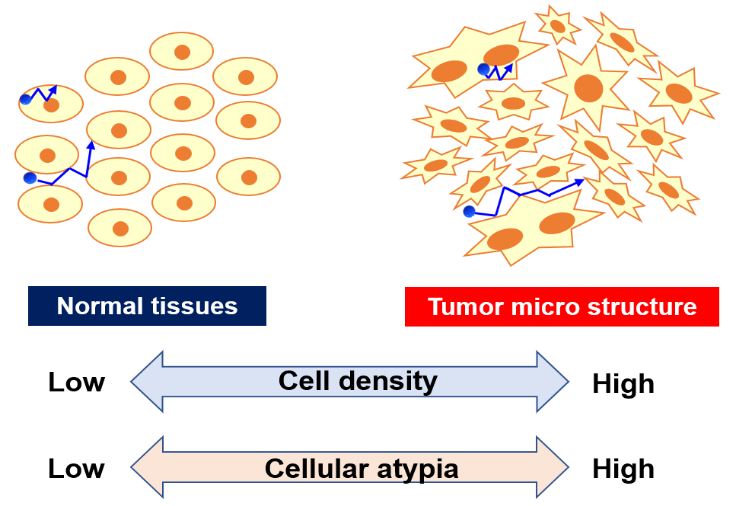
Fig. 1 Diffusion of Intra and Inter-cellular water molecules.
Compared to normal cells, tumor cells tend to be larger and have higher cellular atypia and proliferation potential. Since tumor cells have these features, the ADC values of them are lower than normal tissues.
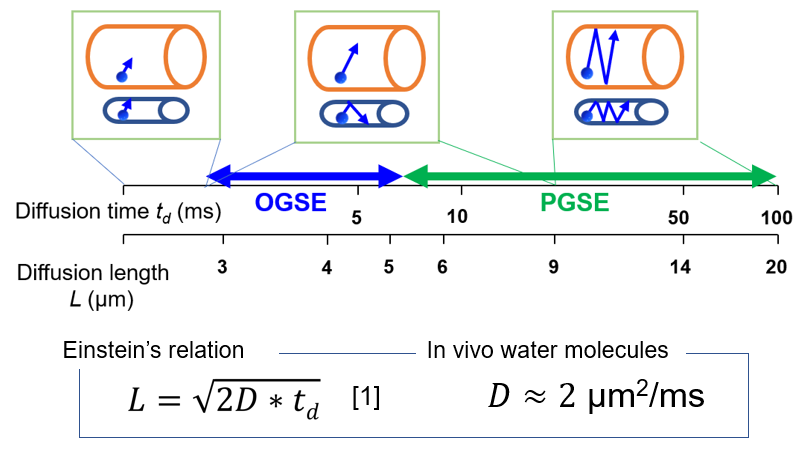
Fig. 2 Diffusion time and length ranges obtained by OGSE and PGSE.
According to Einstein’s relation [1] shows free diffusion in one dimension, the relationship is valid. Where D is the self-diffusion coefficient and td is the diffusion time, and L is the distinctive diffusion length; i.e, the mean distance of water molecule migrations in td .
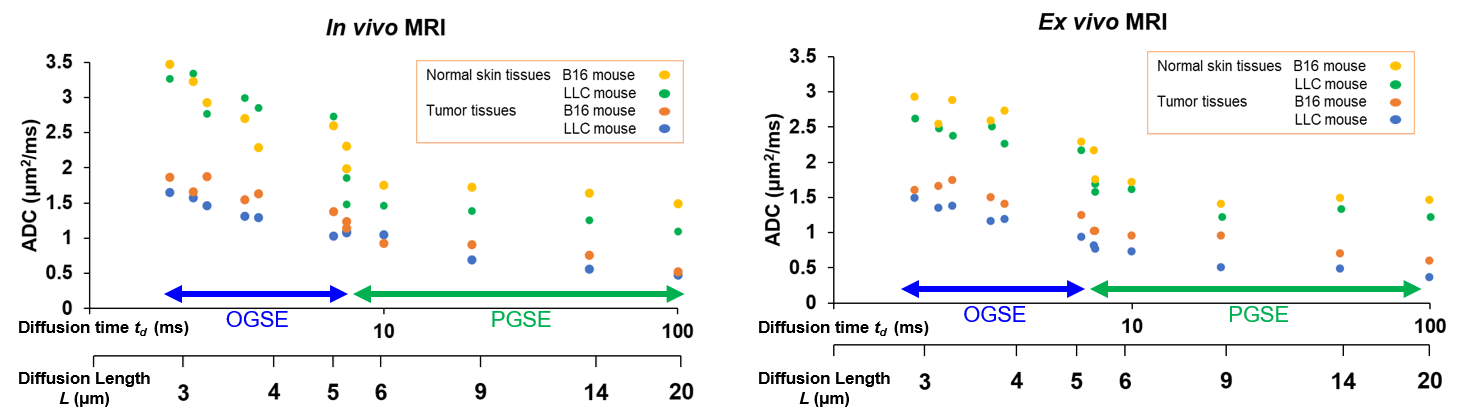
Fig. 3 Relationships between diffusion times and ADC values measured by OGSE and PGSE sequences.