2569
Value of Magnetic Resonance Stretched-Exponential and Fractional Order Calculus Models to Differentiate HCC and ICC1The First Affiliated Hospital of Guangxi Medical University, Nanning, China, 2MR Research Collaboration, Siemens Healthineers Ltd, Wuhan, China
Synopsis
Keywords: Diffusion Modeling, Diffusion/other diffusion imaging techniques, hepatocellular carcinoma, intrahepatic cholangiocarcinoma, stretched-exponential model, fractional order calculus model
Motivation: The traditional apparent diffusion coefficient (ADC) value had limited value in differentiating hepatocellular carcinoma (HCC) and intrahepatic cholangiocarcinoma (ICC).
Goal(s): To evaluate the value of stretched-exponential model (SEM) and fractional order calculus (FROC) diffusion model in differentiating HCC and ICC.
Approach: Parameters from SEM and FROC models and ADC value using multiple b-value DWI data were obtained, and were evaluated using t-test and ROC curve in differential diagnosis of HCC and ICC.
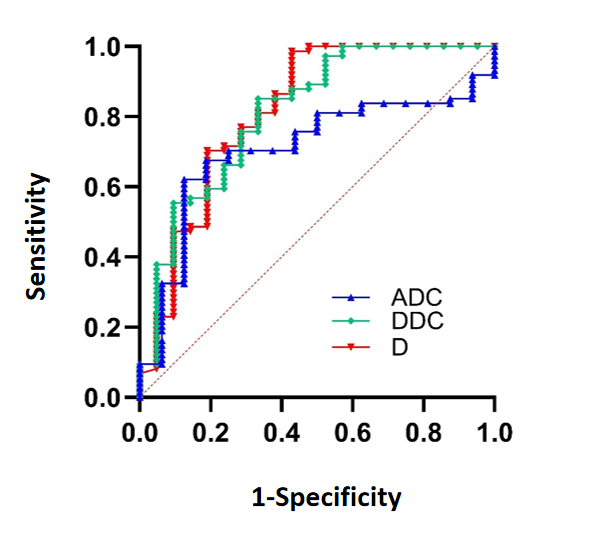
Results: Distributed diffusion coefficient (DDC) from SEM and diffusion coefficient (D) from FROC had significant differences between HCC and ICC, and had higher performances than the ADC.
Impact: DDC from SEM and D from FROC model may be helpful to improve the accuracy of the preoperative imaging diagnosis and guide personalized treatment for liver tumor.
Introduction
Previous studies showed that water motion deviates from the Gaussian distribution in the microstructure of tumor tissues, affecting the accuracy of the ADC measurement [1]. Non-Gaussian diffusion models are better at describing tumor tissue than ADC, and better reflect the true water spread of tissues with high heterogeneity and complexity of processes [2,3]. This study aimed to evaluate the application value of stretched-exponential model (SEM) and fractional order calculus (FROC) diffusion models in differentiating hepatocellular carcinoma (HCC) and intrahepatic cholangiocarcinoma (ICC).Materials and methods
This study was approved by the Medical Ethics Committee of our institution. Patients with suspected malignant lesions identified on abdominal ultrasonography or computed tomography (CT) examinations, were prospectively recruited, and all patients provided written informed consent.All patients underwent MR scanning with conventional sequences and a multiple-b DWI sequences on a 3T MRI scanner (MAGNETOM Prisma, Siemens Healthineers, Germany) The parameters of the DWI were as follows: free breath with navigation, 10 b-values = 0, 20, 50, 100, 150, 200, 600, 1000, 2000, and 3000 s/mm2, TR = 4900 ms, TE = 57 ms, FOV = 380 mm × 261 mm, FOV phase = 68.8%, matrix = 88 × 128, layer thickness = 5.0 mm, layer spacing = 6.4 mm, bandwidth = 2442 Hz/pixels.
Parameters from the mono-exponential (ADC), SEM (DDC and α), and FROC (D, β, and μ) models were quantified and analyzed by two radiologists with more than 5 years of experience in liver MRI diagnosis. The volume of interest (VOI) of the whole tumor was manually segmented on DWI images with b = 1000 s/mm2, using T2WIs as a reference. Bleeding and necrosis were carefully omitted. The average value for each parameter was obtained from the two radiologists.
SPSS 26.0 (IBM, Armonk, NY, USA) was used to analyze the data. The differences in diffusion parameters between the HCC and ICC groups were examined with an independent sample t-test. A receiver operating characteristic (ROC) curve was obtained for parameters with significant differences, and the area under the curve (AUC) was calculated to evaluate the diagnostic efficiency. Statistical significance was set at P < 0.05.
Results
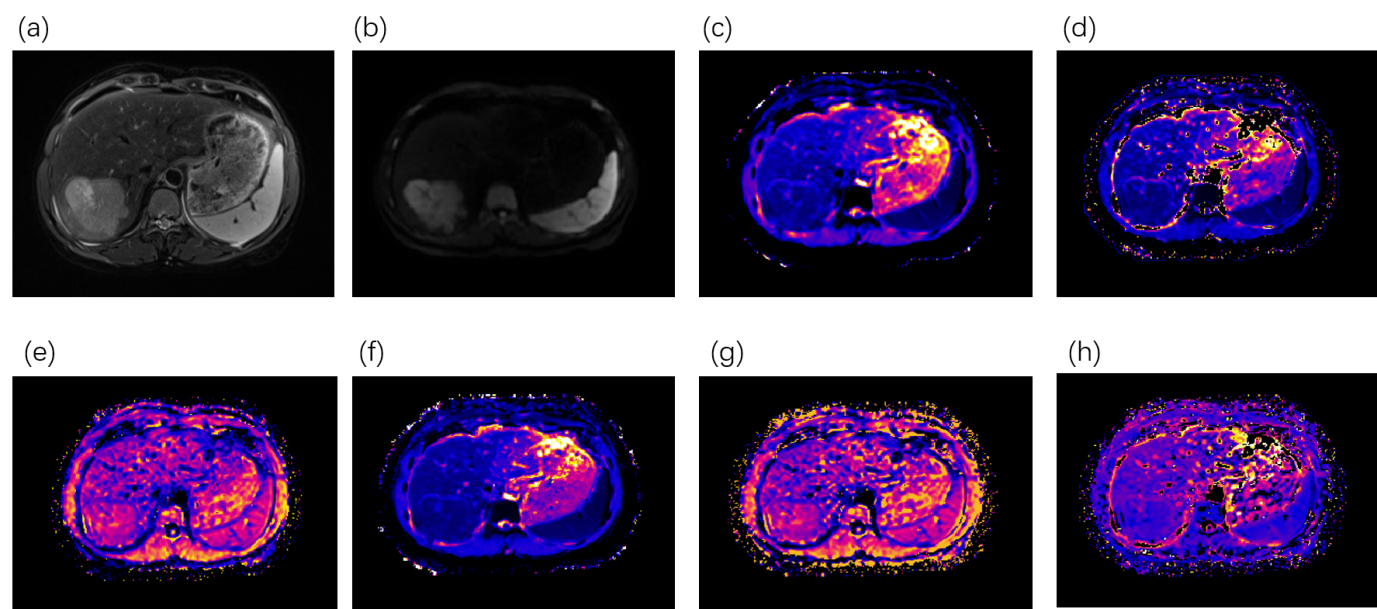
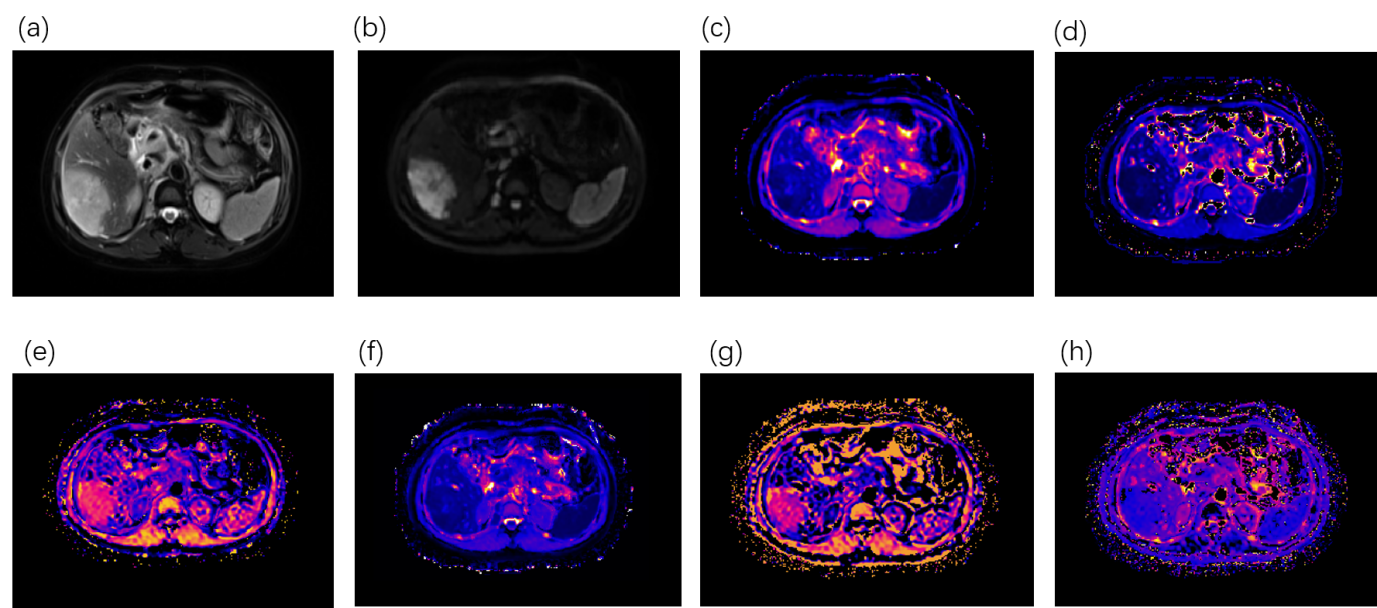
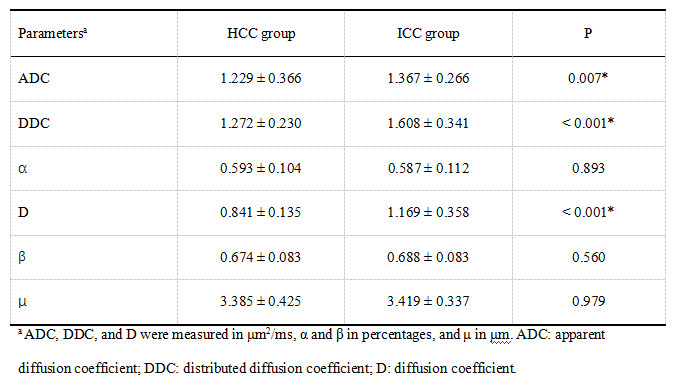
In total, 95 patients with primary liver cancer were recruited, including 74 patients with HCC (age: 52.5 ± 9.5 years, 59 males) and 21 patients with ICC (age: 58.9 ± 8.8 years, and 12 males).ADC, DDC, and D values were significantly lower in the HCC group than in the ICC group (All p < 0.05). No statistically significant differences between the two groups were found in the α, β, and μ values (All p>0.05). Detailed information is shown in Table 1. The representative parameter images are shown in Figure 1 and 2.
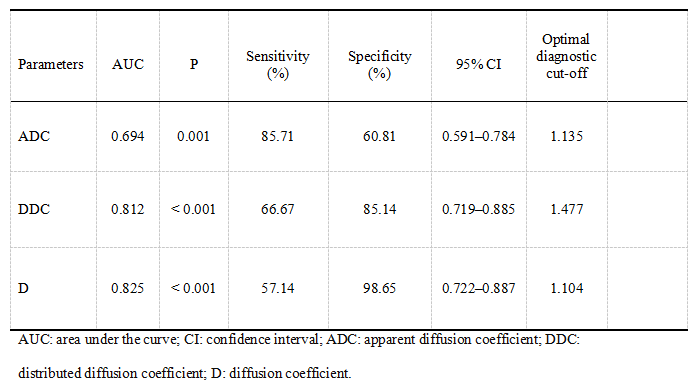
The overall diagnostic efficacy of the D and DDC was higher, with AUCs of 0.825 and 0.812, respectively, whereas the AUC was 0.694 for the ADC (Table 2 and Fig. 3).
Discussion
DDC represents the continuous distribution of diffusion coefficients from different tissue voxels and describe the average diffusion rate within them. We found that in the HCC group, DDC was significantly lower than in the ICC group, and provide a higher diagnostic efficiency than that of the ADC. The HCC tumor cells are tightly arranged and grow in dense nests within the liver tissue; and the tumor neovascularization increases and reduces the extracellular space, limiting the free movement of water molecules. In contrast, ICC originates from the intrahepatic bile ducts; and the tumor cells mostly surround the initial lesion, growing in a tubular, acinar, or cord shape and allowing more freedom to the water diffusion movement compared to the HCC cells [4-6]. The D from FROC model is also the diffusion coefficient and had a similar result with DDC in our study.α, β, and μ represent the heterogeneity of the water diffusion, and describe the complex diffusion process from various aspects. In our study, these parameters had no differences between HCC and ICC groups. α was reported to be heavily affected by tissue necrosis [7]. In the micronecrotic area, the living cell density is lower than in the tumor tissue; thus, the tumor microstructure is more uniform [8]. In our study, micronecrotic areas in the VOIs cannot be identified by the naked eye on MR images. which maybe reduce the α accuracy. For β, and μ, these two parameters may be insufficiently sensitive to detect the differences in heterogeneity and diffusion speed between the compact cell structure and high cell proliferation of HCC and ICC [9].
In conclusion, DDC and D were superior to the convention ADC.
Acknowledgements
No acknowledgement found.References
[1] Tang L, Zhou XJ. Diffusion MRI of cancer: From low to high b-values. J Magn Reson Imaging. 2019;49: 23-40. https://doi.org/10.1002/jmri.26293.
[2] Iima M, Le Bihan D. Clinical intravoxel incoherent motion and diffusion MR imaging: past, present, and future. Radiology. 2016;278: 13-32. https://doi.org/10.1148/radiol.2015150244.
[3] Tang L, Zhou XJ. Diffusion MRI of cancer: From low to high b-values. J Magn Reson Imaging. 2019;49: 23-40. https://doi.org/10.1002/jmri.26293.
[4] Çabuk F, Başsüllü N, Türkmen I, et al. The prognostic relationship between histopathological and immunohistochemical features of hepatocellular carcinoma, intrahepatic cholangiocarcinoma and mixed type. Pol J Pathol. 2020;71: 79-86. https://doi.org/ 10.5114/pjp.2020.97015.
[5] Gilles H, Garbutt T, Landrum J, Hepatocellular Carcinoma. Crit Care Nurs Clin North Am. 2022;34: 289-301. https://doi.org/10.1016/j.cnc.2022.04.004.
[6] Xue R, Chen L, Zhang C, et al. Genomic and Transcriptomic Profiling of Combined Hepatocellular and Intrahepatic Cholangiocarcinoma Reveals Distinct Molecular Subtypes. Cancer Cell. 2019(35) 932-947.e8. https://doi.org/10.1016/j.ccell.2019.04.007.
[7] Jin YN, Zhang Y, Cheng JL, Zheng DD, HuY. Monoexponential, Biexponential, and stretched-exponential models using diffusion-weighted imaging: A quantitative differentiation of breast lesions at 3.0T. J Magn Reson Imaging. 2019(50): 1461-67. https://doi.org/10.1002/jmri.26729.
[8] Witjes CDM, Willemssen FEJA, Verheij J, et al. Histological differentiation grade and microvascular invasion of hepatocellular carcinoma predicted by dynamic contrast-enhanced MRI, J Magn Reson Imaging. 2012’36: 641-47. https://doi.org/10.1002/jmri.23681.
[9] Zhang A, Hu Q, Song J, Dai Y, Wu D, Chen T. Value of non-Gaussian diffusion imaging with a fractional order calculus model combined with conventional MRI for differentiating histological types of cervical cancer. Magn Reson Imaging. 2022;93: 181-88. https://doi.org/10.1016/j.mri.2022.08.014.
Figures