2563
Simplified VERDICT diffusion imaging and modelling for efficient characterisation of prostate cancer1Centre for Medical Imaging, UCL, London, United Kingdom, 2Department of Radiology, University of Cambridge, Cambridge, United Kingdom, 3Centre for Medical Image Computing, UCL, London, United Kingdom
Synopsis
Keywords: Microstructure, Prostate
Motivation: VERDICT diffusion imaging and modelling for prostate cancer characterisation requires significant scan time which hinders its clinical practicality.
Goal(s): We aim to reduce the scan time requirement of VERDICT through paired model simplification and acquisition reduction whilst retaining model fitting accuracy and diagnostic performance.
Approach: We evaluated the model fitting accuracy and diagnostic performance of three simplified VERDICT schemes on 97 patients who underwent targeted biopsy.
Results: Our results demonstrate that a scan time reduction of ≈30% can be achieved with minimal impact to performance; model parameters were recovered with <5% mean bias and no significant change in diagnostic performance was observed.
Impact: Reducing the scan time of VERDICT diffusion imaging could help to enable integration of VERDICT into clinical practice which could help to reduce the number of healthy men referred for biopsy.
Introduction
VERDICT diffusion imaging utilises a three compartment model of prostate tissue microstructure to characterise lesions of prostate cancer (PCa)1,2. The intracellular volume fraction (fIC) found through model fitting has demonstrated superior ability to distinguish cases of clinically significant cancer compared to conventionally used ADC3. Addition of VERDICT to routine multiparametric MRI (mpMRI) could allow improved characterisation of suspicious lesions and could help to reduce the number of healthy men referred for biopsy.Image acquisition for the current VERDICT scheme consists of five diffusion images (b=90-3000 s/mm2) with combined scan time of 12 minutes. For integration with routine mpMRI, the scan time of VERDICT needs reduction. The b=3000 scan takes 3:25 min and has the lowest SNR so is a good candidate for removal. Further, model simplification may enable more robust fitting with fewer scans so could aid efficiency improvement. The vascular component of prostate tissue is small and predicted vascular signal is only appreciable for b⪅250 4. Thus, scans with b≥250 should be well described by the extracellular (EES) and intracellular (IC) compartments; model simplification could be sensibly achieved through simultaneous removal of the vascular compartment and the b=90 scan (0:40 min).
In this work, we evaluate the impact of model simplification and acquisition reduction on the fitting and diagnostic performance of fIC.
Materials and Methods
This work utilises in vivo VERDICT imaging, mpMRI reporting, and biopsy results from the INNOVATE clinical trial5 (NCT02689271). A subset (N=97/165) of the biopsied cohort was analysed with near equal split of biopsy result (47 positive vs 50 negative). Lesions of PCa with Gleason grade 3+4 or higher were classified as clinically significant (positive biopsy).Three simplified VERDICT schemes were evaluated retrospectively and compared to the current VERDICT scheme (orig). Scheme simplifications were: (1) exclusion of b3000 scan (ex3000); (2) removal of b90 scan and vascular compartment (noVASC); and (3) both (1) and (2) (noVASCex3000). The VERDICT-AMICO framework was implemented for model fitting6.
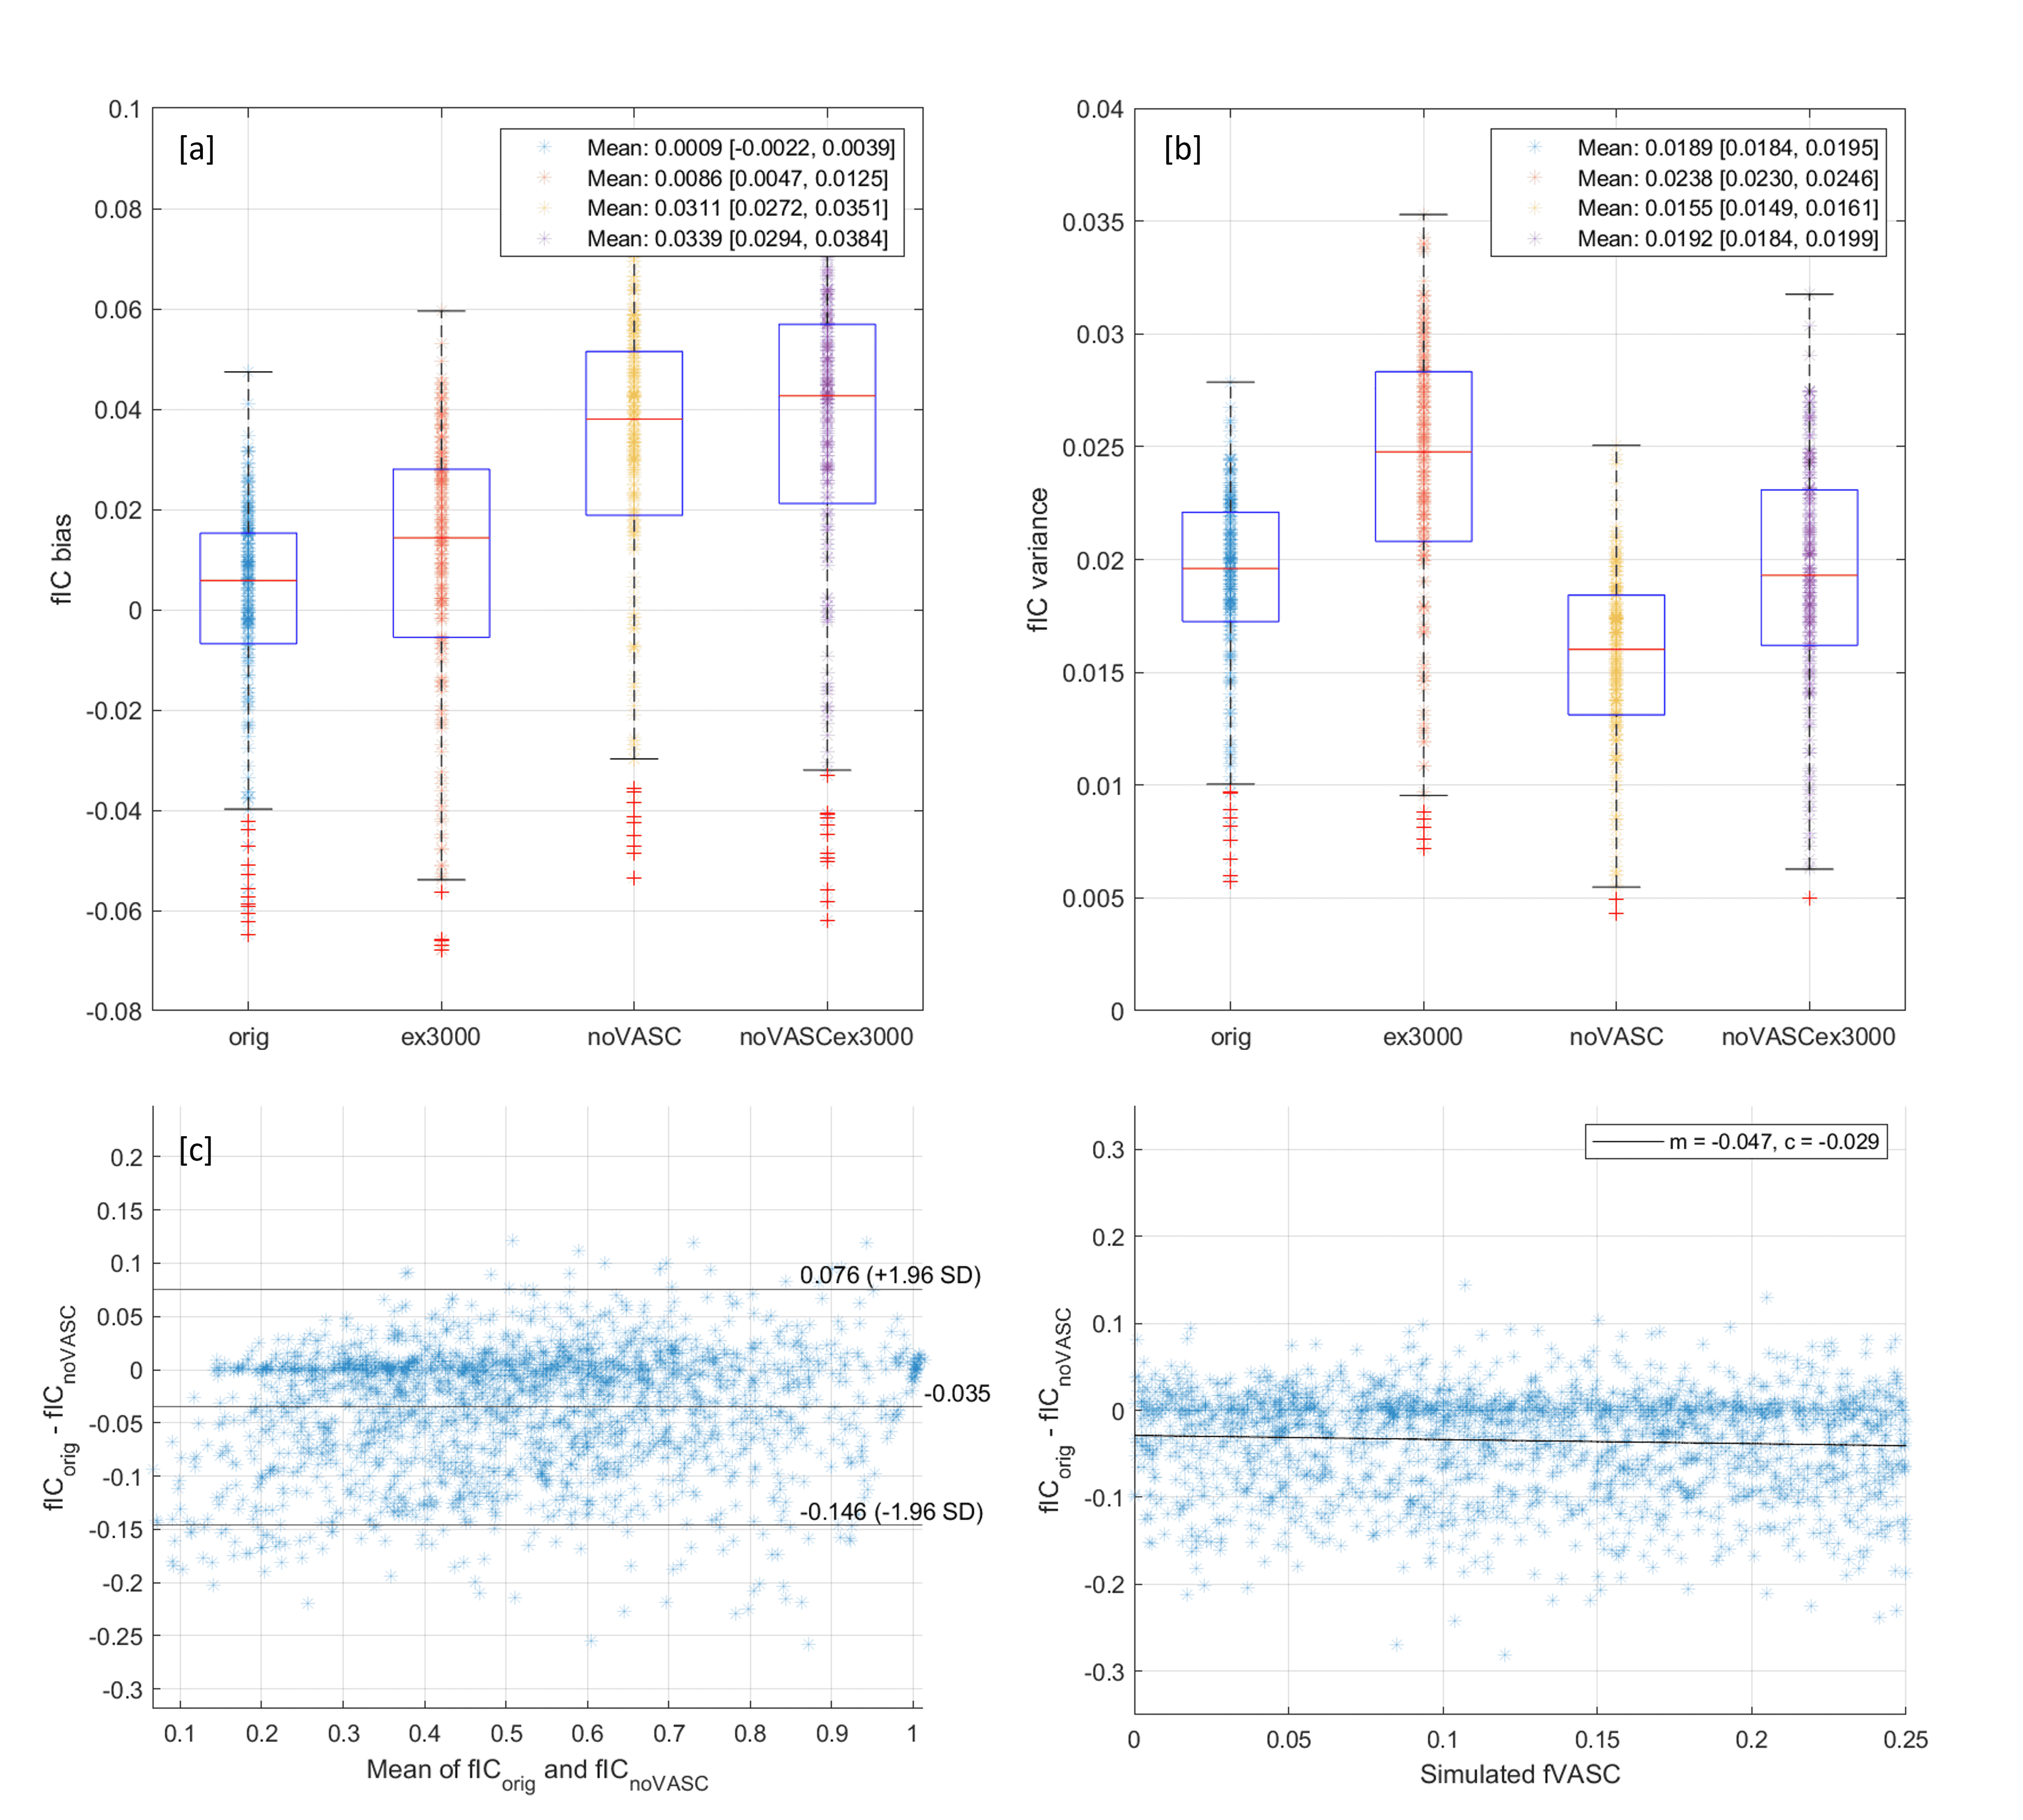
The fIC fitting performance of each simplified scheme was first evaluated through simulation. Diffusion signal was simulated for 200 voxels with randomised tissue parameters (fIC=[0.2,0.9], fVASC=[0.0,0.3], fEES=1-fIC-fVASC, 100 random cell radii R=[0.1,15.1]). For each voxel, fIC fitting bias and variance was evaluated over 200 Rician noise instances (b=0 SNR 20).
To evaluate in vivo performance, regions of interest (ROIs) were drawn around suspicious lesions from mpMRI reporting (TS). ROIs were transferred to the b=0 image acquired with the b3000 image and edited to account for distortion differences and patient motion (NT). This image was used as the registration target during processing so aligns with output fIC maps. For an unbiased comparison of schemes, ROIs were drawn and edited blind to fIC maps. A quantitative comparison of median lesion fIC and diagnostic performance was conducted between schemes.
Results and Discussion
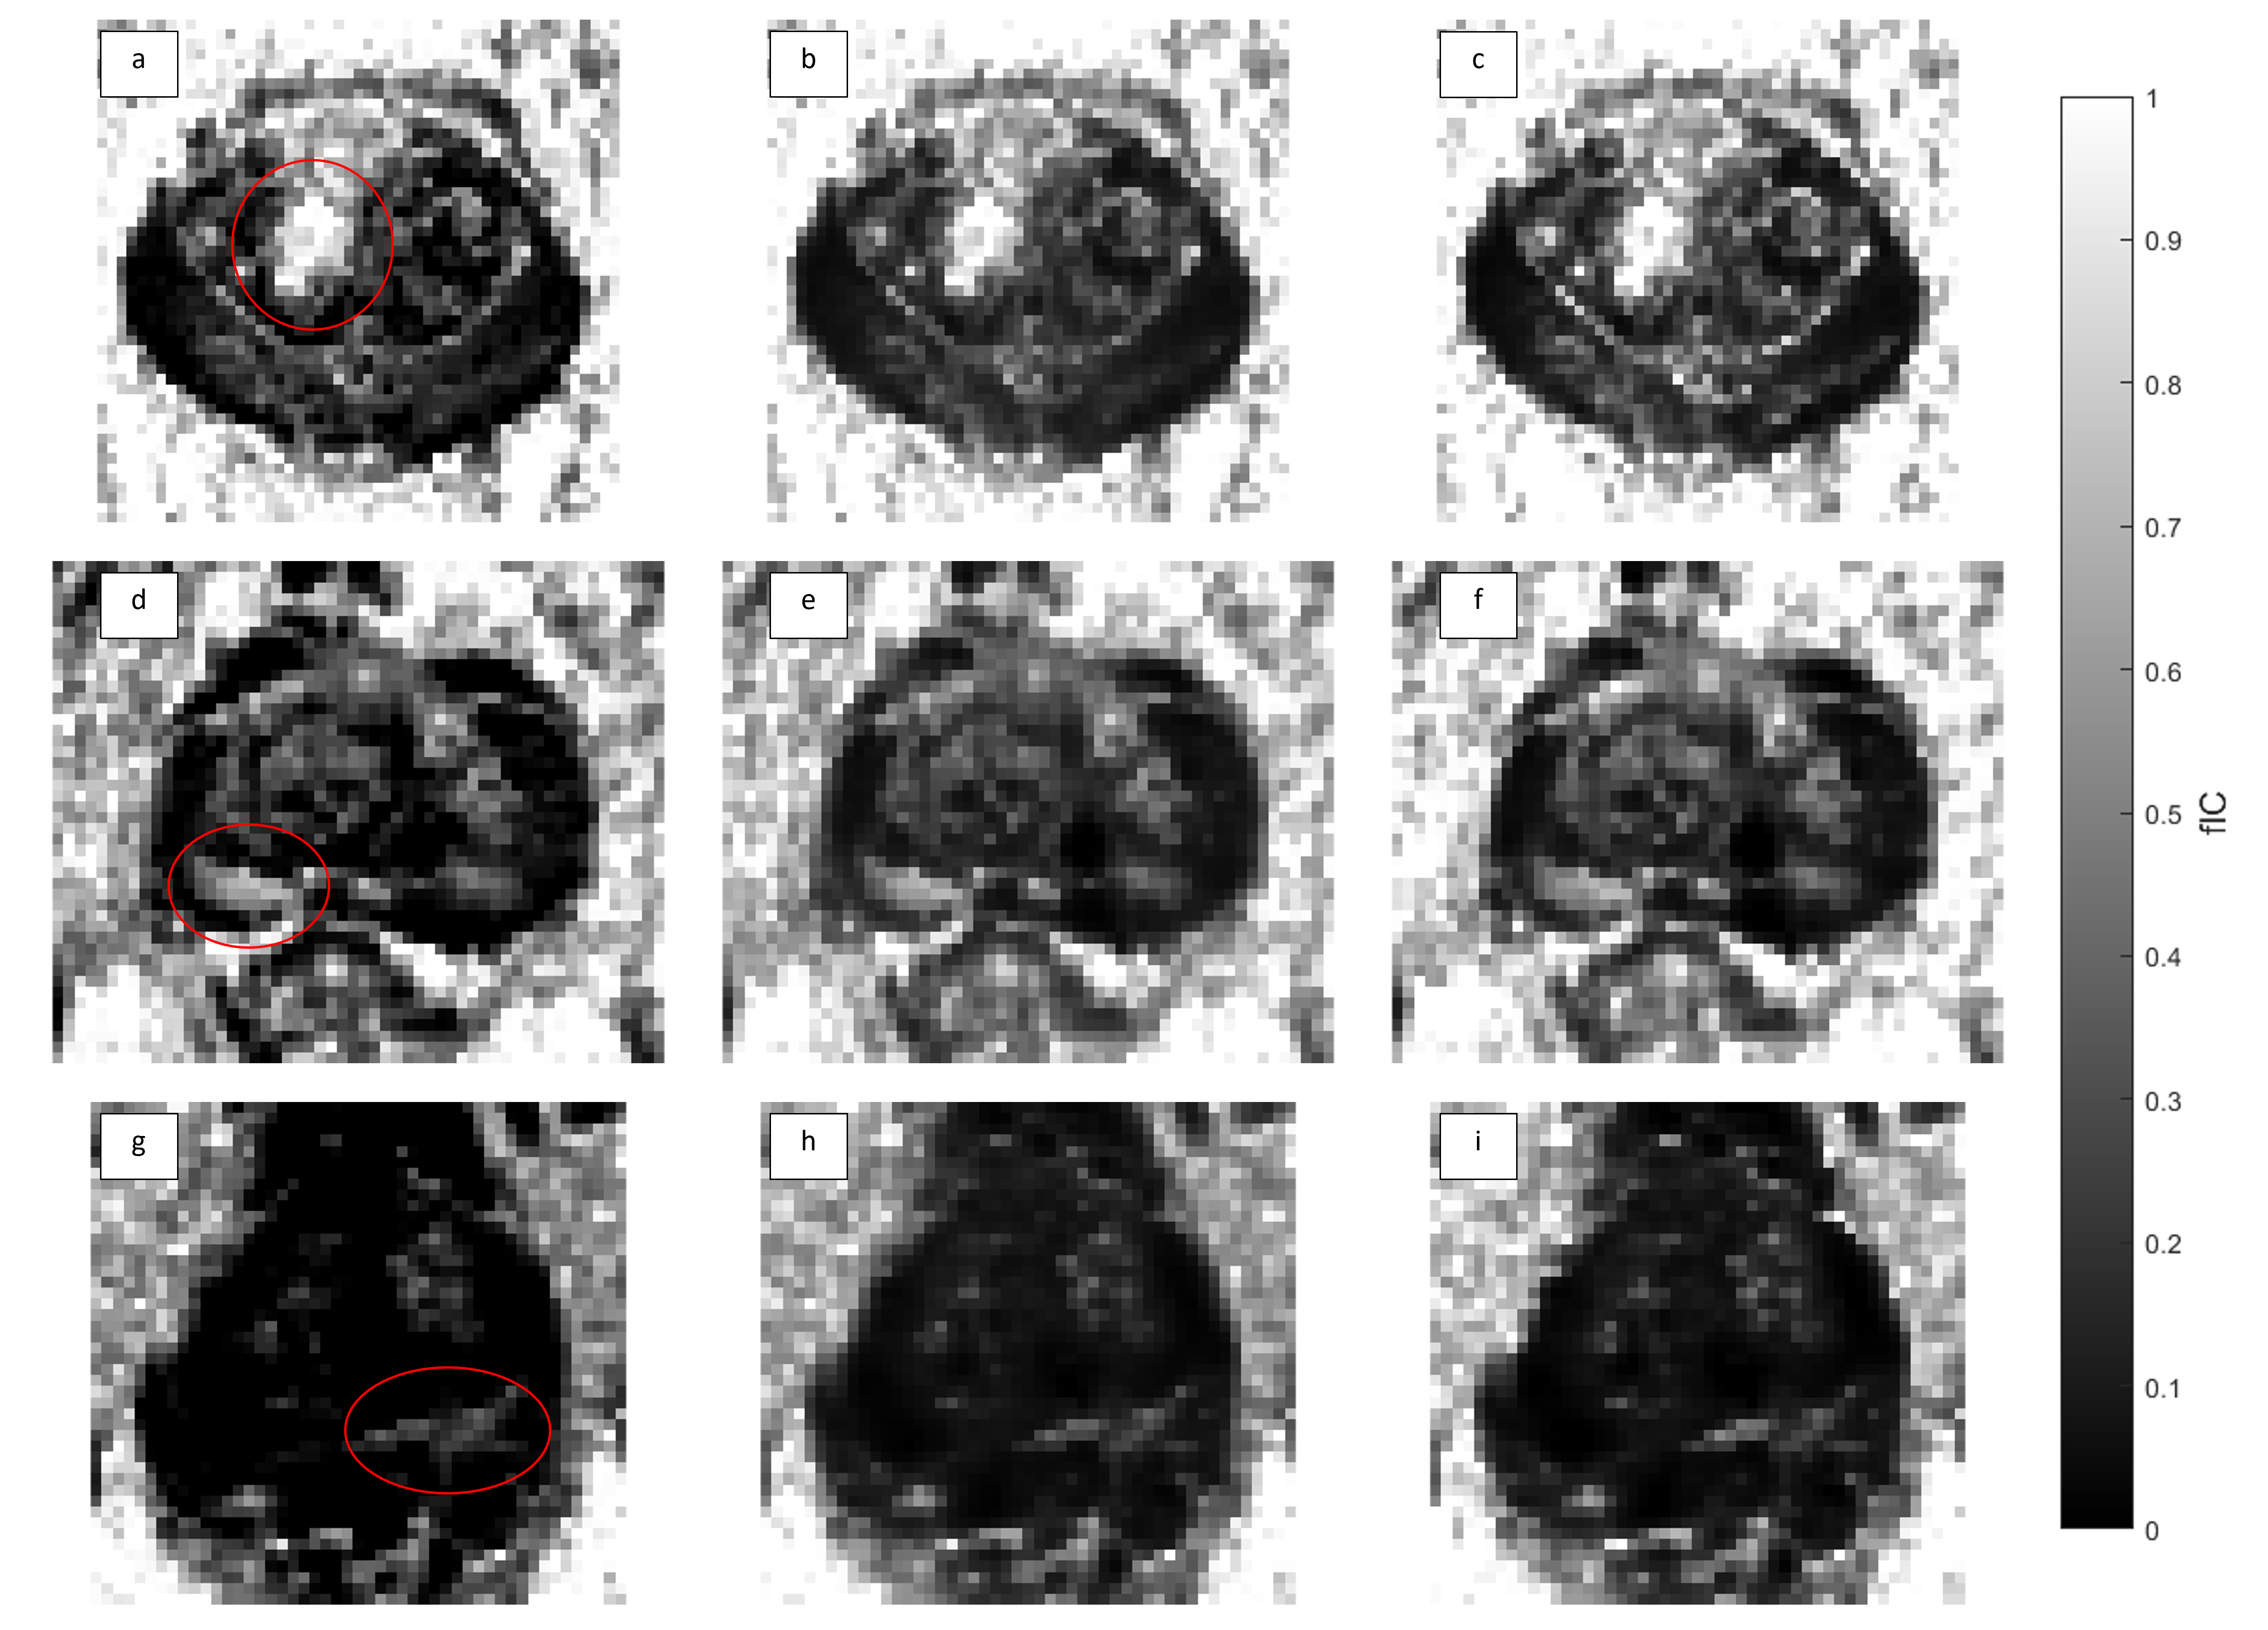
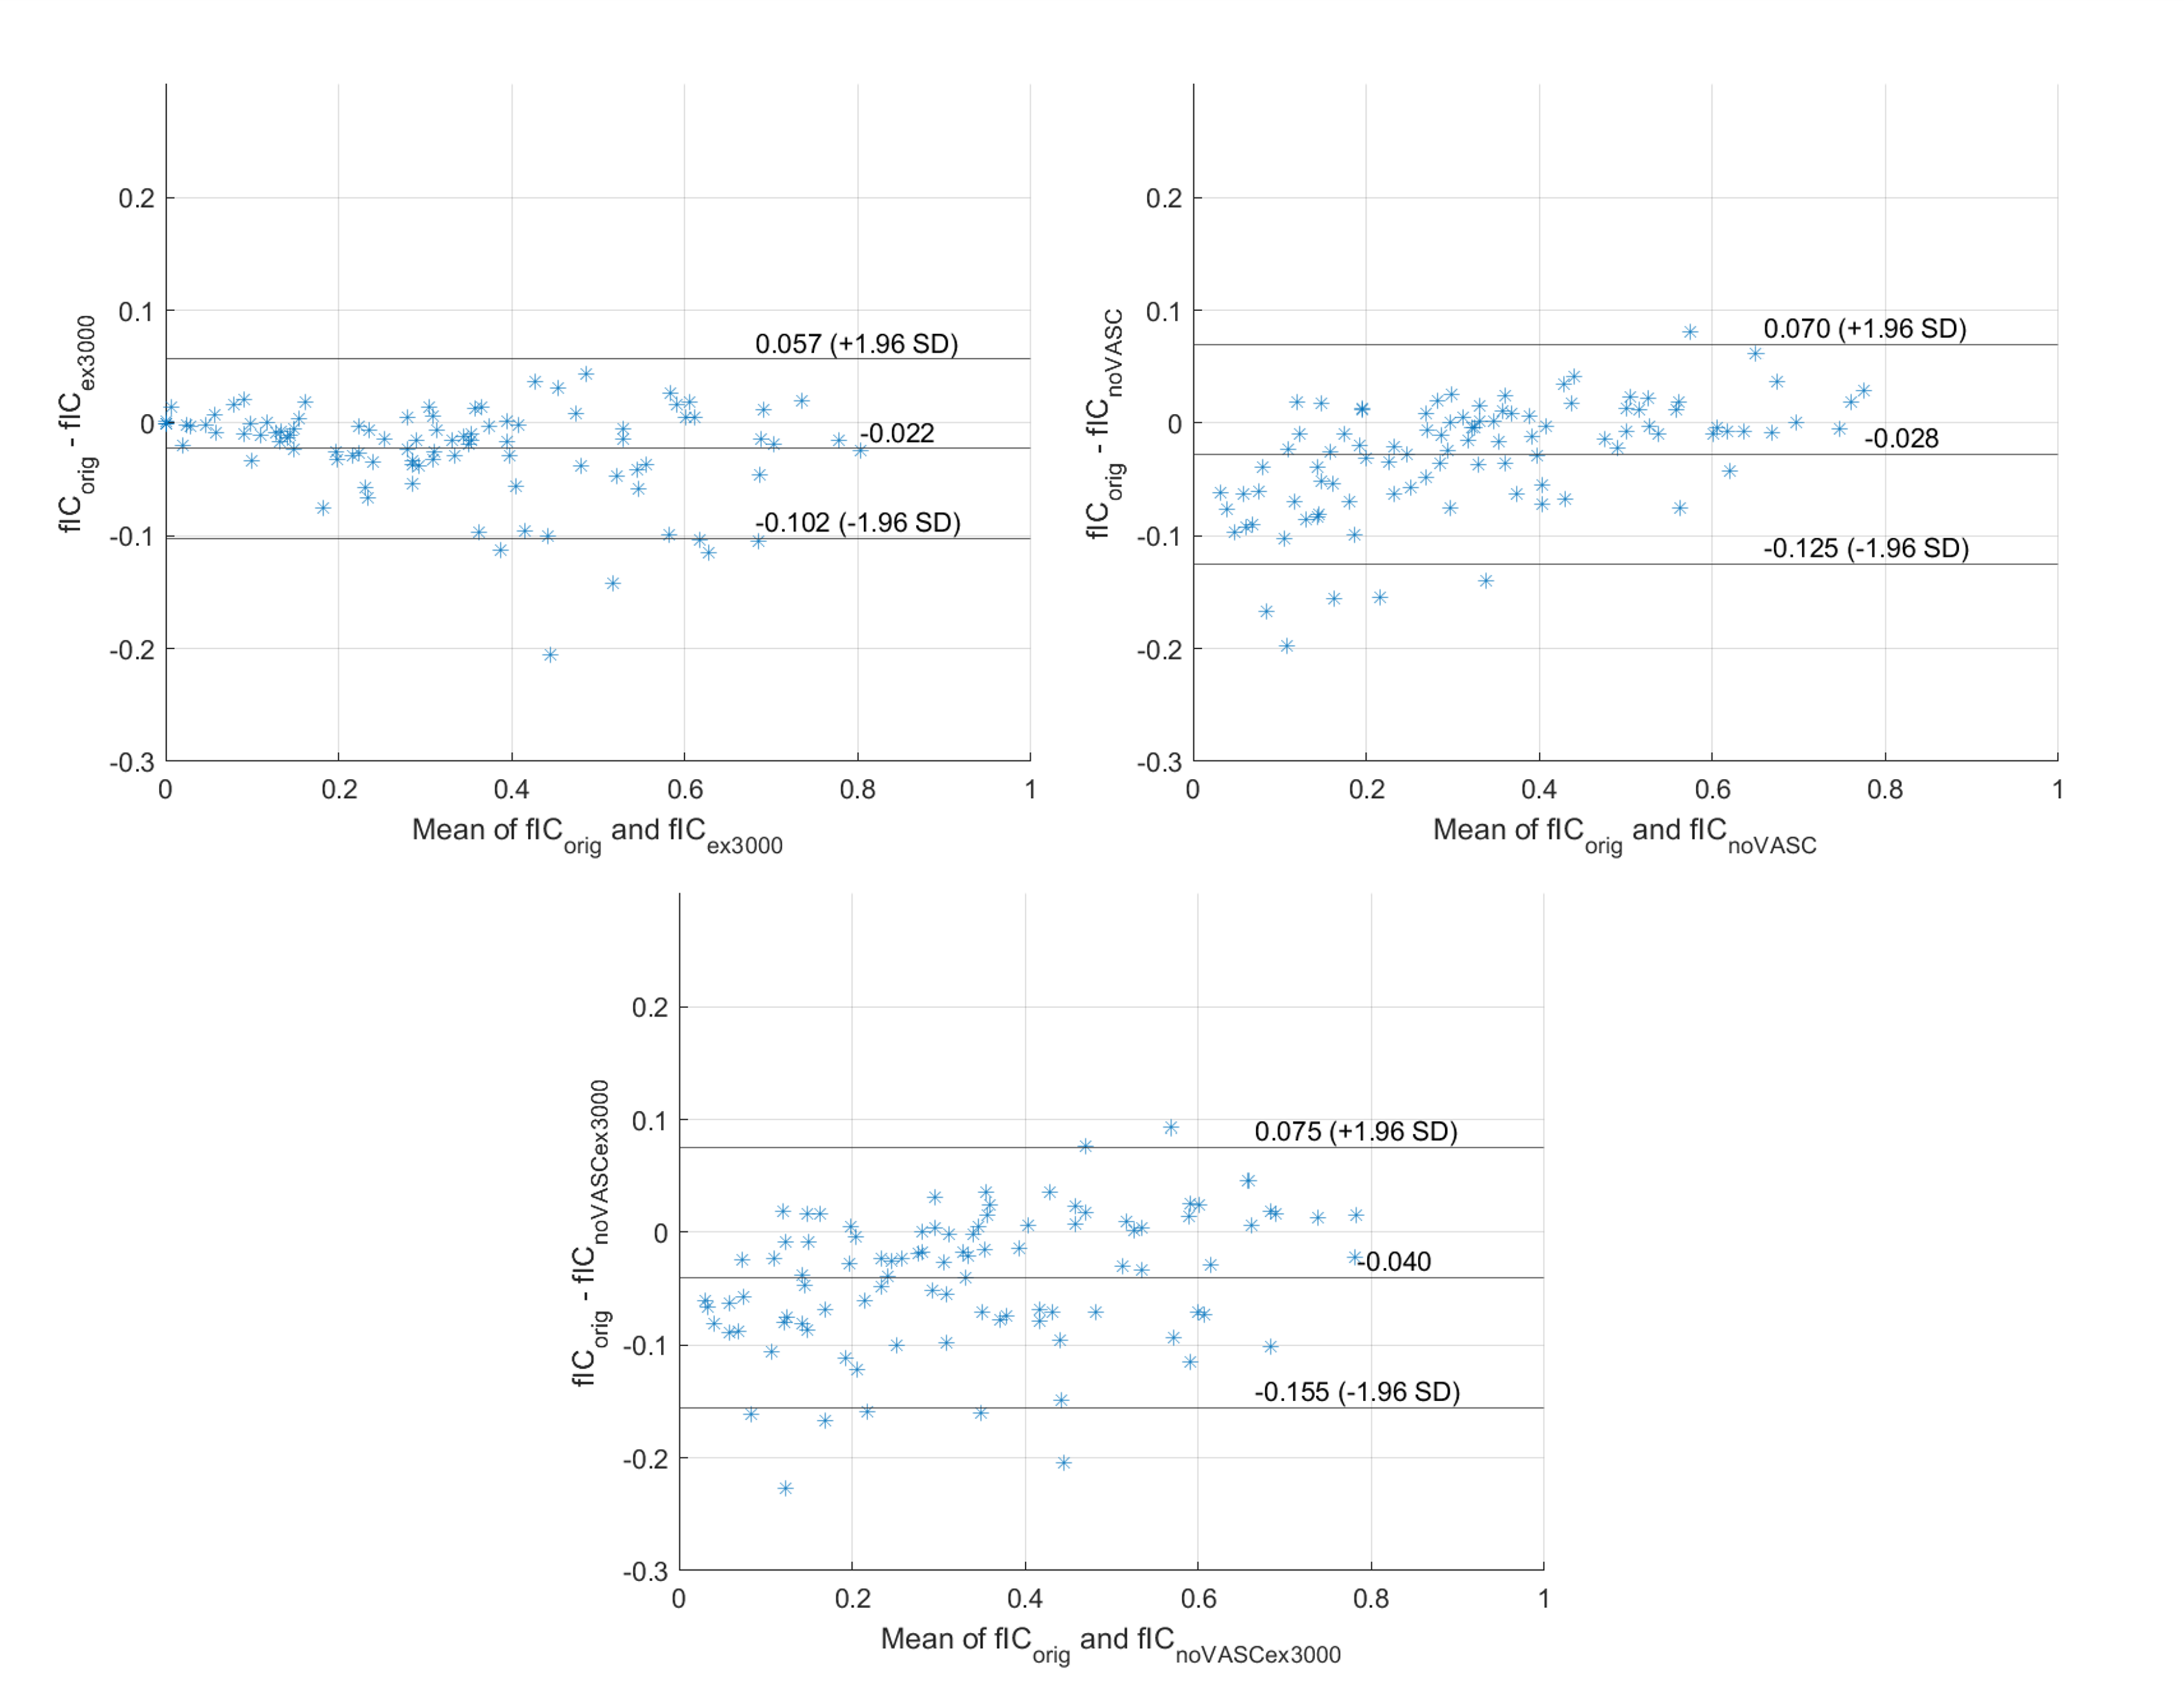
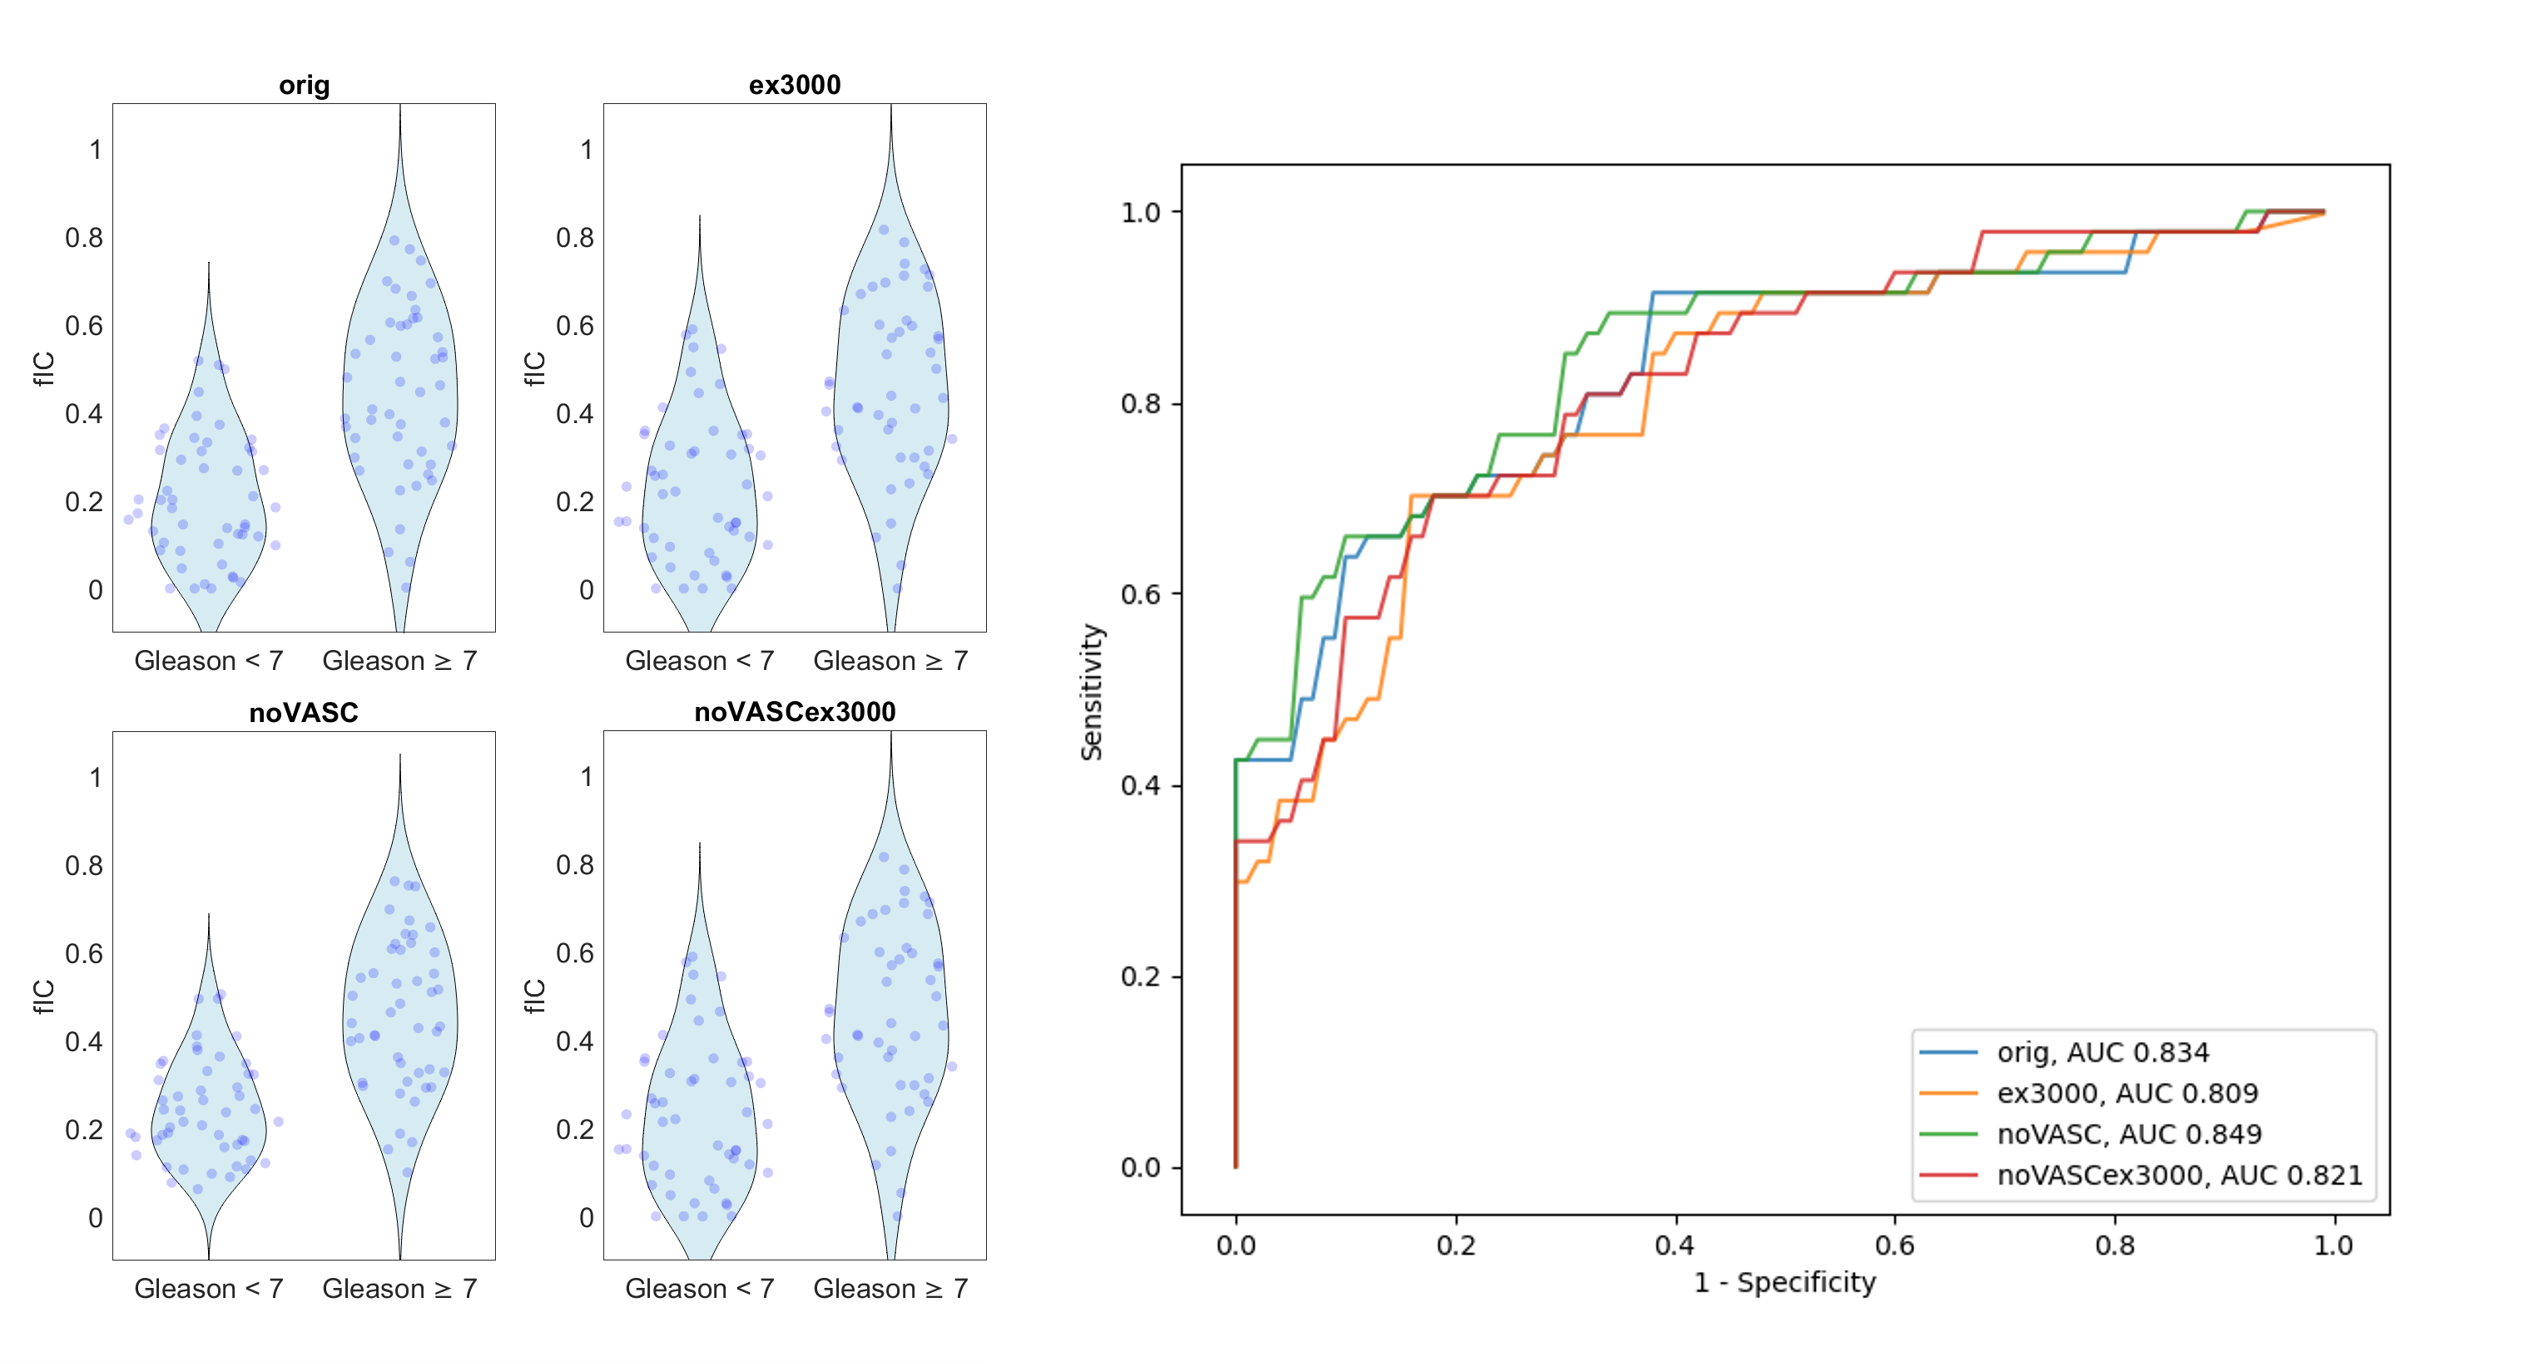
Figure 1 displays the results from simulation; notably, a reduced fitting variance is observed for ‘noVASC’ which indicates improved robustness to noise. The fitting variances of ‘orig’ and ‘noVASCex3000’ are comparable. A small positive bias is observed for fICs from ‘noVASC’ and ‘noVASCex3000’; however, these biases are small compared to the corresponding fIC fitting standard deviations and are largely independent of the simulated vascular volume fraction. Figure 3 illustrates that the in vivo fIC biases between schemes are small and consistent with simulation results (mean bias <5% of total volume fraction). A qualitative comparison of fIC maps also reveals consistency between schemes (Figure 2). These results indicate good agreement between fICs calculated from each scheme and suggest vascular signal is predominantly assigned to the extracellular compartment following model simplification.No significant difference in diagnostic performance is observed between schemes (Table 1, Figure 4). The fIC thresholds and specificities at 90% sensitivity obtained in this work are notably lower than those found in [3]. We speculate that this discrepancy can be primarily attributed to differences in the ROI drawing method used in [3] (unblind to fIC). Further, the current study analysed a subset of patients included in [3] so exact agreement was not expected. The large confidence intervals displayed in Table 1 illustrate high sensitivity to individual data points at this small patient cohort size. Future work will analyse a larger patient cohort, utilise multiple ROI drawers, and experiment with fIC-guided ROI drawing.
Conclusions
Our results indicate that both model simplification through removal of the vascular compartment and acquisition reduction through exclusion of b=90 and b=3000 scans have minimal impact on fIC fitting and diagnostic performance. These scheme simplifications offer a ≈30% reduction in scan time and could help to enable efficient integration of VERDICT imaging into routine mpMRI.Acknowledgements
EPSRC Centre for Doctoral Training i4Health (EP/S021930/1)
The INNOVATE study: Prostate Cancer UK (PG14-018-TR2)
References
1. Panagiotaki E, Walker-Samuel S, Siow B, et al. Noninvasive quantification of solid tumor microstructure using VERDICT MRI. Cancer Res. 2014;74(7):1902-1912. doi:10.1158/0008-5472.CAN-13-2511
2. Panagiotaki E, Chan RW, Dikaios N, et al. Microstructural Characterization of Normal and Malignant Human Prostate Tissue With Vascular, Extracellular, and Restricted Diffusion for Cytometry in Tumours Magnetic Resonance Imaging. Invest Radiol. 2015;50(4). doi: 10.1097/RLI.0000000000000115
3. Singh S, Rogers H, Kanber B, et al. Avoiding Unnecessary Biopsy after Multiparametric Prostate MRI with VERDICT Analysis: The INNOVATE Study. Radiology. 2022;305(3):623-630. doi:10.1148/radiol.212536
4. Le Bihan D. What can we see with IVIM MRI? Neuroimage. 2019;187:56-67. doi:10.1016/j.neuroimage.2017.12.062
5. Johnston E, Pye H, Bonet-Carne E, et al. INNOVATE: A prospective cohort study combining serum and urinary biomarkers with novel diffusion-weighted magnetic resonance imaging for the prediction and characterization of prostate cancer. BMC Cancer. 2016;16(1):816. doi:10.1186/s12885-016-2856-2
6. Bonet-Carne E, Johnston E, Daducci A, et al. VERDICT-AMICO: Ultrafast fitting algorithm for non-invasive prostate microstructure characterization. NMR Biomed. 2019;32(1). doi:10.1002/nbm.4019
Figures