2557
Evaluation of deep gray matter for early brain development usingmulti-parametric MR1Department of Radiology, The First Affiliated Hospital of Nanjing Medical University, Nanjing, China, 2Department of Pediatrics, The First Affiliated Hospital of Nanjing Medical University, Nanjing, China, 3United Imaging Healthcare Group, Shanghai, China
Synopsis
Keywords: Neonatal, Brain
Motivation: Few research has reported the differences of the T1, T2* and proton density (PD) values of multi-parametric magnetic resonance (MR) between healthy preterm and term neonates.
Goal(s): To evaluate T1, T2* and PD mapping of preterm and term neonate in the deep gray matter.
Approach: We performed MRI on a 3.0T MR scanner (Omega, United Imaging Health Care) using multi-parametric MR imaging with flexible design (MULTIPLEX) transverse axis sequence.
Results: T1 relaxation time showed significant differences in bilateral putamen (PT) and pallidus (GP) between preterm and term newborns and was negative correlated with gestational age (GA).
Impact: Our study demonstrated that the T1 relaxation time in deep gray matter nuclei decreased with GA, and the preterm showed higher T1 relaxation values than the term neonate in PT and GP at term equivalent age.
Introduction
Premature newborns are at high risk of neurodevelopmental disability, such as cerebral palsy, and cognitive and behavioral impairments1, even in the absence of evidence of brain damage2 on conventional magnetic resonance imaging (MRI). Therefore, identification of novel neuroimaging biomarkers that predict neurodevelopmental disability in premature infants would likely prove useful in guiding the treatment of premature neonates at higher risk. Scoring systems based on conventional MR images have been established and validated3-4, but it is rather subjective and shows unsatisfactory sensitivity5. Recently, some research has demonstrated that synthetic MR could quantitatively evaluate the development of the neonatal brain and the synthetic relaxometry is feasible to predict adverse outcomes6-7. However, few research has reported the differences in the T1, T2* and proton density (PD) mapping between healthy preterm and term neonates at term equivalent age (TEA), which is the basis for explaining the differences in disease groups.Methods
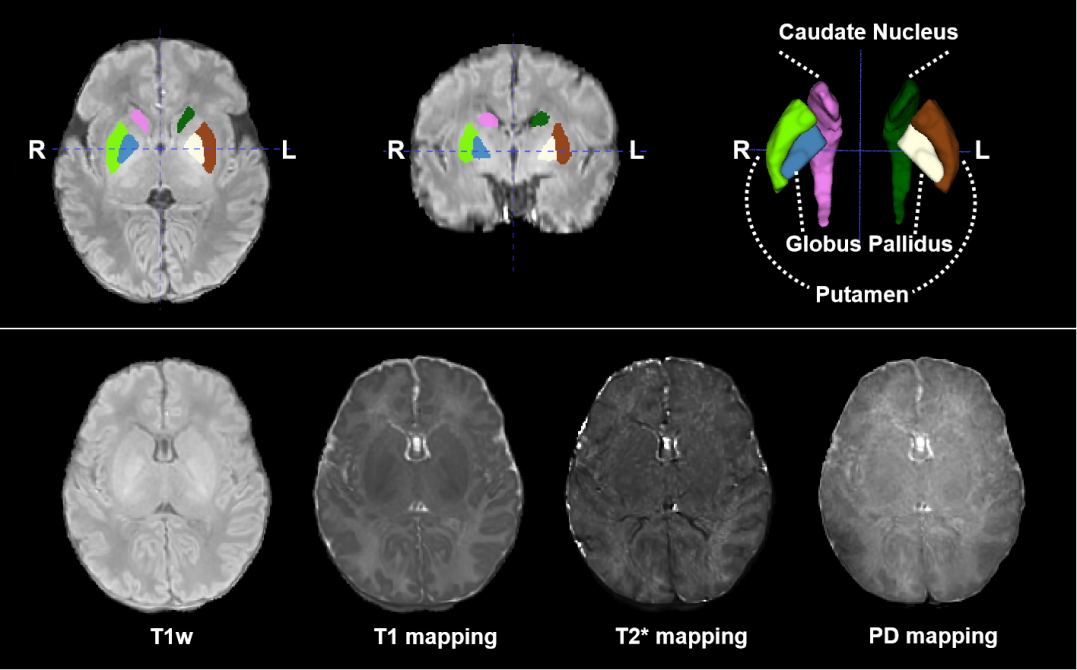
This retrospective study included 13 preterm and 14 term neonates between September 2022 to June 2023 who showed no evidence of brain injury on conventional head MR. All of them accepted multi-parametric MRI as part of their routine neonatal MRI exam at term equivalent age (TEA, range 37 to 42 weeks). Head MRI scans were performed on 3.0T MR scanner (Omega, United Imaging Healthcare, Shanghai, China) using a 48-channel head coil. Multi-parametric MR imaging with flexible design (MULTIPLEX)8 transverse axis sequence scans were performed (TR=38.3ms, TE=4.25ms, FOV=180×180mm, scan matrix = 256×256, voxel size = 0.7×0.7×2.0 mm3, 42 slices, acquisition time = 6 min 57 sec). T1, T2* relaxation time and PD mapping were measured using three-dimensional volumes of interest (VOIs) for the caudate nucleus (CN), globus pallidus (GP) and putamen (PT) (Figure 1). The mean value for each VOI was extracted and then compared between groups. Correlation analysis was also performed to evaluate the relationship between T1 relaxation values and gestational age (GA).Results
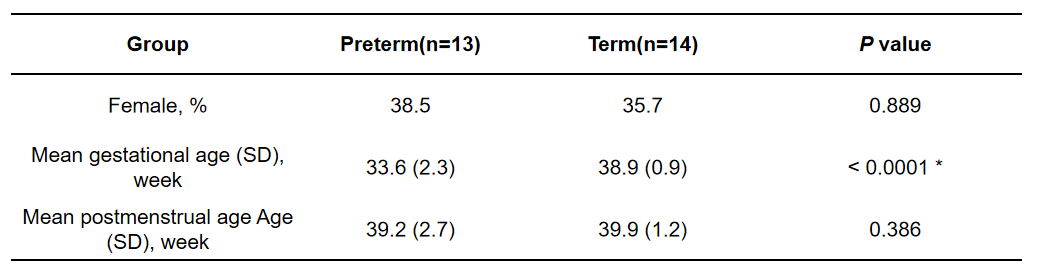
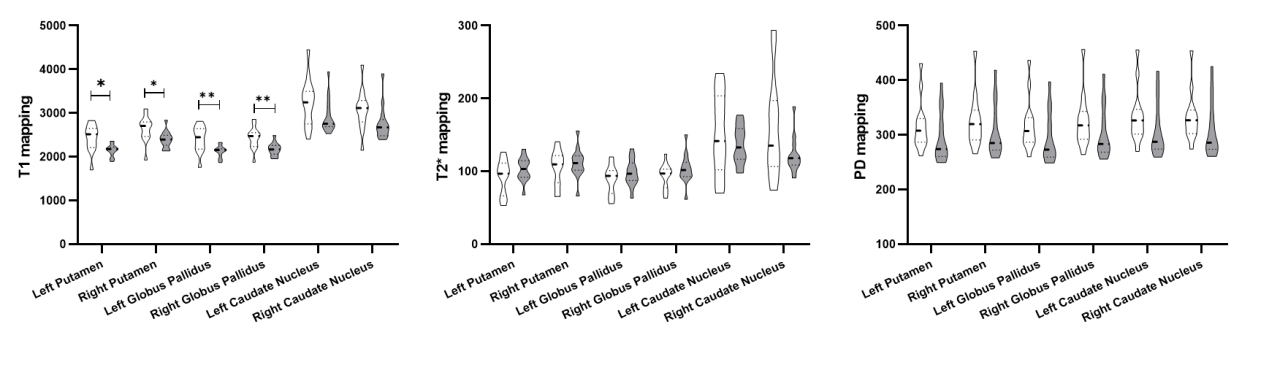
Demographic characteristics were shown in Figure 2. Significant differences in the T1 relaxation time of both left and right PT and GP were observed between the preterm and term group (all P<0.05) (Figure 3). T2* relaxation values and PD mapping of PT, GP or CN showed no significant differences between two groups. There was obvious correlation between the T1 relaxation time and GA in the bilateral PT (left: r = -0.580, P = 0.0015; right: r = -0.539, P = 0.0037), GP (left: r = -0.596, P = 0.0010; right: r = -0.620, P = 0.0006) as well as CN (left: r = -0.464, P = 0.0147; right: r = -0.488, P = 0.0098) (Figure 4).Discussion
In this study, we found that T1 relaxation time in deep gray matter nuclei decreased with GA, which was consistent with prior studies6,9. Because the deep gray matter nuclei, especially GP, are the regions with the highest nonheme iron content with the property of shortening T1 as it is the core of neural circuits related to motor function and cognition thus demand for higher iron concentrations. The dependence of T1 relaxation time on GA implies that GA should be taken into account before any interpretation of the relaxometry data of neonatal brains, even when standardized around TEA. T1 relaxation values of PT and GP were higher in preterm group than in term group. Iron storage in preterm neonates is lower compared with that in term neonates, and premature neonates with low birth weight are more at risk of iron deficiency because of their lower iron stores10. Moreover, the basal ganglia region is sensitive to ischemia and hypoxia. These may all contribute to the higher T1 relaxation values in the deep gray matter of preterm neonates. Previous study showed that compared to low-risk infants, patients at high-risk of neurodevelopmental impairment demonstrated prolonged T1 relaxation in deep gray matter9. The higher T1 relaxation values of preterm neonates may indicate that although no visual evidence of brain injury on conventional MRI, preterm neonates could have fine abnormal myelination.Conclusion
Multi-parametric-based relaxometry in the deep grey matter of healthy preterm and term neonates close to TEA showed age-related changes. Even no visual evidence of brain injury, the T1 relaxation values of deep grey matter still showed significant differences between preterm and term neonates at TEA.Acknowledgements
No acknowledgement found.References
1. Liu L, Oza S, Hogan D, Chu Y, Perin J, Zhu J, Lawn JE, Cousens S, Mathers C, Black RE (2016) Global, regional, and national causes of under-5 mortality in 2000-15: an updated systematic analysis with implications for the Sustainable Development Goals. Lancet (London, England) 388:3027-3035.
2. Rogers CE, Lean RE, Wheelock MD, Smyser CD (2018) Aberrant structural and functional connectivity and neurodevelopmental impairment in preterm children. Journal of neurodevelopmental disorders 10:38.
3. George JM, Fiori S, Fripp J, Pannek K, Bursle J, Moldrich RX, Guzzetta A, Coulthard A, Ware RS, Rose SE, Colditz PB, Boyd RN (2017) Validation of an MRI Brain Injury and Growth Scoring System in Very Preterm Infants Scanned at 29- to 35-Week Postmenstrual Age. AJNR Am J Neuroradiol 38:1435-1442.
4. Kidokoro H, Neil JJ, Inder TE (2013) New MR imaging assessment tool to define brain abnormalities in very preterm infants at term. AJNR Am J Neuroradiol 34:2208-2214.
5. Van't Hooft J, van der Lee JH, Opmeer BC, Aarnoudse-Moens CS, Leenders AG, Mol BW, de Haan TR (2015) Predicting developmental outcomes in premature infants by term equivalent MRI: systematic review and meta-analysis. Systematic reviews 4:71.
6. Dong Y, Deng X, Xie M, Yu L, Qian L, Chen G, Zhang Y, Tang Y, Zhou Z, Long L (2023) Gestational age-related changes in relaxation times of neonatal brain by quantitative synthetic magnetic resonance imaging. Brain and behavior 13:e3068.
7. Kim JS, Cho HH, Shin JY, Park SH, Min YS, Park B, Hong J, Park SY, Hahm MH, Hwang MJ, Lee SM (2023) Diagnostic performance of synthetic relaxometry for predicting neurodevelopmental outcomes in premature infants: a feasibility study. Eur Radiol 33:7340-7351.
8. Ye Y, Lyu J, Hu Y, Zhang Z, Xu J, Zhang W (2021) MULTI‐parametric MR imaging with fLEXible design (MULTIPLEX). MAGNETIC RESONANCE IN MEDICINE 87:658-673.
9. Vanderhasselt T, Zolfaghari R, Naeyaert M, Dudink J, Buls N, Allemeersch GJ, Raeymaekers H, Cools F, de Mey J (2021) Synthetic MRI demonstrates prolonged regional relaxation times in the brain of preterm born neonates with severe postnatal morbidity. Neuroimage Clin 29:102544.
10. Takala TI, Mäkelä E, Suominen P, Matomäki J, Lapinleimu H, Lehtonen L, Rajamäki A, Irjala K, Lähteenmäki PM (2010) Blood cell and iron status analytes of preterm and full-term infants from 20 weeks onwards during the first year of life. Clinical chemistry and laboratory medicine 48:1295-1301.
Figures