2556
Diagnostic value of adenohypophyseal magnetic resonance imaging features in girls with precocious puberty1Department of Radiology, Tongji Hosptial, Tongji Medical College, Huazhong University of Science and Technology, Wu han, China, 2MR Research, GE Healthcare, Bei jing, China
Synopsis
Keywords: Normal Development, Pediatric, Diagnosis; Precocious puberty.
Motivation: Gonadotropin-releasing hormone (GnRH) stimulation test is time- and labor- consuming. A prediction model composed of MRI-derived variables for precocious puberty is useful for diagnosis.
Goal(s): This study aimed to evaluate the diagnostic value of adenohypophyseal MRI features for precocious puberty in girls.
Approach: Pearson correlation and stepwise multivariate linear regression analysis were used to examine the best association of MRI features and clinical data for 126 girls and build prediction models.
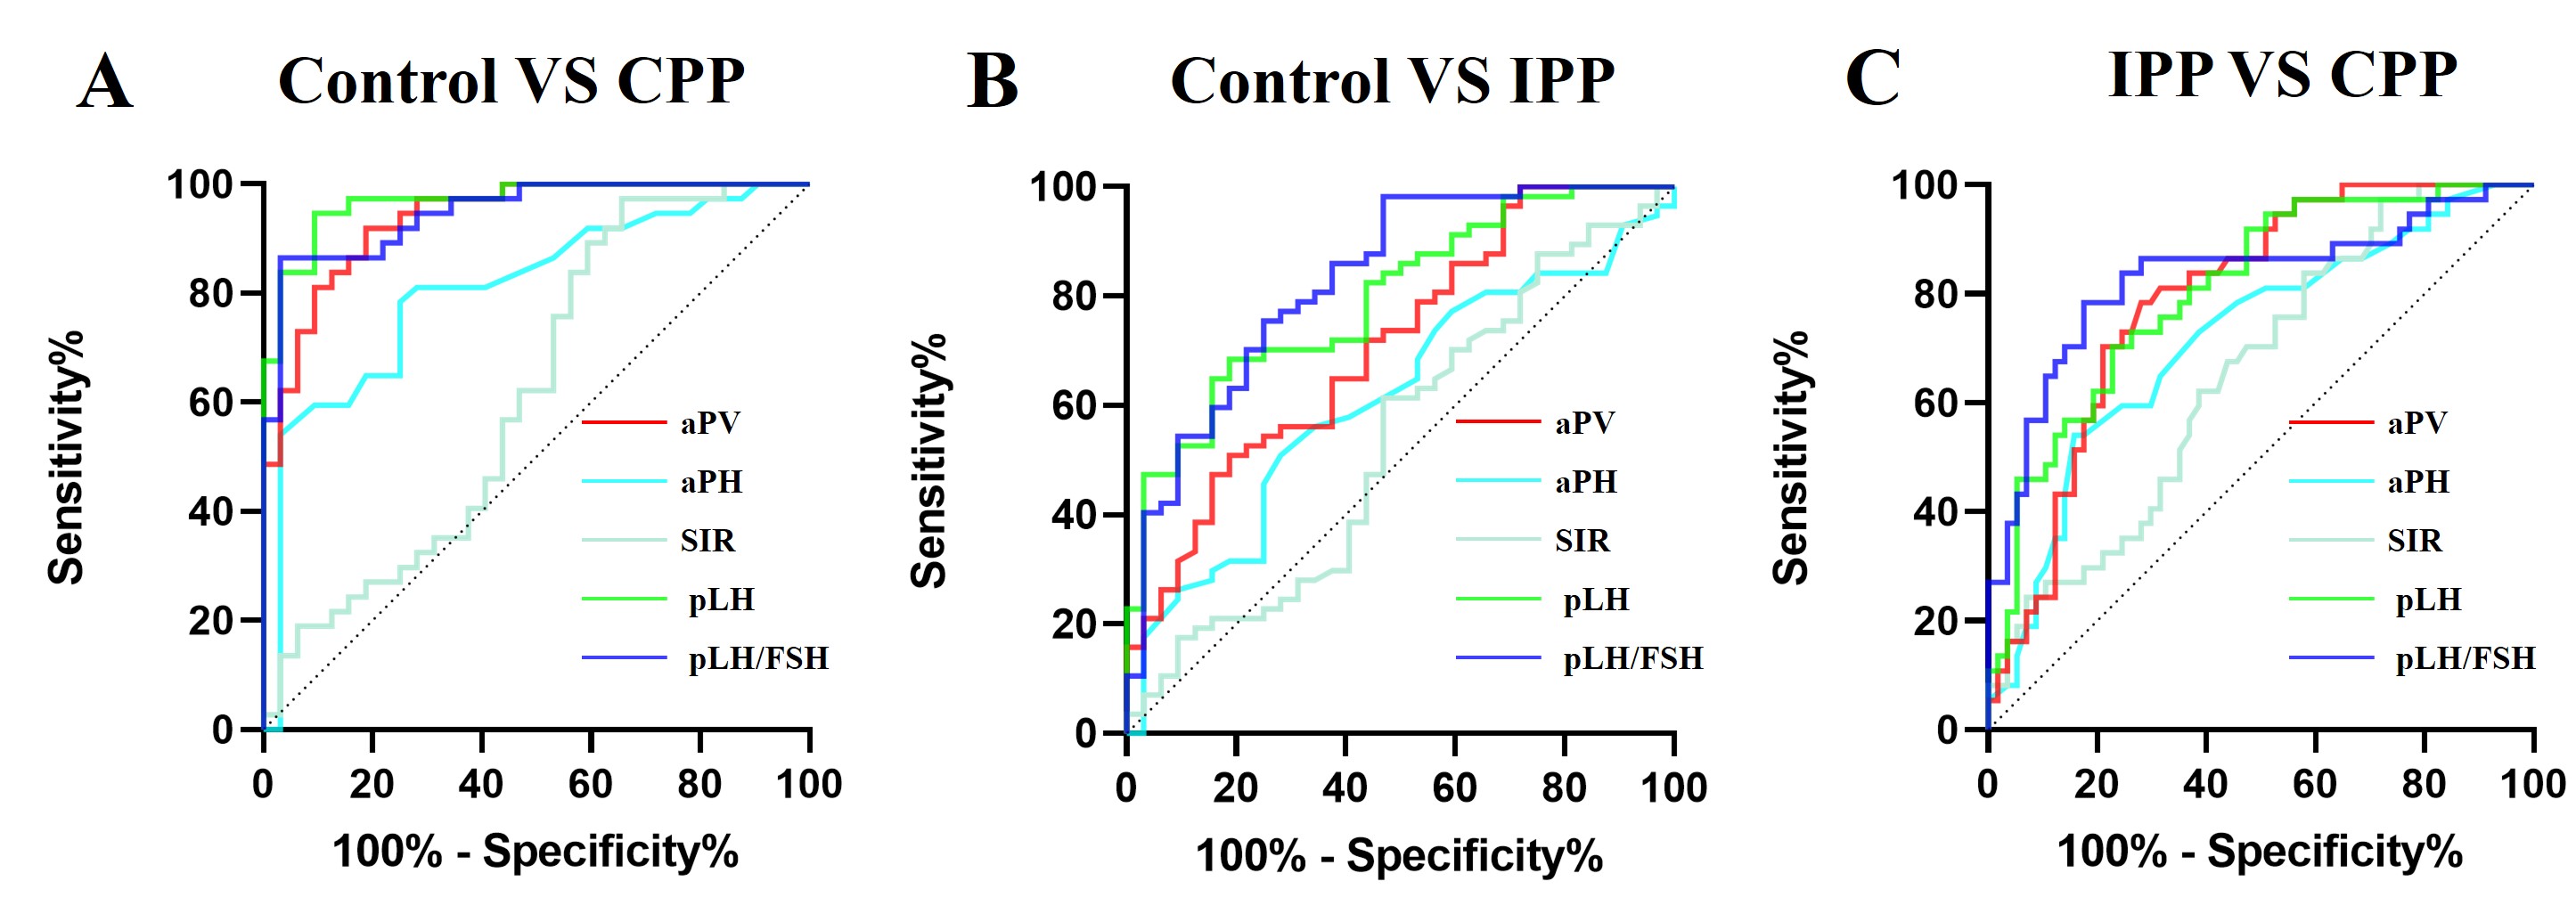
Results: Two Models were built to predict LH and LH/FSH. ROC analysis showed the predicted LH, predicted LH/FSH, and aPV were the top 3 best predictors in distinguishing CPP group from controls.
Impact: The adenohypophysis volume itself and the prediction models including main adenohypophyseal MRI features increased diagnosis efficiency for PP and offered a non-invasive and credible diagnostic method.
Background and Purpose
Precocious puberty (PP) is clinically defined by the development of secondary sexual characteristics before the age of 8 years in girls. The peak value of luteinizing hormone exceeding 5 mUI/ml after GnRH analogue stimulation indicates activation of the HPG axis and the peak of both luteinizing hormone to follicle-stimulating hormone ratio (LH/FSH) over 0.6 indicates CPP. Moreover, incomplete PP (IPP) is defined as premature thelarche, premature pubarche, and isolated menarche with incomplete activation of the HPG axis when secondary sexual characteristics occur. To early detect the progression of PP is important in clinical diagnosis.GnRH stimulation test is invasive and relatively high-cost and requires clinician prescription and multiple samplings. Frequent blood collection can impose a psychological burden on pediatric patients and also cause financial and time-related implications. The height and shape of the pituitary gland on sellar MRI revealed significant correlations with the weight, height, Tanner stage, and LH levels of CPP patients. but the roles of MRI features and correlations with hormones still remain unclear for PP diagnosis.
The objective of this study was to develop and evaluate the diagnostic efficacy of adenohypophysis MRI features and laboratory testing characteristics in PP girls and also establish a prediction model composed of MRI-derived variables for PP.
Materials and Methods
A total of 126 girls (37, 57 and 32 girls clinically diagnosed as patients with central PP [CPP] and incomplete PP [IPP], and controls) were enrolled in this study. Data in the three groups were collected and analyzed using analysis of variance. Pearson correlation and stepwise multivariate linear regression analysis were used to examine the association and build prediction models. ROC analysis was used to evaluate the diagnostic efficacy.Results
Correlations between adenohypophyseal MRI features (aPV, aPH, and SIR) and main clinical data (Height and Weight) and GnRH agonist stimulation test results (LHpeak and LH/FSH)Pearson correlation analysis demonstrated that aPV, aPH, Height and Weight were positively associated with LHpeak and LH/FSH (all P < 0.001) while SIR was positively associated with LH/FSH (P = 0.021). The stepwise multivariate linear regression analysis showed predicted LH values (pLH) using aPV, Weight, and aPH as contributors in model 1(R2 = 0.271) : $$pLH=0.045×aPV+0.484×Weight+1.567×aPH-21.001
and predicted LH/FSH values (pLH/FSH) using SIR, aPV, and Height as contributors in model 2 (R2 = 0.311) : $$pLH/FSH=-0.042×SIR+0.002×aPV+0.034×Height-3.686
ROC curves of adenohypophyseal MRI features (aPV, aPH, and SIR) and predicted values (pLH and pLH/FSH) in the three groups
Between the control and CPP groups, the best predictor was pLH with the AUC (with 95% confidence intervals [CIs]) of 0.969 (0.934-1.000). Between the control and IPP groups, the best predictor was pLH/FSH with the AUC (with 95% CIs) was 0.829 (0.739-0.919), the best sensitivity of 98.25% (90.71%, 99.91%) and the best NPV of 94.4% (70.3%, 99.2%). Between the IPP and CPP groups, the best predictor was pLH/FSH with the AUC (with 95% CIs) of 0.828 (0.736, 0.921).
For distinguishing heathy girls from PP, pLH, pLH/FSH and aPV had credible values while for distinguishing different periods of PP, pLH and pLH/FSH had credible values. aPV showed the best diagnostic value among three groups when using adenohypophyseal MRI features alone, but SIR showed the best sensitivity.
Discussion
Our study found clinical data, adenohypophyseal MRI features and laboratory testing characteristics can reflect PP, assisting us to better comprehend the sophisticated biological process of sexual development and the activation of the HPG axis. Adenohypophyseal MRI features alone had a reliable diagnostic value in identification of precocious puberty. However, a predicted model including both clinical data and adenohypophyseal MRI features built with multivariate linear regression analysis showed better diagnostic efficacy to discriminate IPP from CPP.Owing to the disadvantages of the GnRH stimulation testing, numerous studies have attempted to simplify its procedure or explore alternative methods. MRI is the preferred approach to evaluate the pituitary gland and is conducted in many tertiary care centers to exclude brain abnormalities in CPP-confirmed girls. ROC curves showed aPV could only distinguish CPP from the control groups even with AUC, sensitivity and specificity of 0.938, 91.89% and 81.25% at the cutoff value of 207.3 mm3, but not between any other two groups. The built model 2 in prediction of pLH/FSH showed the good to best diagnostic performance with AUC of 0.949 between CPP and control groups, 0.829 between IPP and control groups, and 0.828 between CPP and IPP groups.
In conclusions, the adenohypophysis volume itself and the prediction models including main adenohypophyseal MRI features increased diagnosis efficiency for PP and offered a non-invasive and credible diagnostic method.
Acknowledgements
No acknowledgement found.References
1. Latronico AC, Brito VN, Carel JC. Causes, diagnosis, and treatment of central precocious puberty. Lancet Diabetes Endocrinol. 2016 Mar;4(3):265-274. doi: 10.1016/S2213-8587(15)00380-0.2. Parent AS, Teilmann G, Juul A, Skakkebaek NE, Toppari J, Bourguignon JP. The timing of normal puberty and the age limits of sexual precocity: variations around the world, secular trends, and changes after migration. Endocr Rev. 2003 Oct;24(5):668-93. doi: 10.1210/er.2002-0019.
3. Teilmann G, Pedersen CB, Jensen TK, Skakkebaek NE, Juul A. Prevalence and incidence of precocious pubertal development in Denmark: an epidemiologic study based on national registries. Pediatrics. 2005 Dec;116(6):1323-8. doi: 10.1542/peds.2005-0012.
4. Chen M, Eugster EA. Central Precocious Puberty: Update on Diagnosis and Treatment. Paediatr Drugs. 2015 Aug;17(4):273-81. doi: 10.1007/s40272-015-0130-8.
5. Khan SH, Chaudhry N. Beyond GnRH, LH and FSH: The role of kisspeptin on hypothalalmic-pituitary gonadal (HPG) axis pathology and diagnostic consideration. J Pak Med Assoc. 2021 Jul;71(7):1862-1869. doi: 10.47391/JPMA.133.
6. Navarro VM. Metabolic regulation of kisspeptin - the link between energy balance and reproduction. Nat Rev Endocrinol. 2020 Aug;16(8):407-420. doi: 10.1038/s41574-020-0363-7. Epub 2020 May 19.
7. Fuqua JS. Treatment and outcomes of precocious puberty: an update. J Clin Endocrinol Metab. 2013 Jun;98(6):2198-207. doi: 10.1210/jc.2013-1024.
8. Klein DA, Emerick JE, Sylvester JE, Vogt KS. Disorders of Puberty: An Approach to Diagnosis and Management. Am Fam Physician. 2017 Nov 1;96(9):590-599.
9. Khokhar A, Mojica A. Premature Thelarche. Pediatr Ann. 2018 Jan 1;47(1):e12-e15. doi: 10.3928/19382359-20171214-01.
10. Li J, Sun Y, Mo S, Wang S, Luo W. Effects of oral contraceptive for different responder women before GnRH antagonists: a systematic review and meta-analysis. Gynecol Endocrinol. 2021 Nov;37(11):977-986. doi: 10.1080/09513590.2021.1918664.
11. Kim HK, Kee SJ, Seo JY, Yang EM, Chae HJ, Kim CJ. Gonadotropin-releasing hormone stimulation test for precocious puberty. Korean J Lab Med. 2011 Oct;31(4):244-9. doi: 10.3343/kjlm.2011.31.4.244. Epub 2011 Oct 3.
12. Chapman PR, Singhal A, Gaddamanugu S, Prattipati V. Neuroimaging of the Pituitary Gland: Practical Anatomy and Pathology. Radiol Clin North Am. 2020 Nov;58(6):1115-1133. doi: 10.1016/j.rcl.2020.07.009.
13. Pedicelli S, Alessio P, Scirè G, Cappa M, Cianfarani S. Routine screening by brain magnetic resonance imaging is not indicated in every girl with onset of puberty between the ages of 6 and 8 years. J Clin Endocrinol Metab. 2014 Dec;99(12):4455-61. doi: 10.1210/jc.2014-2702.
14. Park SY, Lee NY, Jung MH, Lim GY. Dedicated sellar magnetic resonance imaging protocols without contrast enhancement in girls with central precocious puberty: prevalence of pathologic lesions and clinical correlation. Arch Endocrinol Metab. 2021 Nov 24;65(6):758-767.
15. Mogensen SS, Aksglaede L, Mouritsen A, et al. Pathological and incidental findings on brain MRI in a single-center study of 229 consecutive girls with early or precocious puberty. PLoS One. 2012;7(1):e29829. doi:10.1371/journal.pone.0029829
16. Cisternino M, Arrigo T, Pasquino AM, et al. Etiology and age incidence of precocious puberty in girls: a multicentric study. J Pediatr Endocrinol Metab. 2000;13 Suppl 1:695-701. doi:10.1515/jpem.2000.13.s1.695
17. Elster AD, Chen MY, Williams DW 3rd, Key LL. Pituitary gland: MR imaging of physiologic hypertrophy in adolescence. Radiology. 1990 Mar;174(3 Pt 1):681-5. doi: 10.1148/radiology.174.3.2305049.
18. Sari S, Sari E, Akgun V, et al. Measures of pituitary gland and stalk: from neonate to adolescence. J Pediatr Endocrinol Metab. 2014;27(11-12):1071-1076. doi:10.1515/jpem-2014-0054
Figures
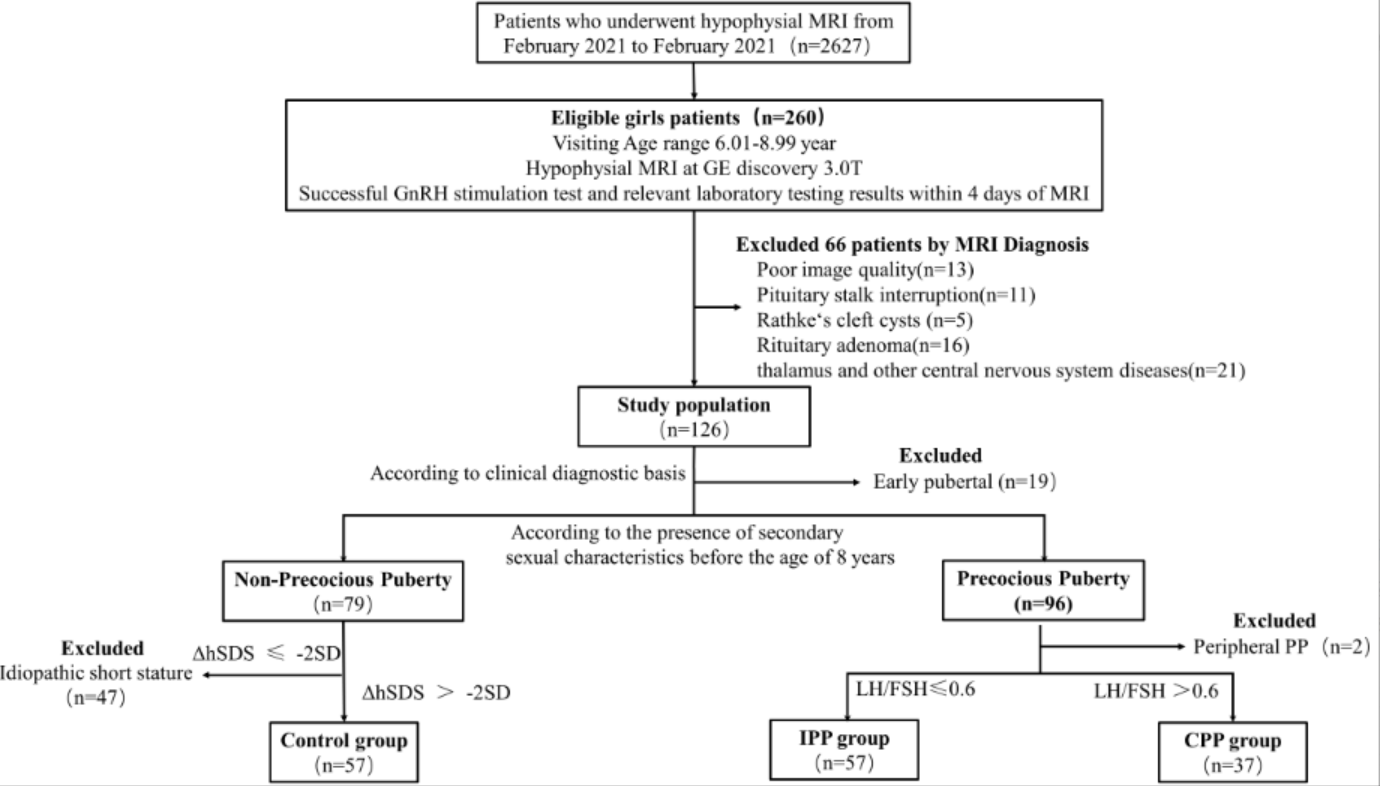
Figure 1. Flowchart of participant selection criteria.
IPP = Incomplete precocious puberty, CPP = Central precocious puberty
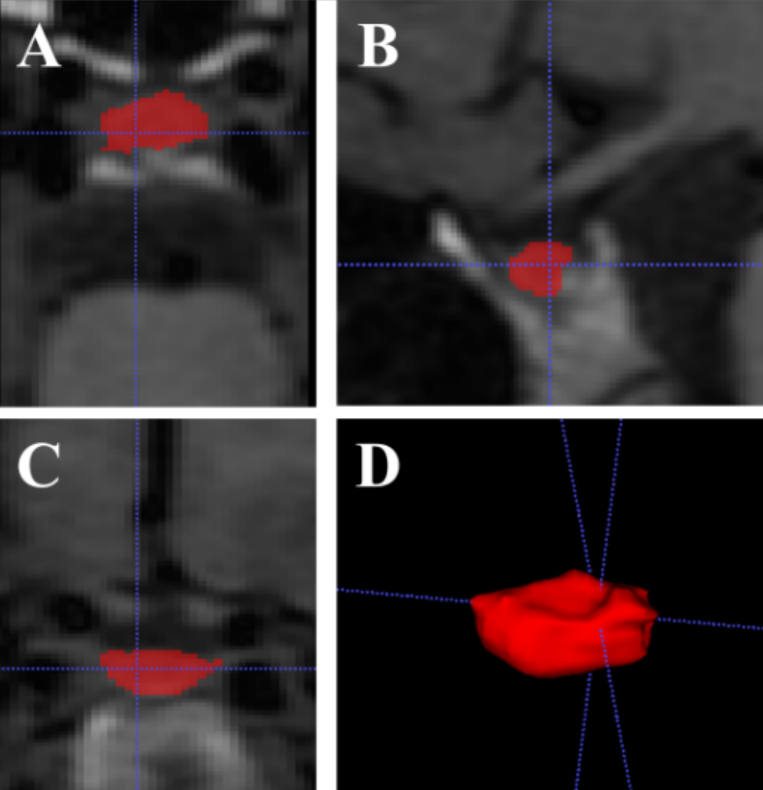
Figure 2. The regions of interest of the adenohypophysis have been manually delineated on CUBE T1WI images.
A: the ROI of adenohypophysis axial images; B: the ROI of adenohypophysis sagittal images; C: the ROI of adenohypophysis coronal images; D: the reformat volume image of adenohypophysis;