2554
In vitro and in vivo 1H-MRS to identify the fate of glutamine in Ewing Sarcoma1Department of Diagnostic Imaging, St. Jude Children's Research Hospital, Memphis, TN, United States, 2Center for In Vivo Imaging & Therapy, St. Jude Children's Research Hospital, Memphis, TN, United States, 3Center for Proteomics and Metabolomics, St. Jude Children's Research Hospital, Memphis, TN, United States, 4Department of Structural Biology, St. Jude Children's Research Hospital, Memphis, TN, United States
Synopsis
Keywords: Cancer, Metabolism, Molecular Imaging, Preclinical, Ewing sarcoma, pediatric cancer
Motivation: Chemo resistance in Ewing sarcoma (EWS) poses a significant hurdle, especially considering the unclear role of the SLFN11 gene. Uninvestigated metabolic dependencies call for an in-depth exploration to improve treatment effectiveness.
Goal(s): This research endeavors to connect metabolic changes in EWS with SLFN11 expression, aiming to identify diagnostic markers that could provide mechanistic insights into therapy design.
Approach: Our study integrates metabolomics, transcriptomics, in-vitro nuclear magnetic resonance (NMR), and preclinical magnetic resonance spectroscopy (1H MRS) to examine how SLFN11 influences chemoresistance in EWS, ultimately paving way for metabolism-driven treatments.
Results: We found significantly increased glutamine uptake in SLFN-/- EWS cells compared to WT.
Impact: Using 1H-MRS, we show that SLFN11 loss increases EWS reliance on glutamine, is different than conventional glutamine metabolism typically observed in other cancers.
Introduction
EWS, a prevalent pediatric bone tumor, presents a therapeutic challenge, especially in metastatic or recurrent cases with limited treatment success.1 Reprogrammed nutrient utilization in cancer cells leads to increased oncometabolite production, a hallmark of malignancy.2 Understanding the underlying metabolic alterations driving EWS growth and survival is crucial. In in vivo studies, combining DNA-damaging agents with PARP inhibitors, especially in high SLFN11 expression cases like ES8, shows promise. However, the precise connection between SLFN11 and broader treatment outcomes for pediatric EWS patients remains unclear.3 Comprehensive metabolomic profiling using 1H-MRS, stable isotope labeling, and NMR reveals heightened glutamine uptake in SLFN11-/-, offering potential therapeutic insights.Methods
Metabolomics: For cell metabolomics, EWS cell lines ES8 WT and ES8 SLFN11 KO were labeled with either of the following stable isotope substrates (10 mM [U-13C]Glucose and 4 mM [U-13C]Glutamine), incubated, extracted, and analyzed via LC-MS.2 MID was calculated with in-house software "jumppm." MetaboAnalyst 5.0 and GraphPad Prism (Version 10) were used for data analysis.NMR: EWS cells were either incubated with 10 mM glucose or 4 mM glutamine in basal DMEM. NMR data were obtained at 1-hour intervals using a 600 MHz spectrometer and analyzed with Bruker TopSpin software. Lactate and glutamate flux was calculated based on steady-state concentration and rate constant. A 100-run Monte Carlo simulation estimated flux uncertainty.
1H MRS: 1H-MRS data using PRESS4 localization were acquired in a Bruker 9.4 T magnetic resonance imaging (MRI) scanner in EWS WT (n=5) and SLFN11-/- (n=5) mice. The spectra were processed using LCModel software.5
Results and Discussions
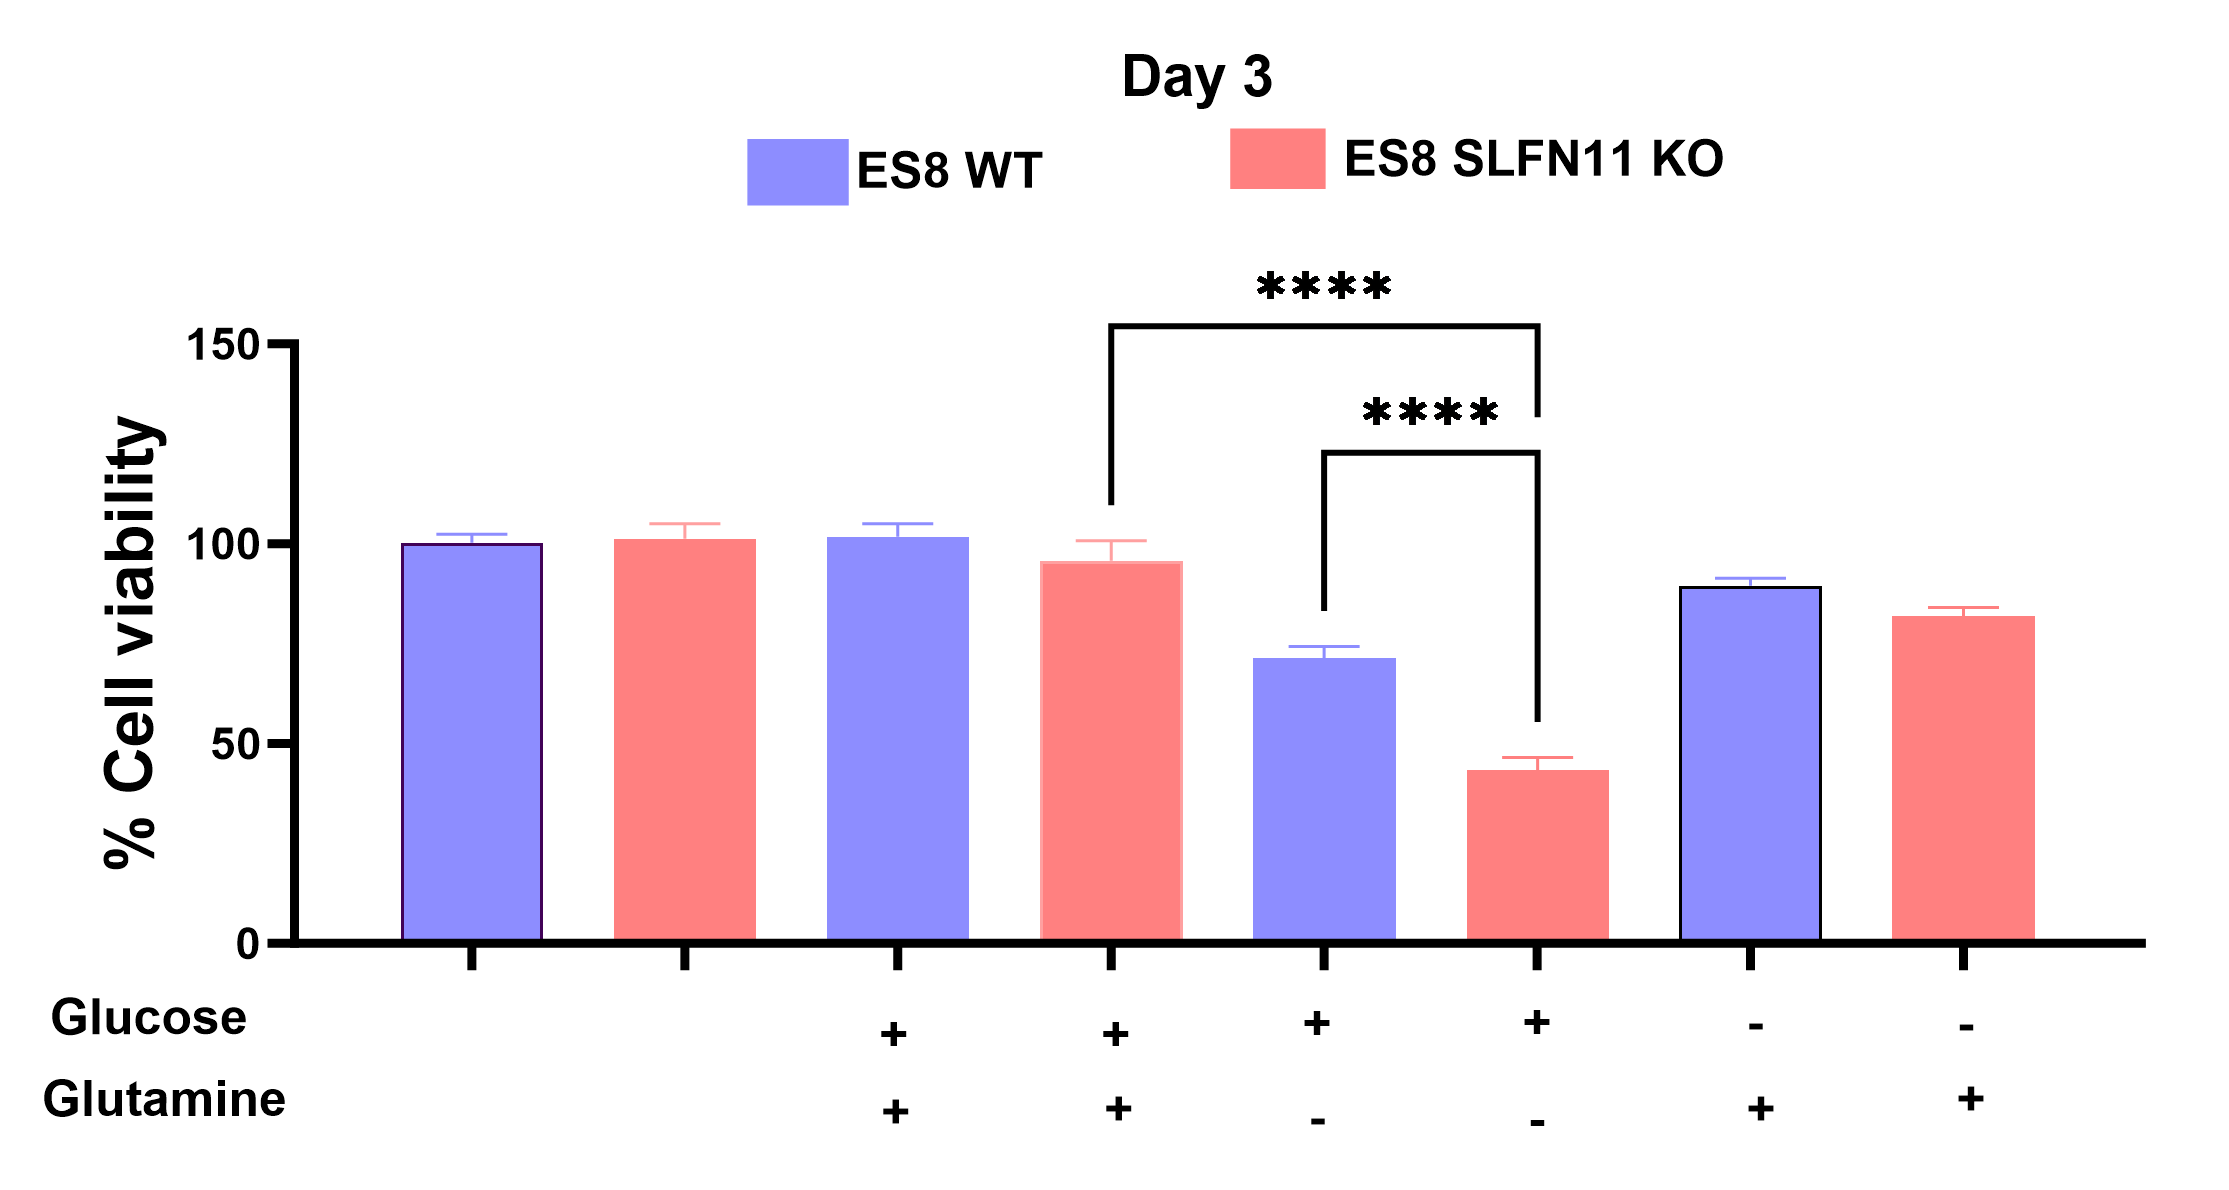
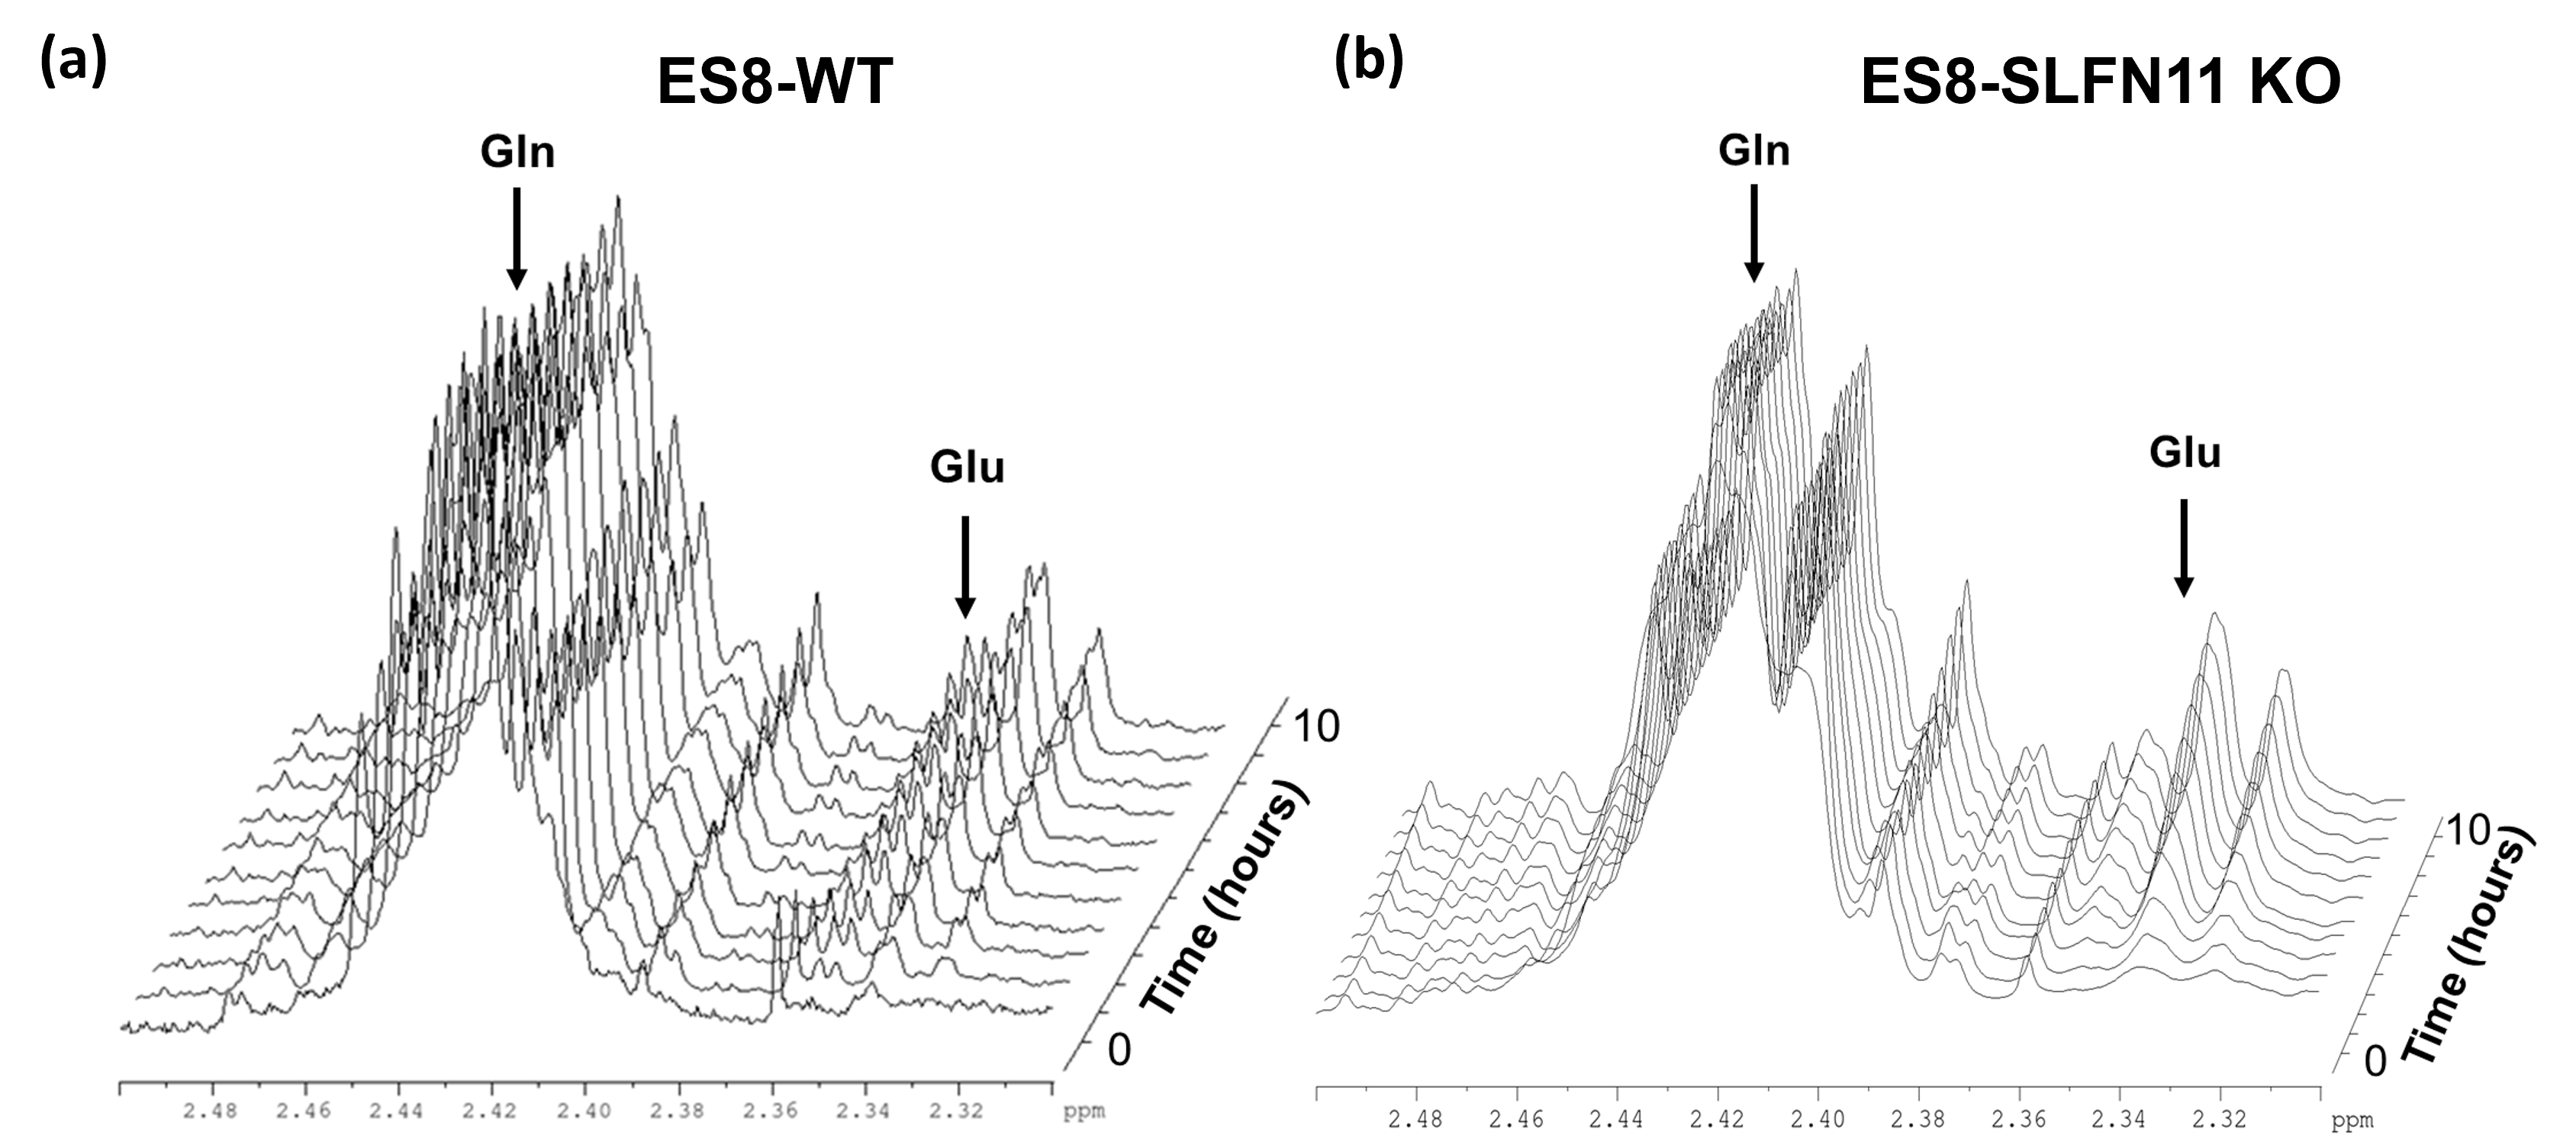
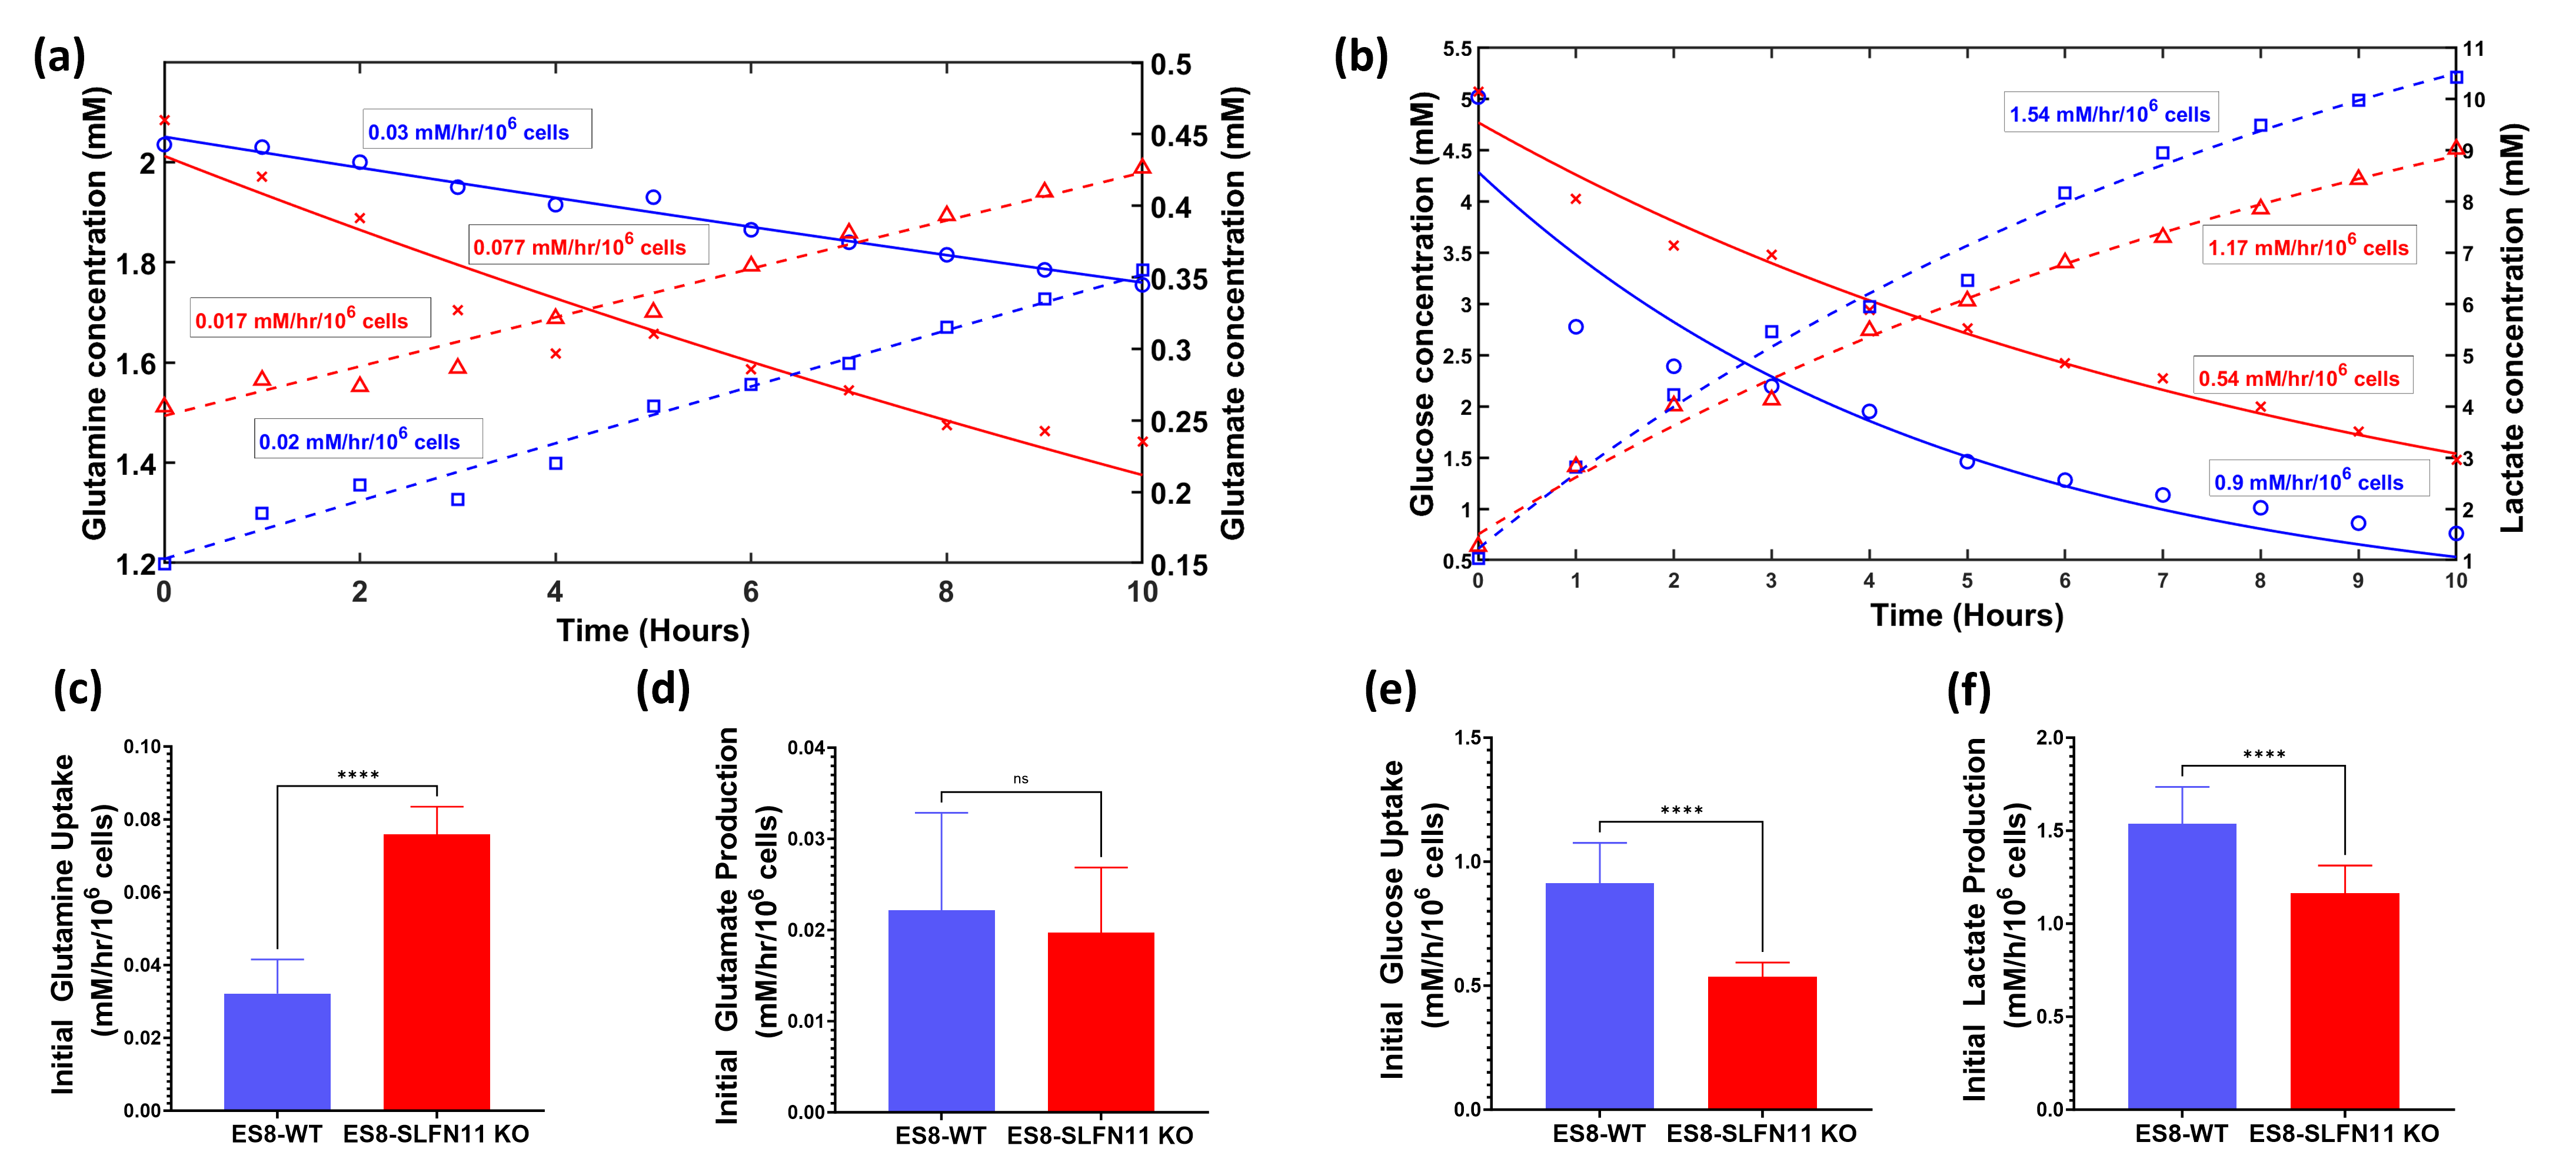
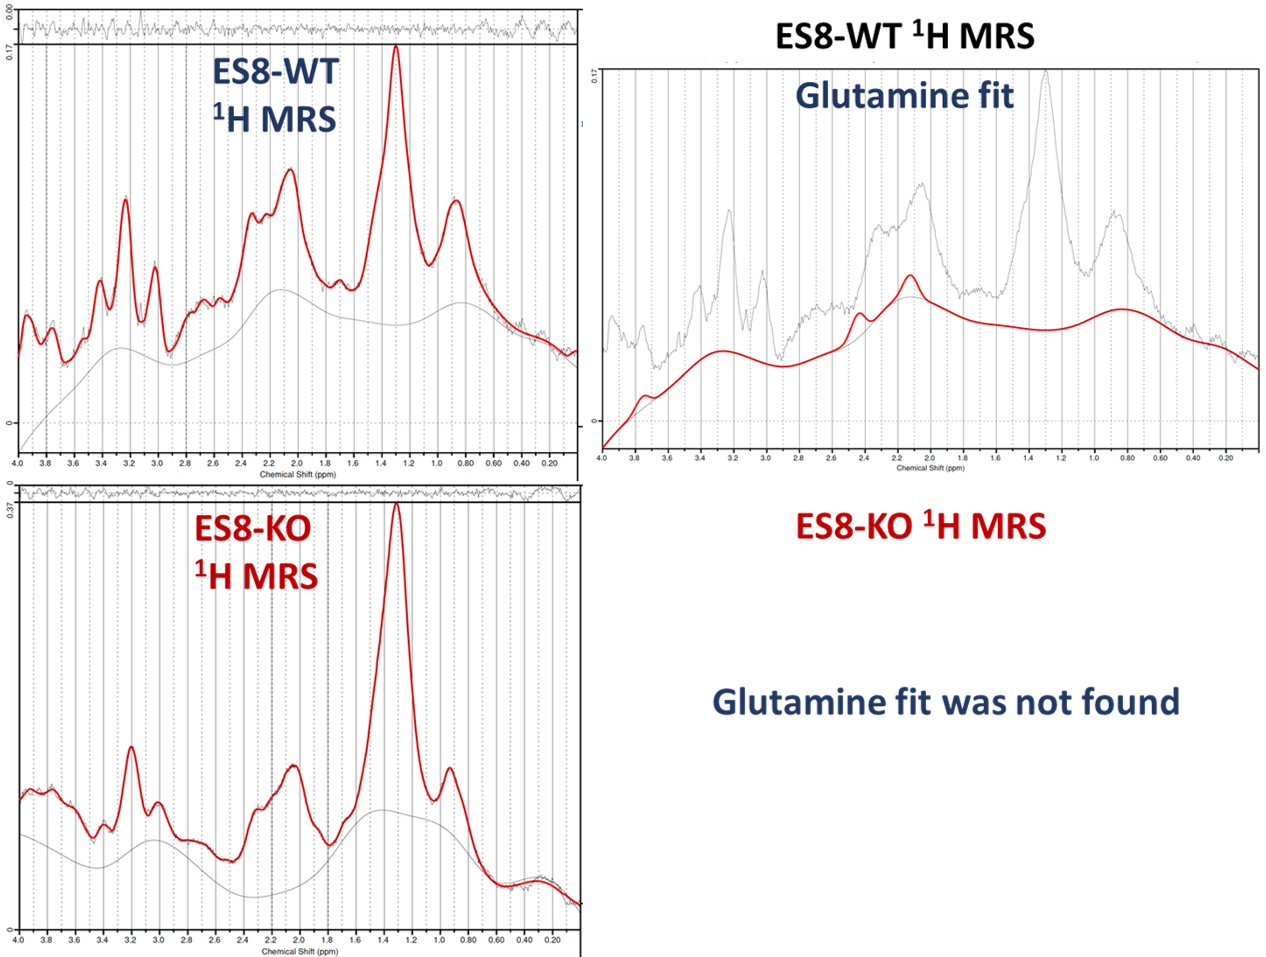
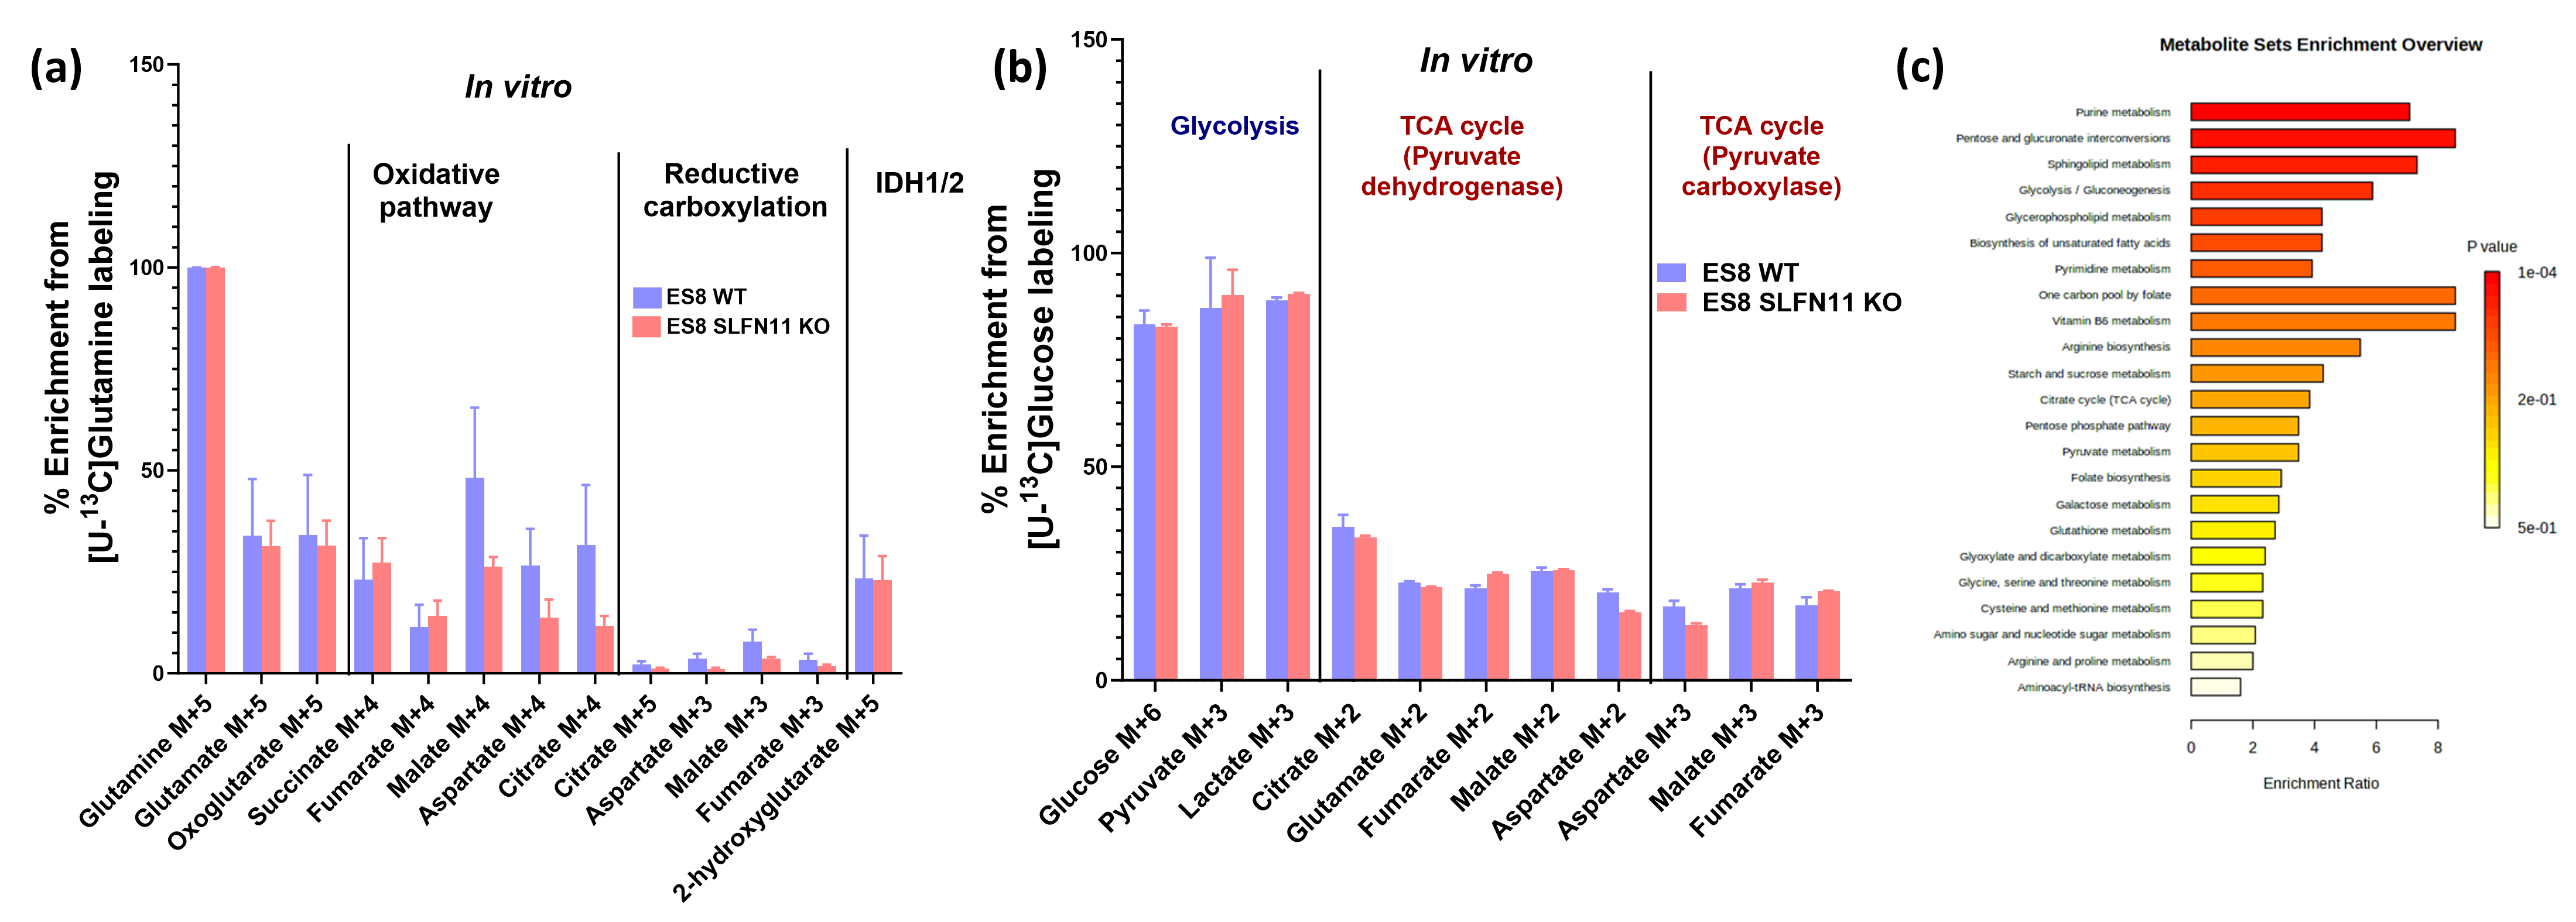
In recent research, our lab uncovered the influence of SLFN11 loss on drug sensitivity, nutrient utilization, and metabolic profiles within EWS cell lines, with a specific focus on ES8 cell line. Our study scrutinized both ES8 WT and ES8 SLFN11-/- cell lines, delving into nutrient dependencies and the utilization of biochemical pathways through stable isotope labeling with [U13C] glucose or [U13C] glutamine. To investigate nutrient utilization in EWS, we supplemented ES8 cells with either glucose or glutamine in media lacking the respective nutrient. Our findings revealed that while glucose supplementation had no impact on viability of SLFN11-/- cells (Figure 1), glutamine supplementation notably increased cell viability in all ES8 SLFN11-/- cells deprived of glutamine (Figure 1). Our NMR studies confirmed these trends, particularly in cells supplemented with glutamine (Figure 2,3a,c-d). The kinetic spectral analysis of glutamine utilization from the NMR spectrum demonstrated a time-dependent increase in the glutamine peak at 2.45 ppm, a phenomenon not seen in ES8 WT cell lines (Figure 2a,b). In the case of glutamine, ES8 WT and ES8 SLFN11-/- cells showed initial uptake rates of 0.03 and 0.077 mM/h/106 cells (Figure 3a,c), while the initial glutamate production rates were 0.02 and 0.017 mM/h/106 cells (Figure 3a,d), respectively. In terms of glucose utilization, ES8 WT and ES8 SLFN11-/- cells exhibited initial uptake rates of 0.9 and 0.54 mM/h/106 cells (Figure 3b,e), with initial lactate production rates of 1.54 and 1.17 mM/h/106 cells (Figure 3d,f). These findings pointed to notably increased glutamine utilization in ES8 SLFN11-/- cells over, with comparable glutamate synthesis in both cases (Figure 2,3a,c-d). In 1H MRS conducted on an in vivo murine model of EWS, distinct glutamine peaks were observed in ES-8 WT cells (Figure 4a,b), whereas ES8 SLFN11-/- cells displayed no such peaks (Figure 4c,d). This suggests heightened glutamine utilization in the SLFN11-/- cells. Surprisingly, glutamine labeling demonstrated similar M+2 and M+3 enrichment in TCA cycle intermediates, indicative of both oxidative and reductive pathways (Figure 5a). Targeted metabolomics using stable isotope labeling in both cell lines once again displayed comparable M+4 enrichment in glycolytic and TCA cycle intermediates with [U13C] glucose (Figure 5a). These findings suggest that ES8 SLFN11-/- cell lines exhibit heightened glutamine uptake but limited utilization in the TCA cycle. These findings motivated us to explore the alternative utilization of glutamine using untargeted metabolomics, which indicated an upregulated purine pathway in ES8 cell lines with SLFN11-/-. In the future, we intend to conduct imaging analyses with glutamine to gain a deeper understanding of the alternate glutamine utilization pathway in EWS with SLFN11-/- in vivo.Conclusion
The study reveals heightened glutamine uptake and alternate metabolic pathways in Ewing sarcoma, particularly in chemo resistant SLFN11 KO cells. This insight provides potential therapeutic avenues for treating this challenging malignancy.Acknowledgements
We acknowledge Dr. Elizabeth Stewart (Associate Member), Dr. Michael Dyer (Chair and Member), Kaley Blankenship (Sr. Researcher) and Matthew Kieffer (Graduate School Student) from Department of Developmental Neurobiology, St. Jude Children's Research Hospital for the cell lines.References
1. Stewart E, et al. Targeting the DNA repair pathway in Ewing sarcoma. Cell reports 2014: 829-840.
2. Chen P-H, et al. Metabolic diversity in human non-small cell lung cancer cells. Molecular cell 2019: 838-851.
3. Gartrell J, et al. SLFN11 is widely expressed in pediatric sarcoma and induces variable sensitization to replicative stress caused by DNA-damaging agents. Molecular cancer therapeutics 2021: 2151-2165.
4. Bottomley PA. Spatial localization in NMR spectroscopy in vivo. Ann NY Acad Sci 1987: 333-348.
5. Provencher SW. Estimation of metabolite concentrations from localized in vivo proton NMR spectra. Magnetic resonance in medicine 1993: 672-679.
Figures