2553
Diffusion tensor imaging quantification of brain matter tracts in gene therapy treated GM1 gangliosidosis patients1University of Massachusetts Chan Medical School, Worcester, MA, United States, 2Koc University Hospital, Istanbul, Turkey, 3University of Calgary, Calgary, AB, Canada, 4University of Arizona, Tucson, AZ, United States, 5NIH, Bethesda, MD, United States
Synopsis
Keywords: Rare Disease, Diffusion Tensor Imaging
Motivation: Type II GM1 gangliosidosis is a rare disease that lacks reliable quantitative biomarkers to assess neuronal health.
Goal(s): We sought to quantify diffusion tensor imaging (DTI) parameters of different brain regions known to be affected in GM1 to track neuronal changes especially with the advent of gene therapy in treating GM1.
Approach: We quantified fractional anisotropy and radial diffusivity changes at different timepoints using DTI-MRI to evaluate myelination changes in GM1 patients treated with gene therapy and compared them to untreated patients and healthy controls.
Results: DTI can be used to demonstrate efficacy of gene therapy in monitoring disease progression/regression in GM1 patients.
Impact: This study addressed the need for reliable biomarkers in assessing neuronal health in type II GM1 gangliosidosis. Using DTI parameters, we demonstrated the efficacy of gene therapy in reliably monitoring myelination changes in GM1 patients.
Introduction
GM1 gangliosidosis (GM1) is a rare lysosomal storage disorder characterized by increased accumulation of GM1 ganglioside, causing irreversible damage to neuronal cells in the brain and spinal cord1,2. Accumulation of this toxic substrate is due to deficient beta-galactosidase enzyme activity caused by an inherited change in the GLB1 gene3. The continued toxic buildup of GM1 gangliosides leads to a progressive neurodegeneration in these patients. There are three disease subtypes with varying onset and progression: type I (infantile), type II (late-infantile and juvenile) and type III (adult). Although hypomyelination4, basal ganglia signal intensity changes5, cerebellar and cerebral atrophy1 have been reported on MRI in GM1 patients, quantitative analyses like longitudinal diffusion tensor imaging (DTI) studies are lacking. Fractional anisotropy (FA) and radial diffusivity (RD) are DTI parameters associated with maturational changes and myelin pathologies6. In this study, we quantified and tracked brain DTI changes longitudinally on specific brain structures at different time-points to assess disease progression in a natural history study (NHS) cohort of GM1 patients and compared the results with patients that were treated with gene therapy. We explored the feasbility of using quantitative DTI as a non-invasive biomarker of disease progression or regression.Methods
Ten GM1 patients, 6 infantile and late-infantile (3.7±2.5 years) and 4 juvenile (6.2±1.4 years), were treated with AAV9GLB1 intravenous gene therapy and their brains scanned with MRI at different timepoints after treatment. Twenty three untreated type II GM1 patients, 7 late-infantile (5.9±2.1 years) and 16 juvenile (14.9±5.4 years), were included in this study from the NHS cohort (Fig. 1). Twelve healthy controls (4.9±1.5 years) were included from the database of the Developmental Neuroimaging Lab at the University of Calgary. Philips Achieva 3T system equipped with an 8-channel SENSE head coil was used to scan all GM1 treated and NHS patients. DTI images were acquired with the following parameters for NHS: TR/TE=6400/100 ms, 32-gradient directions, b-values=0 and 1000 s/mm2, slice thickness=2.5 mm, acquisition matrix=128×128, NEX=1, FOV=24 cm. For gene therapy treated patients, 16 gradient encoding directions were used with all other parameters the same. For healthy volunteers, a General Electric 3T MR750w system and a 32-channel head coil was used for scanning using a single shot spin echo echo-planar imaging sequence: TR/TE=6750/79 ms, FOV=20 cm, 30 gradient encoding directions at b=0 and 750 s/mm2. FA and RD maps were generated using DSI studio. To further quantify the changes in sub-regional structures, the following regions of interest (ROIs) were selected: lentiform nucleus, thalamus, middle cerebellar peduncle, genu and splenium of the corpus callosum, and the anterior and posterior limbs of the internal capsule (Fig. 2). FA and RD values were quantified for each structure and tracked over time for all patients. A generalized linear model (GLM) was used to compare the DTI measurements between the treated and untreated groups while controlling for age. Effects associated with p<0.05 were considered as statistically significant.Results and Discussion
Even though the number of gradient encoding directions were different for the 3 groups, especially between the NHS and treated GM1 patients, comparisons of the FA and RD parameters are still valid according to a study by Ni et. al that concluded minimum effects at higher diffusion directions on DTI parameters while conducting ROI analysis7. Comparison of FA and RD values between the groups showed, in general, lower FA and higher RD values in the NHS late-infantile patients compared to the juvenile patients and healthy controls (Figs. 3 and 4); an indicator of less myelinated fibers8 in the late-infantile patients. For the white matter regions (splenium and internal capsule), the healthy controls showed a significantly higher FA and lower RD compared to the NHS and treated late-infantile patients (Fig. 5). This effect was less so compared to the juvenile group. In terms of treatment effects, late-infantile treated patients showed significant FA increase and significant RD decrease in the splenium. The juvenile treated patients, on the other hand showed significant FA increase in the anterior and posterior limbs of the internal internal capsule and the lentiform nuclues and a significant RD decrease only in the lentiform nucleus. These metric changes might indicate different modes of neuronal fiber development in response to gene therapy treatment.Conclusion
To date, GM1 patient MRI data has mainly relied on qualitative analysis. DTI offers a quantitative approach that can effectively assess neuronal tract changes to evaluate the effects of treatment strategies over time. To the best of our knowledge, this study is the first to demonstrate the utility of DTI in assessing longitudinal changes in type II GM1 patients treated with gene therapy.Acknowledgements
This study was partly funded by Sio Gene Therapies.References
1. Nestrasil I, Ahmed A, Utz JM, et al. Distinct progression patterns of brain disease in infantile and juvenile gangliosidoses: Volumetric quantitative MRI study. Mol Genet Metab. 2018;123:97–104.
2. Rha AK, Maguire AS, Martin DR. GM1 Gangliosidosis: Mechanisms and Management. Appl Clin Genet. 2021;14:209–33.
3. Emecen Sanli M, Dogan M. GM1 gangliosidosis: patients with different phenotypic features and novel mutations. J Pediatr Endocrinol Metab. 2023;36:602–7.
4. Steenweg ME, Vanderver A, Blaser S, et al. Magnetic resonance imaging pattern recognition in hypomyelinating disorders. Brain. 2010;133(10):2971-82.
5. De Grandis E, Di Rocco M, Pessagno A, et al. MR Imaging Findings in 2 Cases of Late Infantile GM1 Gangliosidosis. AJNR Am J Neuroradiol. 2009;30(7):1325.
6. Miller JH, McKinstry RC, Philip JV, et al. Diffusion-Tensor MR Imaging of Normal Brain Maturation: A Guide to Structural Development and Myelination. AJR Am J Roentgenol. 2003;180(3):851-859.
7. Effects of Number of Diffusion Gradient Directions on Derived Diffusion Tensor Imaging Indices in Human Brain. H. Ni, V. Kavcic, T. Zhu, S. Ekholm, J. Zhong. American Journal of Neuroradiology Sep 2006, 27 (8) 1776-1781;
8. Chang EH, Argyelan M, Aggarwal M, et al. The role of myelination in measures of white matter integrity: Combination of diffusion tensor imaging and two-photon microscopy of CLARITY intact brains. Neuroimage. 2017;147:253-261.
Figures
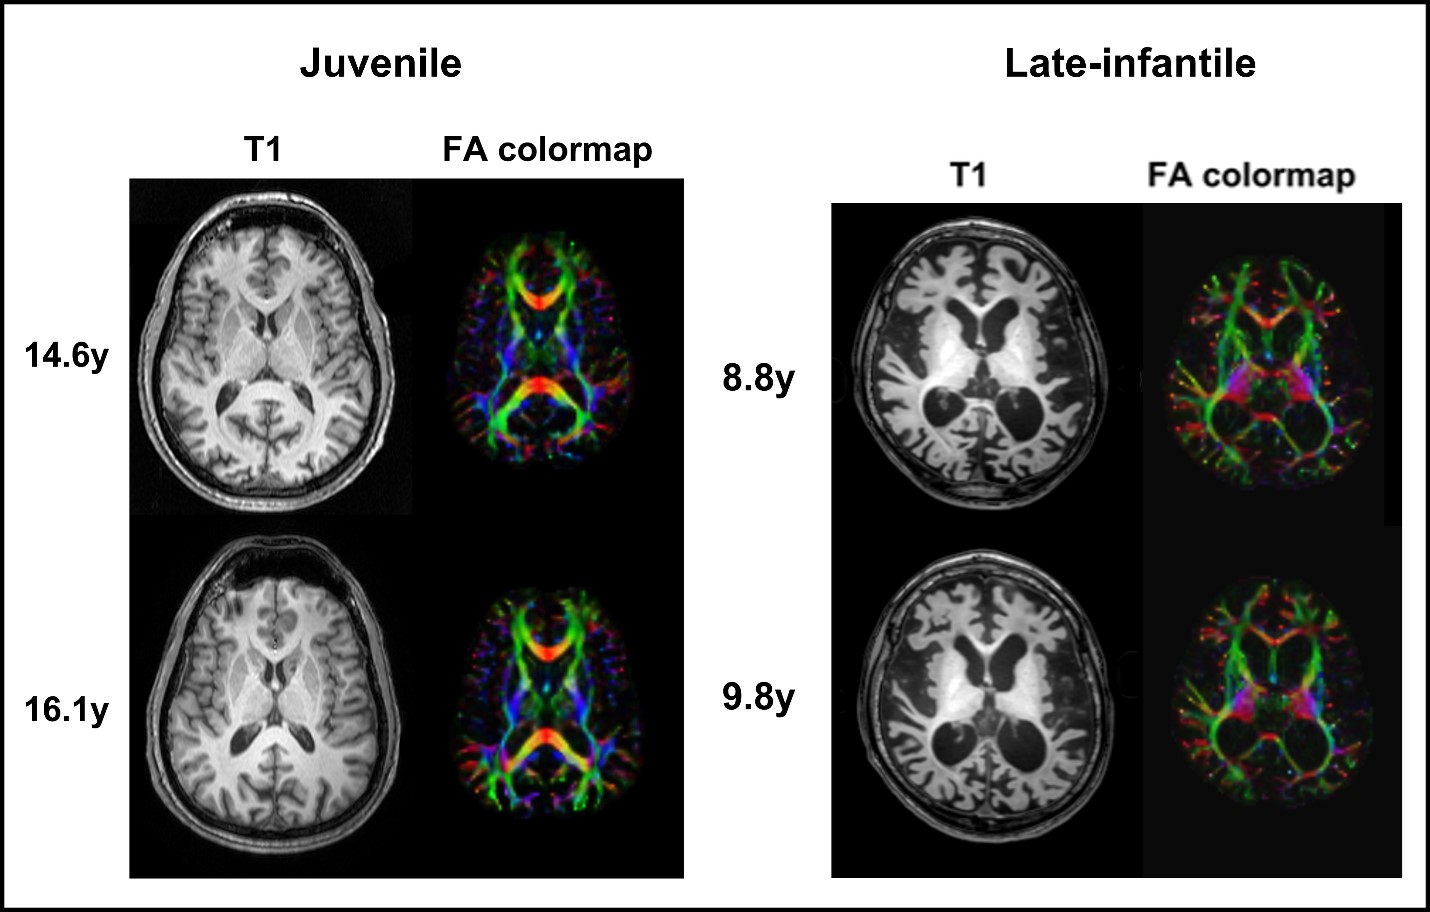
Fig. 1. Representative axial images are shown from juvenile and late-infantile subgroups of GM1 gangliosidosis patients from the natural history study. T1 images and FA colormaps are shown at 2 different timepoints for each patient. The late-infantile patient clearly shows greater neural degeneration both in the grey and white matter regions compared to the juvenile patient.
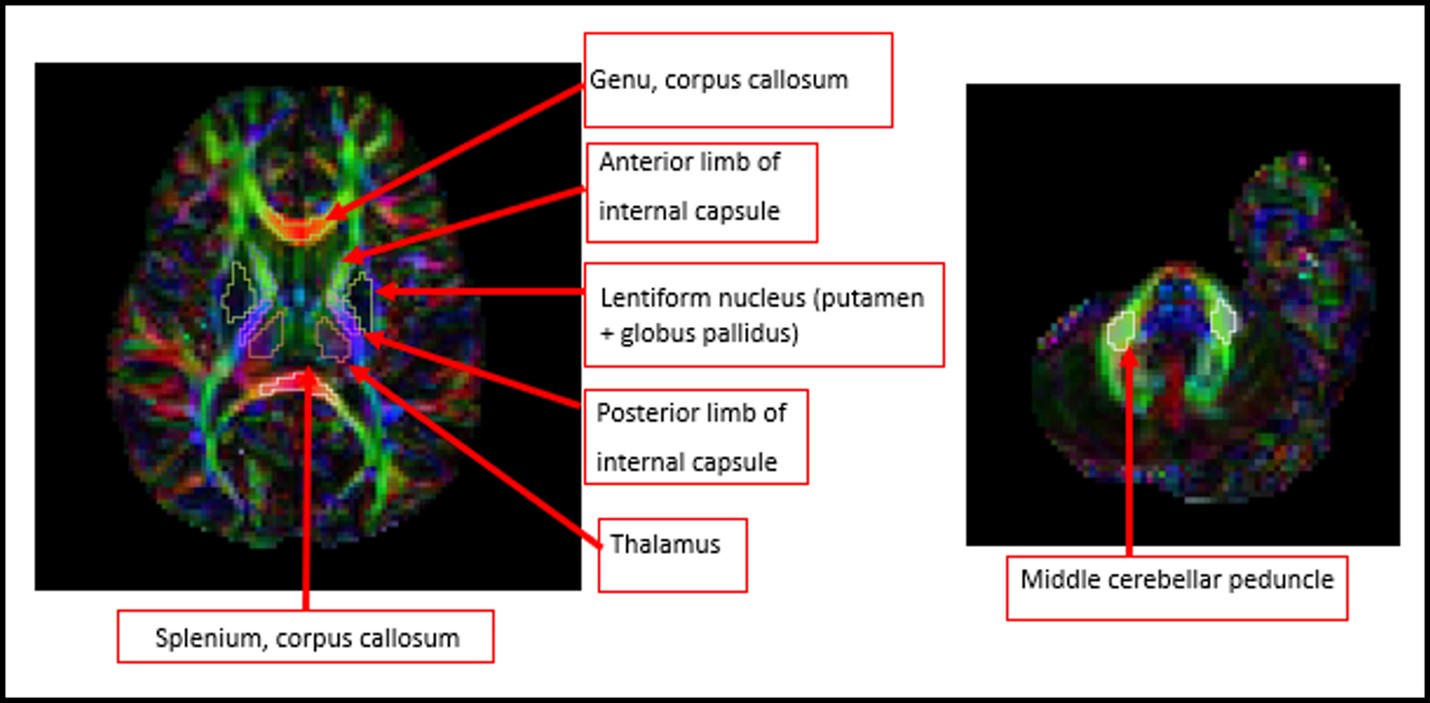
Fig. 2. Illustration of brain region segmentations using the FA colormap. The above indicated regions were segmented for each patient in the study and FA and RD values were calculated for each of the regions. The thalamus, middle cerebellar peduncle, and genu of the corpus callosum did not show significant effects with treatment. Only the corpus callosum, internal capsule, and lentiform nucleus showed significant effects with treatment and are discussed in detail in the text when comparing late-infantile, juvenile and healthy control subjects.
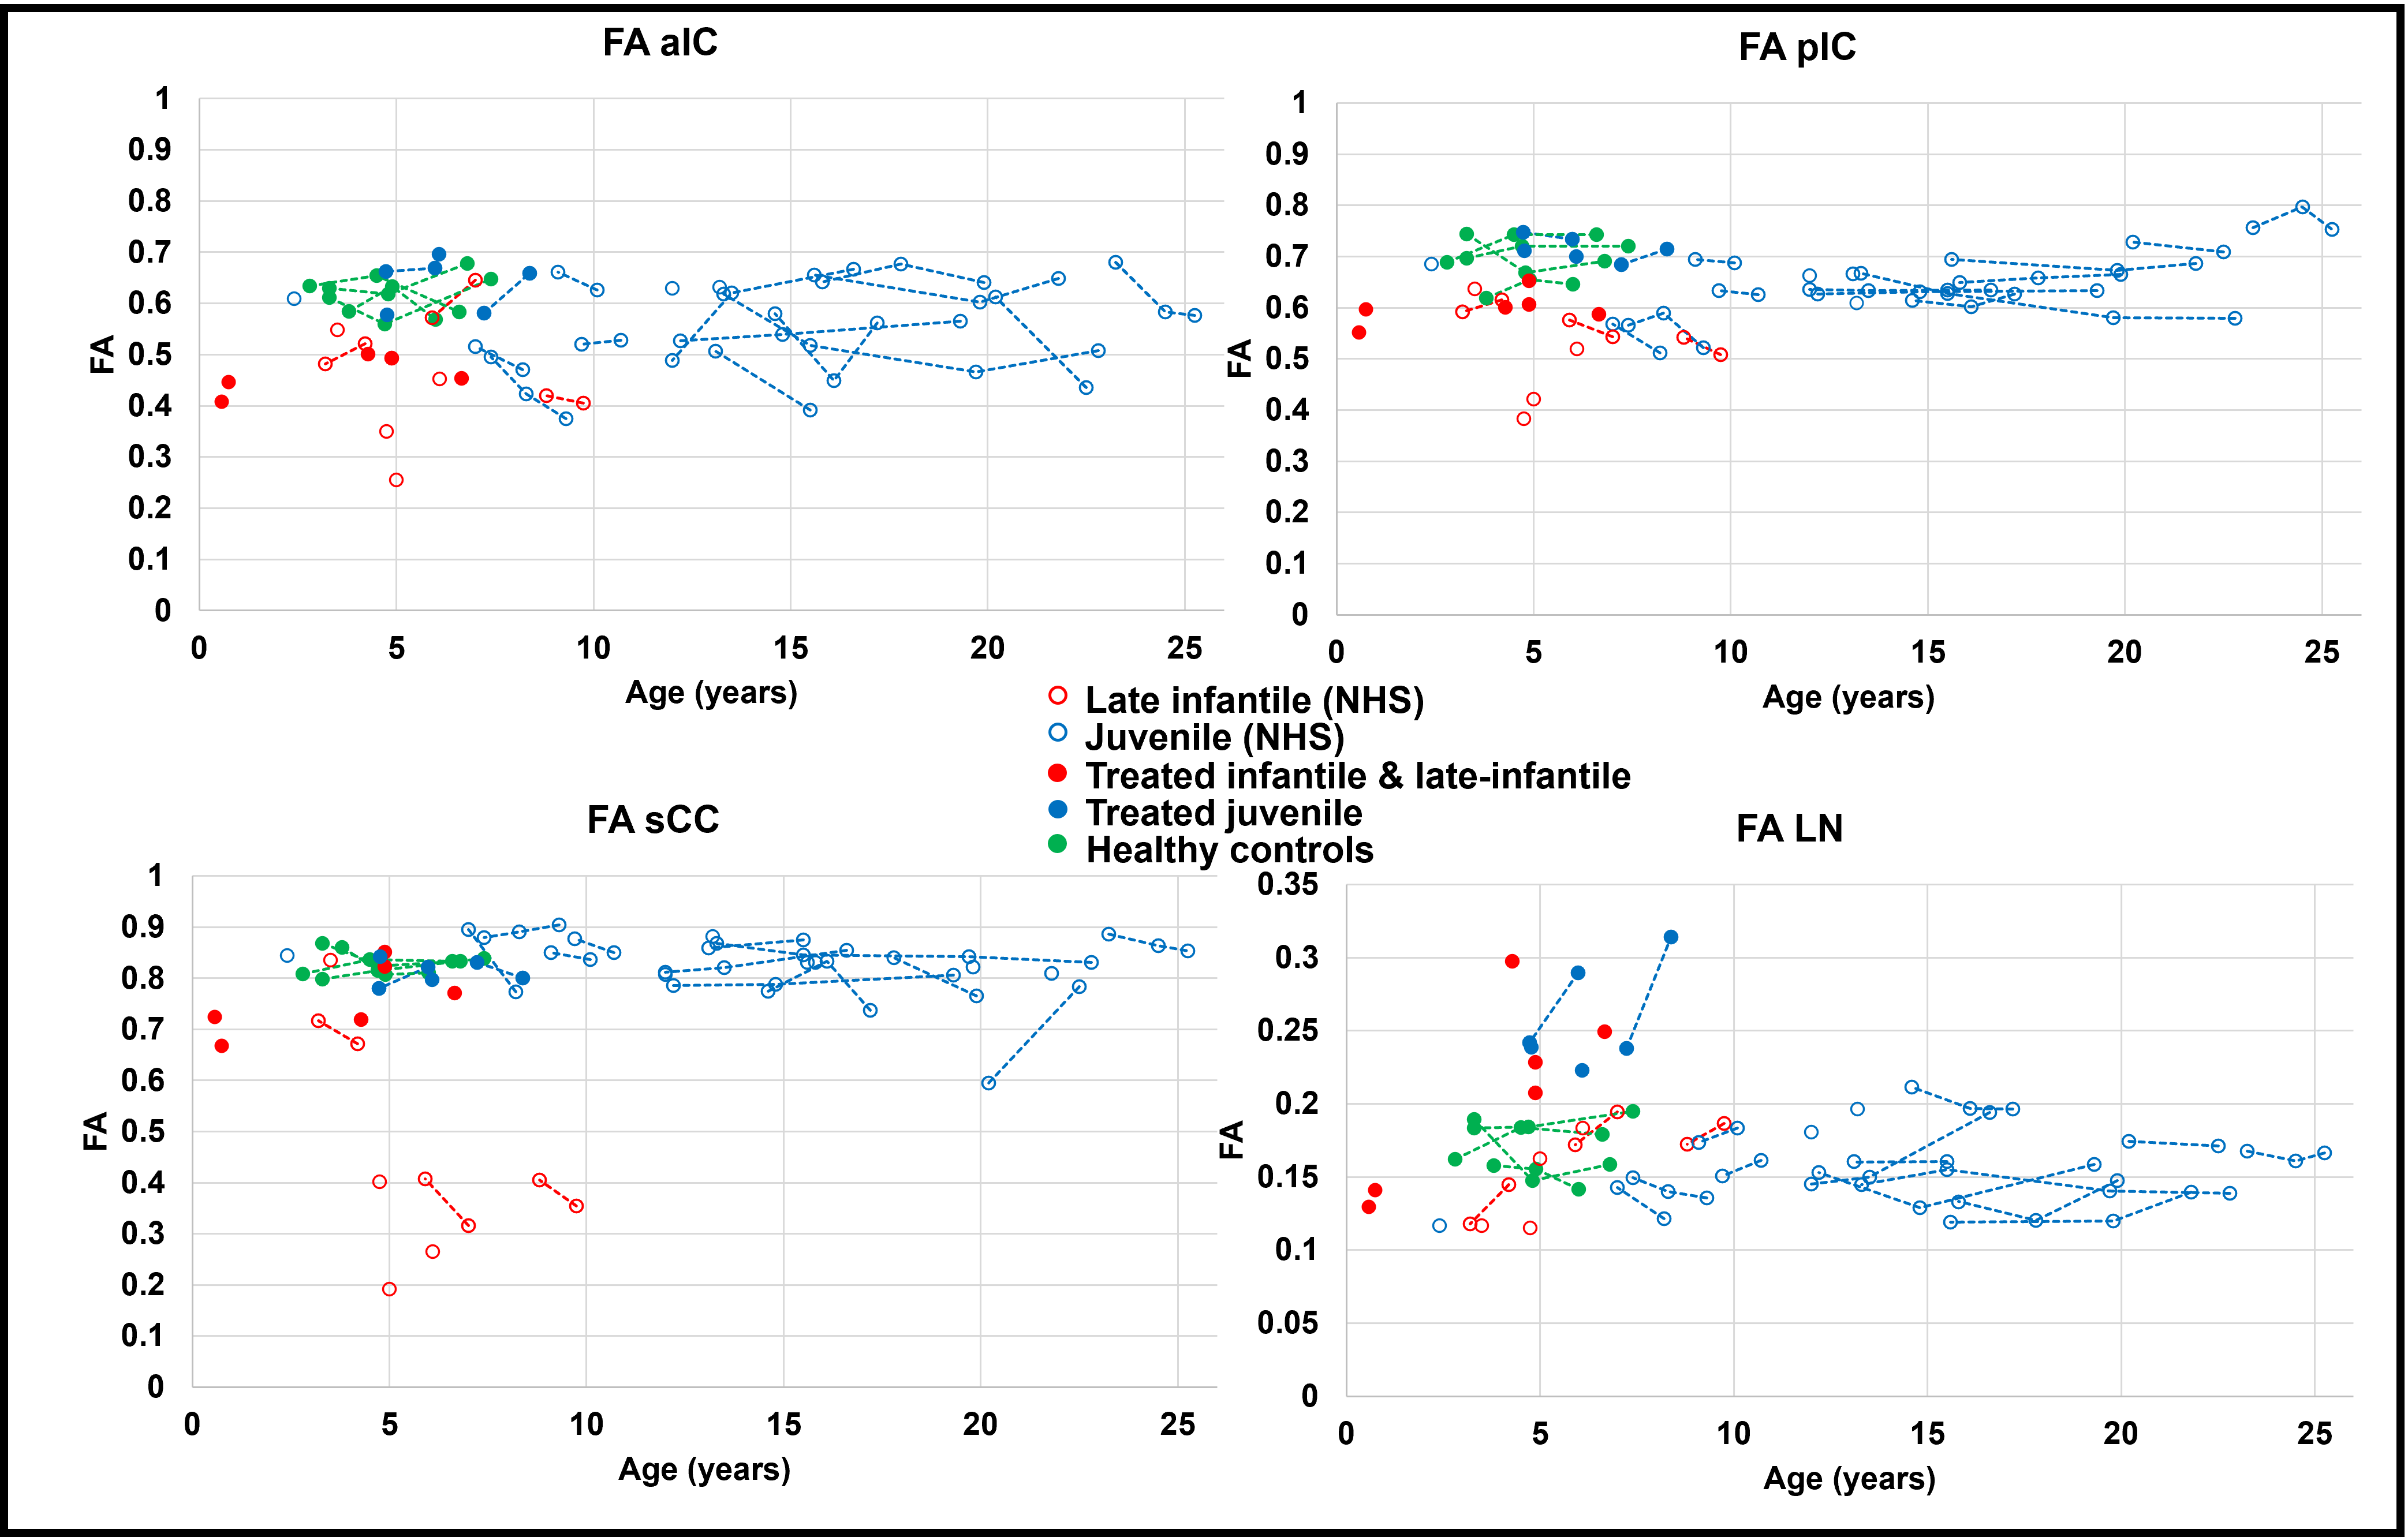
Fig. 3. Summary of fractional anisotropy (FA) quantification is shown for natural history study (NHS) late-infantile and juvenile patients, treated GM1 patients, and healthy control group at different timepoints in the anterior (aIC) and posterior (pIC) limbs of the internal capsule, splenium (sCC) of the corpus callosum, and lentiform nucleus (LN). FA is unitless. Generalized linear model analysis showed significant differences between the groups summarized in Figure 5.
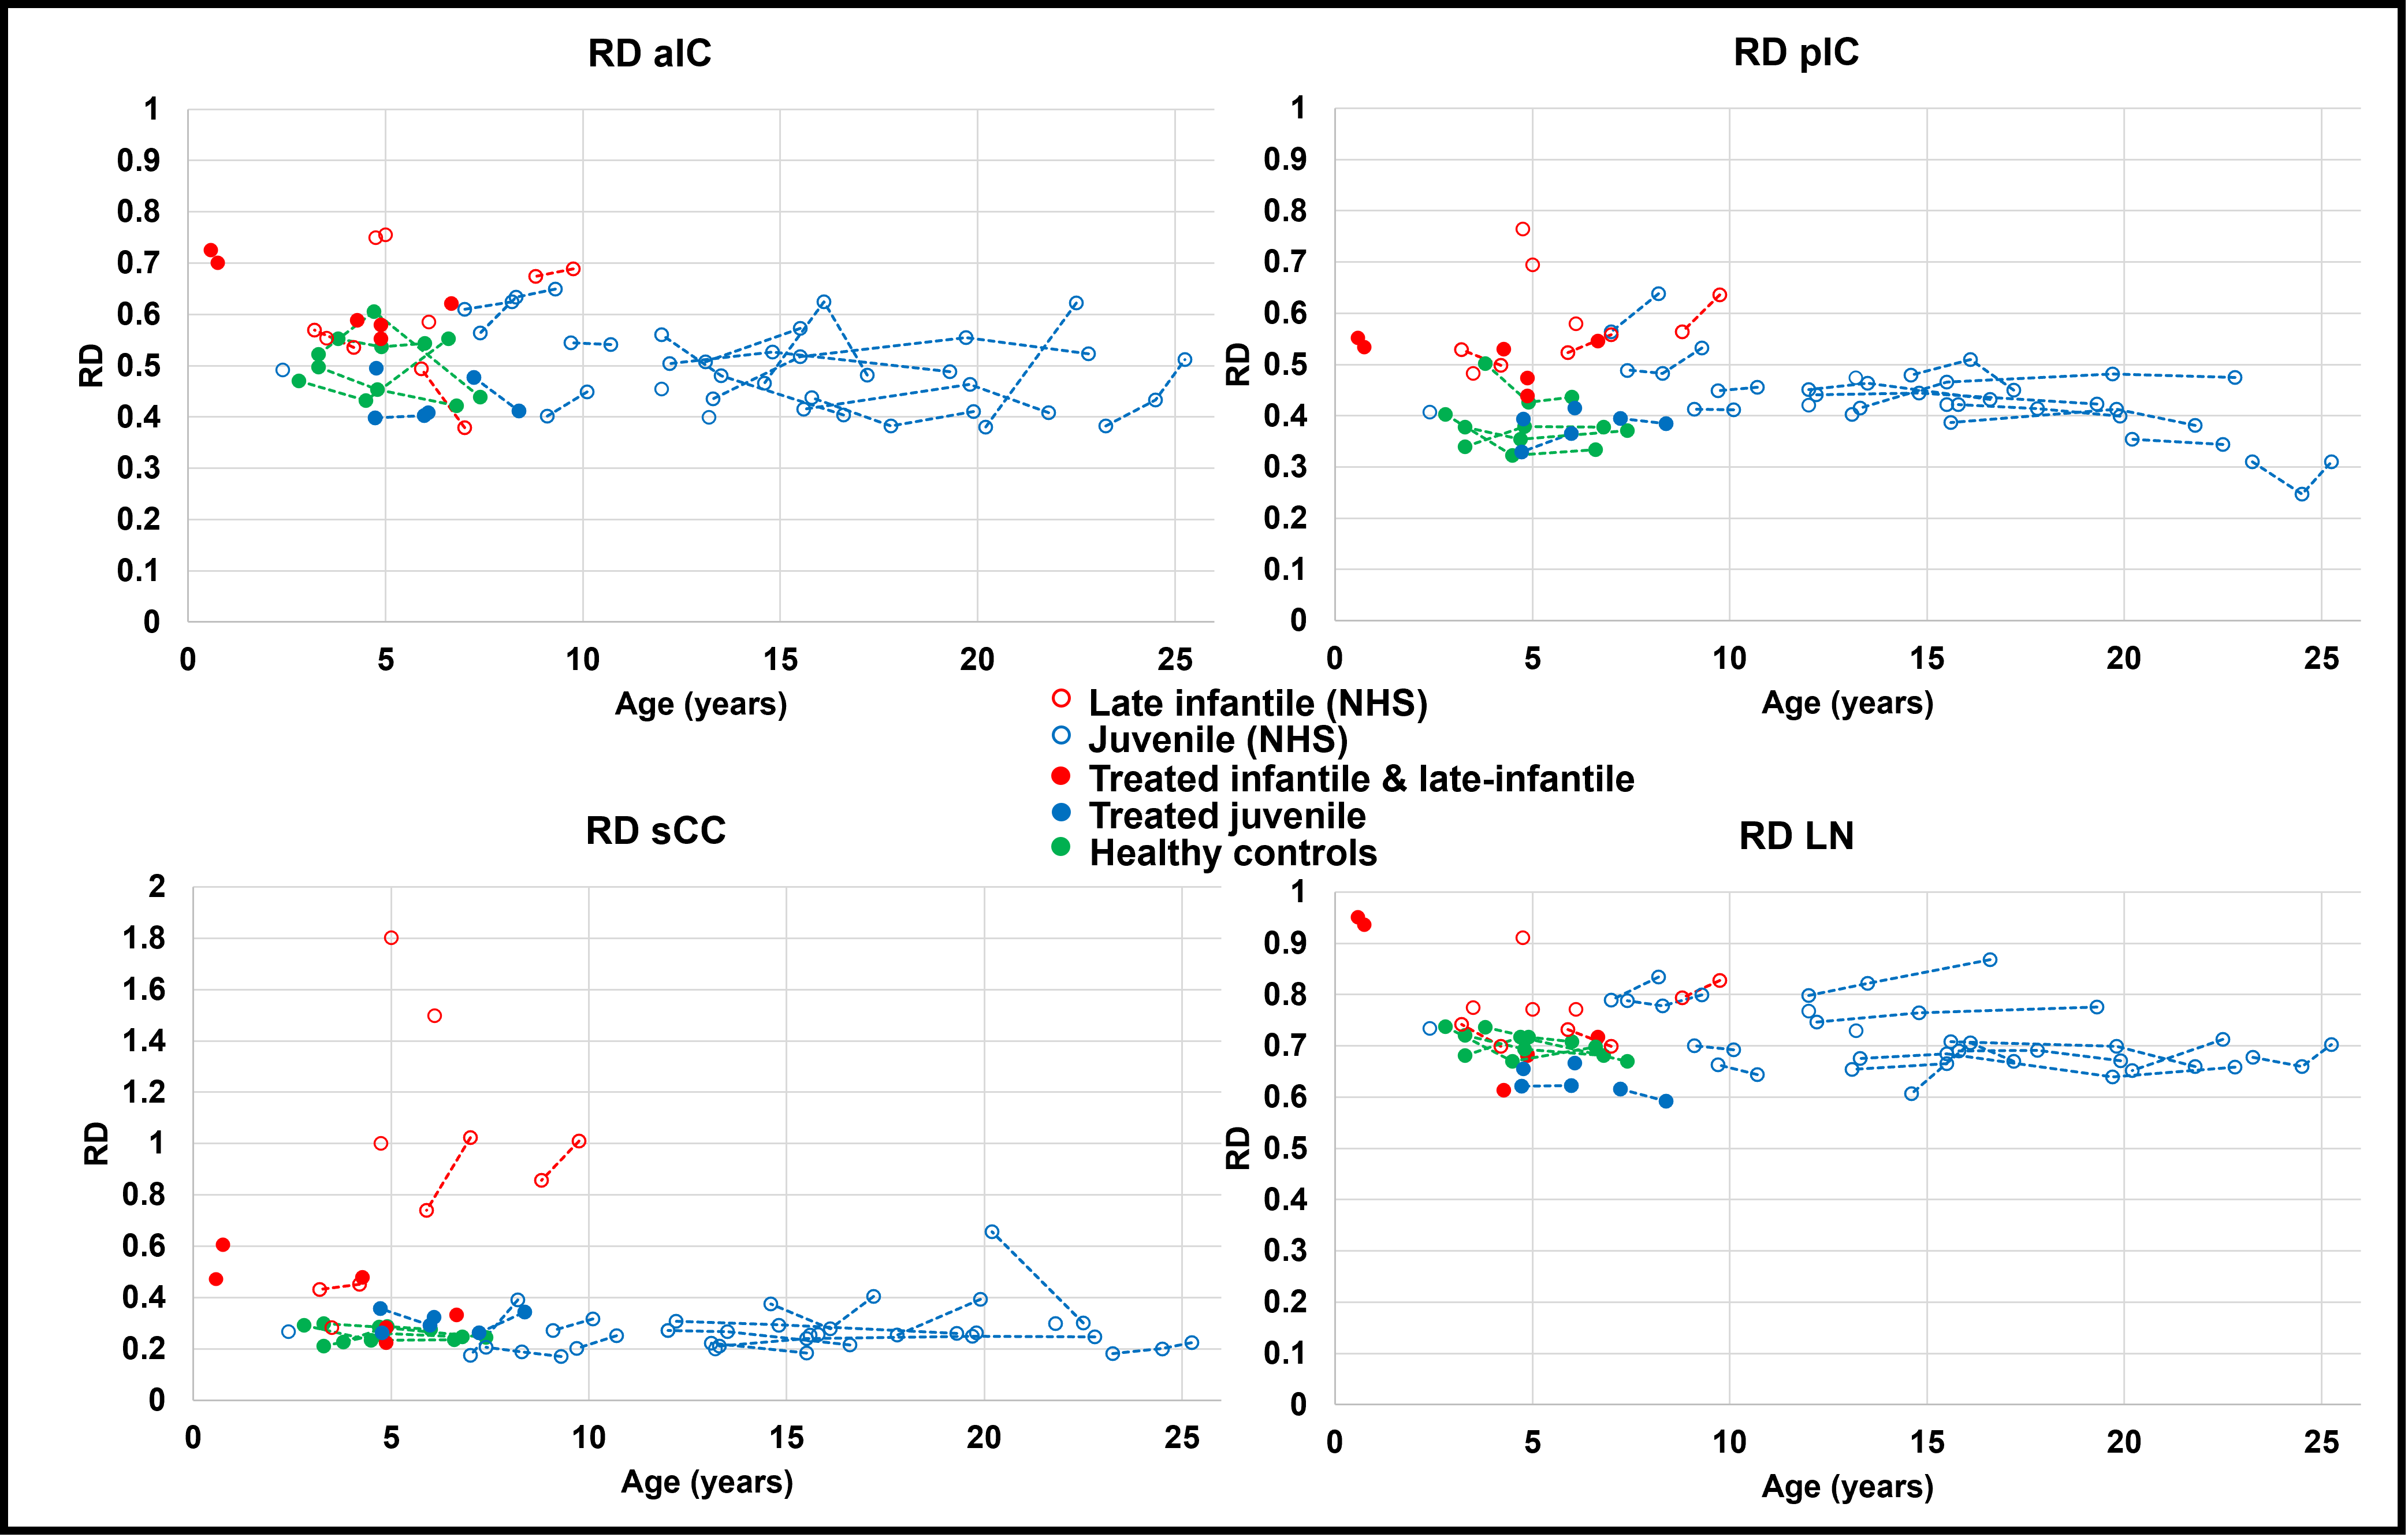
Fig. 4. Summary of radial diffusivity (RD) quantification is shown for natural history study (NHS) late-infantile and juvenile patients, GM1 treated patients, and healthy control group at different timepoints in the anterior (aIC) and posterior (pIC) limbs of the internal capsule, splenium (sCC) of the corpus callosum, and lentiform nucleus (LN). RD units are in ×10-3 mm2/s. Generalized linear model analysis showed significant differences between the groups summarized in Figure 5.
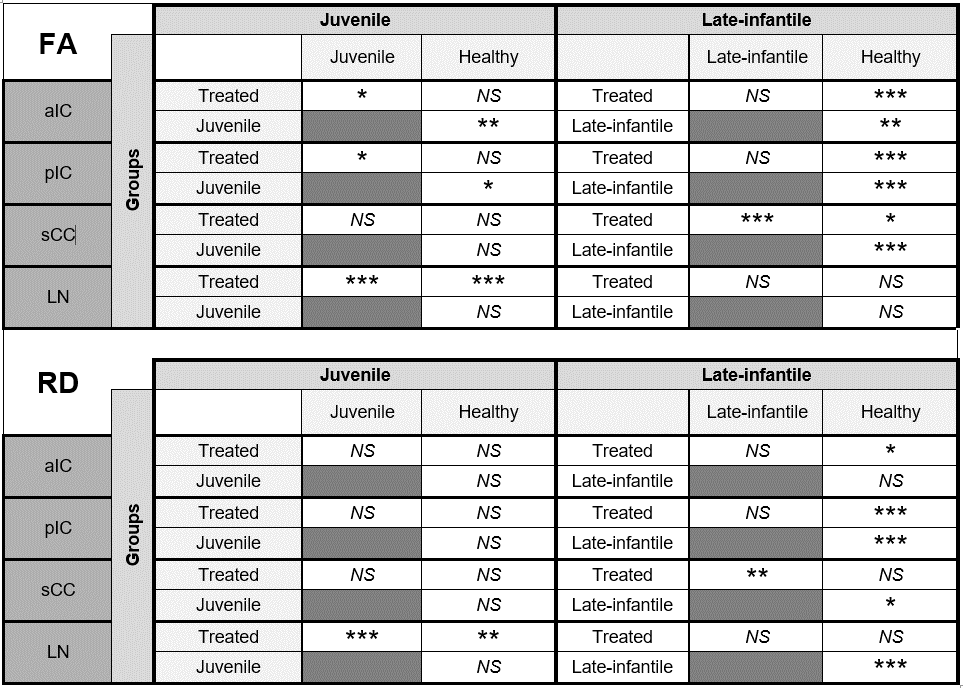
Fig. 5. Summary of statistical analysis showing FA and RD differences between disease and treated patients for the different brain regions. Generalized linear model procedure was used to compare group means of FA and RD values between the juvenile and late-infantile patients. Post-hoc analysis for pairwaise comparisons was performed using either Kruskal-Wallis or Welch’s ANOVA depending on data normality. *0.01<p<0.05; **0.001<p<0.01; ***p<0.001.