2548
Brain iron metabolism in neonates with hyperbilirubinemia by Quantitative Susceptibility Mapping1School of Medical Imaging, Binzhou Medical University, Yantai, China, 2Department of Radiology, Jinan Maternity and Child Care Hospital Affiliated to Shandong First Medical University, Jinan, China, 3Department of Laboratory medicine, Jinan Maternity and Child Care Hospital Affiliated to Shandong First Medical University, Jinan, China, 4Department of Imaging, Shandong Provincial Hospital Affiliated to Shandong First Medical University, Jinan, China
Synopsis
Keywords: Neonatal, Brain, Brain iron metabolism
Motivation: The motivation of this study was to investigate the changes in brain iron metabolism in neonates with hyperbilirubinemia (NHB).
Goal(s): The goal was to assess the diagnostic value of QSM in NHB and explore its brain iron metabolism.
Approach: Clinical trial
Results: Brain iron content can dynamically change with serum bilirubin level in NHB, and brain iron content was significantly higher than that of healthy neonates in the putamen.
Impact: The QSM value of the putamen can accurately diagnose NHB, and provide early warning of brain injury.
Introduction
Neonatal hyperbilirubinemia (NHB) shows no characteristic manifestations on conventional magnetic resonance imaging (MRI), but only when NHB progresses to hyperbilirubin encephalopathy. At present, the common and gold-standard detection method for NHB is invasive examination.Method
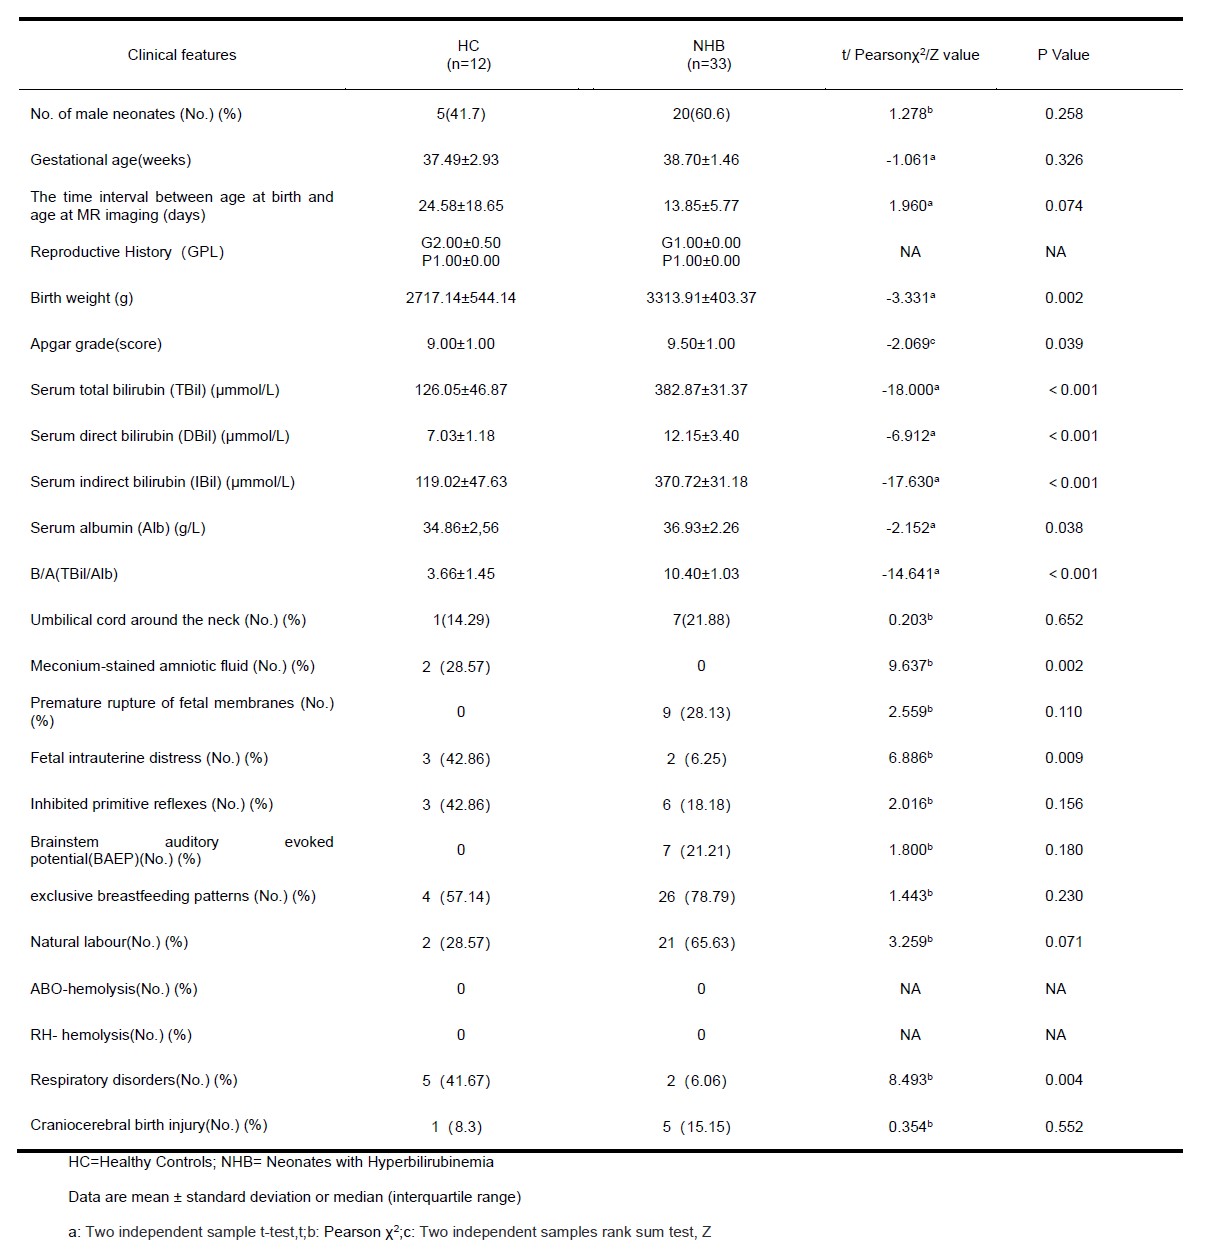
33 term neonates with hyperbilirubinemia (NHB) and 12 healthy-term neonates (HC) were included. Conventional MRI and QSM scans were performed for each participant, and the QSM value of the putamen, globus pallidus, caudate nucleus, and frontal white matter was extracted. In the end, the change in brain iron metabolism was obtained. Two independent samples t-tests and two independent samples rank sum tests were used to explore the differences in the QSM value between the two groups and the differences in the QSM value on the right and left sides of the encephalic regions. Pearson or Spearman bivariate correlation analysis, multiple linear regression analysis, and polynomial regression analysis were used to explore the relationship between the QSM value and serum total bilirubin (TBil) concentration and explore the relationship between the QSM value and serum indirect bilirubin (IBil) concentration in participants. The area under the curve (AUC) of the QSM value of encephalic regions was calculated by the receiver operating characteristic (ROC) curve to assess the diagnostic ability of NHB.Result
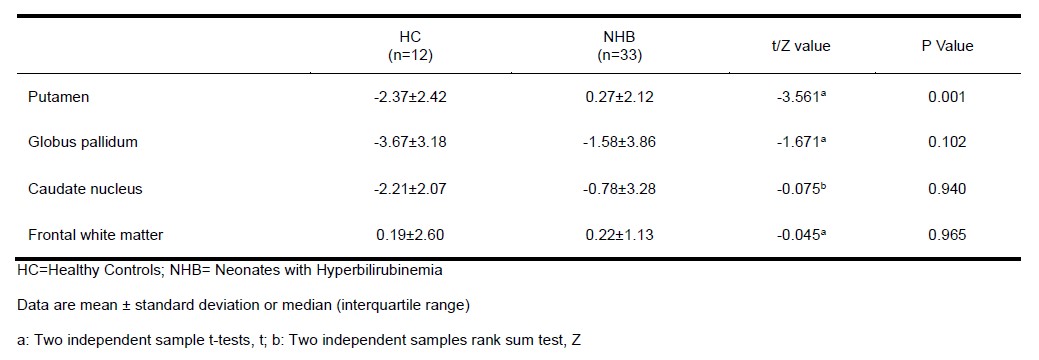
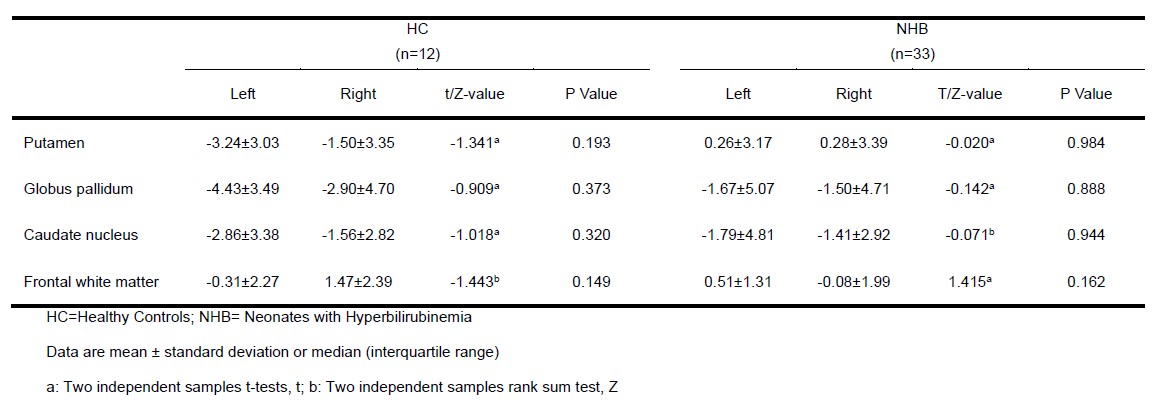
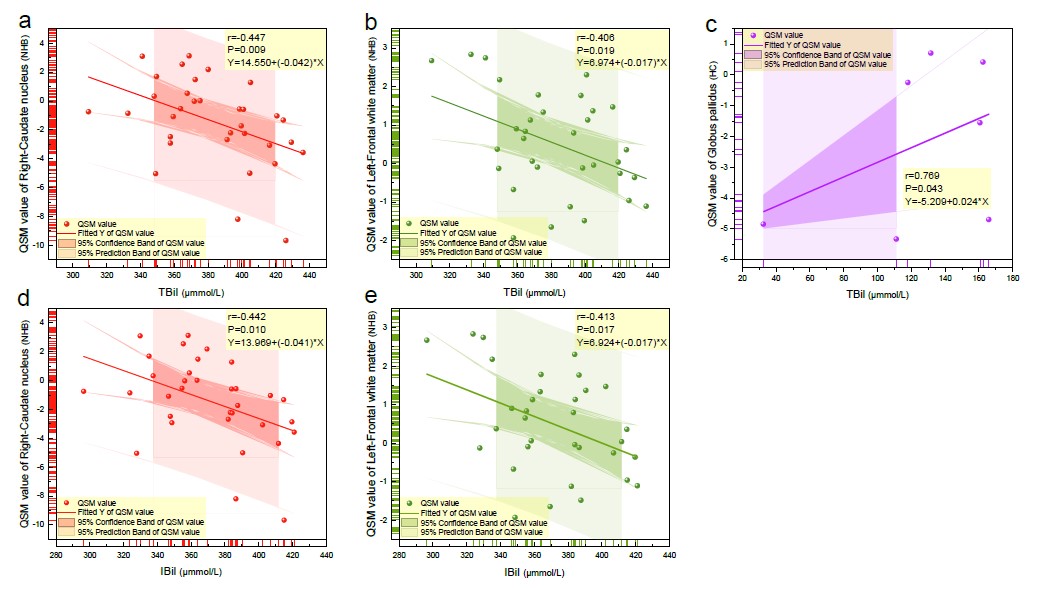
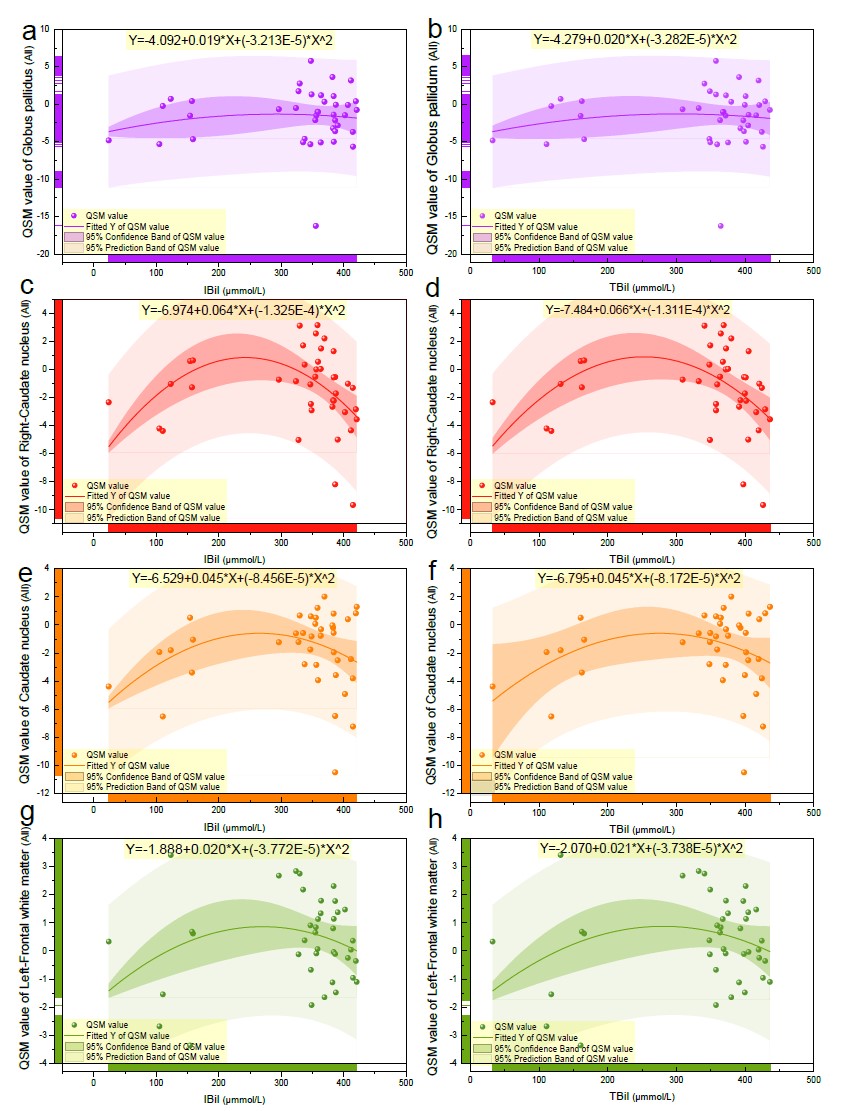
The QSM value of the putamen was significantly different between the two groups (P=0.001), and the QSM value of the putamen in NHB was higher than in c (Table 2). There was no statistical difference in the QSM value of the putamen, globus pallidum, caudate nucleus, and frontal white matter on the left and right sides of each participant (Table 3). The QSM value of the globus pallidus was positively correlated with serum TBil concentration (μmmol/L) (P=0.043) (Figure 1c), the QSM value of the right caudate nucleus and left frontal white matter was negatively correlated with serum TBil concentration (μmmol/L) (P=0.009, P=0.019) (Figure 1 a, b), and the QSM value of the right caudate nucleus and left frontal white matter was negatively correlated with serum IBil concentration (P=0.010, P=0.017) (Figure 1 d, e).In multiple linear regression analysis, we found that the dependent variables including the globus pallidus and frontal white matter, correlated serum TBil concentration in HCs (P=0.011, P=0.025). And simultaneously, we found that the dependent variables including the right caudate nucleus and left frontal white matter, correlated serum IBil concentration in NHB, (P=0.027, P=0.045). The polynomial regression curve analysis showed that the QSM value of the globus pallidus, right-caudate nucleus, caudate nucleus, and left-frontal white matter of HC respectively increased with the increase of serum TBil and IBil concentration, while when NHB occurred, the QSM value respectively decreased with the increase of serum TBil and IBil concentration, but it was still higher than that of HC (Figure 2).
By comparing the AUC, we found that the QSM value of putamen had the best ability to diagnose NHB (AUC=0.7803).
Discussion
Brain iron content is increased in patients with hyperbilirubinemia. When brain iron content exceeds the iron chelation capacity of stored proteins or other molecules and cells, abnormal iron deposition in neurons will induce a chain reaction mainly based on oxidative stress[1, 2], which eventually leads to cell damage and apoptosis, resulting in central nervous system damage[3]. The results of this study indicate that the QSM value of the putamen can be used for noninvasive and effective diagnosis of NHB and can detect brain iron metabolism at any time, which may provide appropriate intervention time and therapeutic target for clinical treatment.Bilirubin can be removed by oxidative metabolism in the brain[4], and physiological or mild and moderate hyperbilirubinemia has a positive antioxidant effect, which can effectively protect neonatal brain development[5]. However, when the concentration of bilirubin is high, it shows a negative pro-oxidation effect, leading to neurological dysfunction[6]. The results of this study showed that brain iron content increased first to the inflection point and then gradually decreased with the increase of serum bilirubin in parts of the brain. Therefore, it is speculated that this inflection point may be the limit of the antioxidant protective effect of bilirubin in the brain.
Conclusion
Through this study, we can firmly establish that one of the main goals of the management of cerebral complications of neonatal hyperbilirubinemia is to prevent brain iron deposition to the extent of neurotoxicity. The QSM value of putamen in full-term neonates can accurately, non-invasively, and efficiently diagnose hyperbilirubinemia, and promote the early and accurate intervention of NHB.Acknowledgements
This manuscript has been edited and proofread by American Journal Experts. We thank all of the volunteers and patients for their participation in our study.References
1. Doré, S., Takahashi, M., Ferris, C. D., Zakhary, R., Hester, L. D., Guastella, D., & Snyder, S. H. (1999). Bilirubin, formed by activation of heme oxygenase-2, protects neurons against oxidative stress injury. Proceedings of the National Academy of Sciences of the United States of America, 96(5), 2445–2450.
2. Shapiro, S., et al., The Neurological Sequelae of Neonatal Hyperbilirubinemia: Definitions, Diagnosis, and Treatment of the Kernicterus Spectrum Disorders (KSDs). Current Pediatric Reviews, 2017. 13.
3. Yan, F., N. He, and E.M. Haacke, Editorial: Quantitative Susceptibility Mapping in Neurodegeneration. Frontiers in Neuroscience, 2021. 15.
4. Hansen, T. W., Allen, J. W., & Tommarello, S. (1999). Oxidation of bilirubin in the further characterization of a potentially protective mechanism. Molecular genetics and metabolism, 68(3), 404–409.
5. Bélanger, S., Lavoie, J. C., & Chessex, P. (1997). Influence of bilirubin on the antioxidant capacity of plasma in newborn infants. Biology of the neonate, 71(4), 233–238.
6. American Academy of Pediatrics Subcommittee on Hyperbilirubinemia (2004). Management of hyperbilirubinemia in the newborn infant 35 or more weeks of gestation. Pediatrics, 114(1), 297–316.
Figures