2545
Comparison of liver and brain stiffness in children with normal weight vs obesity using MR Elastography1University of Illinois, Urbana, IL, United States, 2Bioengineering, University of Illinois, Champaign, IL, United States, 3University of Illinois, Champaign, IL, United States
Synopsis
Keywords: Elastography, Data Analysis, Brain, Liver, Inflammation, Neuroinflammation
Motivation: Obesity is associated with numerous debilitating diseases. Obesity-related conditions once only seen in adults are now being seen in children. Obesity affects numerous organs and may affect a child's ability to learn.
Goal(s): Identify changes in liver and brain stiffness measurements in the pediatric population that may indicate signs of early-stage disease.
Approach: MR elastography images of the liver and brain were obtained and compared to dual energy X-ray (DXA) metabolic measurements.
Results: Significant correlations between obesity and stiffness changes in the thalamus and amygdala were identified.
Impact: Preliminary results show that changes in liver and brain microstructure of the pediatric population can be seen in correlation to increased adiposity. MR elastography is a valuable tool in diagnosing those early changes.
INTRO
Obesity is ever increasing in modern society, and this includes children. While the American Medical Association (AMA) and World Health Organization (WHO) recognize obesity as a distinct disease1, obesity can lead to several other health issues, many of which were rarely seen in children a few years ago. Visceral adiposity (adipose tissues surrounding intra-abdominal organs) is a relevant marker of metabolic disease associated with obesity.2 Magnetic resonance elastography (MRE) can provide a quantitative measure of tissue health in a pain-free, non-invasive manner by identifying areas of altered stiffness and viscoelasticity, which is documented to be associated with inflammation, edema, metabolic changes and areas of disease.1-7 The purpose of this study was to identify any differences in the liver or brain parenchyma in obese children compared to normal weight children.METHODS
The study included 22 children between the ages of 8-12 years of age (5 female, 17 male). See Table 1 All subjects underwent physical exam including height and weight, body mass index (BMI) calculation and dual-energy X-ray absorptiometry (DXA) to calculate whole body fat percentage (WPTOT_PFAT) and abdominal visceral adipose tissues mass (VFAT_MASS).8 BMI-for-age percentile (%BMI) was calculated to determine weight status.9 Subjects also completed an MRI using a Siemens Magnetom Prisma Fit 3T magnet. Head and liver images were acquired during the scanning session. Imaging included a structural T1 scan and an MRE scan on the head using a custom multi-shot 3D spiral MRE sequence with 1.6 mm isotropic resolution and an actuation frequency of 50 Hz. Imaging on the liver included a fat/water scan and MRE using an EPI-based sequence with an actuation frequency of 50 Hz. MRE actuation was achieved using a Resoundant device and a head pad or a liver pad, as appropriate.10 Post-processing of the MRE images included performing liver and brain extraction (BET) on the t2-weighted magnitude MRE image using ITK-SNAP (V3.8.0).11 Direct inversion (DI) was utilized to estimate complex shear modulus, strain, shear stiffness (m) and damping ratio (DR) using MATLAB®( R2022b, 2021). Direct inversion (DI) was used to process MRE displacement data to estimate shear modulus, shear stiffness, and damping ratio.RESULTS
WBTOT-PFAT in the 22 subjects ranged from 17.722-46.048% (m=32.241%). VFAT_MASS ranged from 31.8-536.7g (m=226.2g). Stiffness ranged from 3.12-3.72kPa (m=3.39kPa) in liver and 1.76-2.45kPa (m=2.28kPa) for the whole brain.We examined stiffness, shear modulus and damping ratio in liver, whole brain, and multiple brain regions associated with memory, learning, cognitive and motor functions, averaging the mechanical properties from the hemispheres. For comparison, we also examined brain volume (both with and without ventricles, as determined in Freesurfer (6.0.1)12 in relation to these measures.
A significant correlation was observed between liver stiffness and age. Significant correlations were also observed between whole brain shear modulus and amygdala DR with WBTOT_PFAT. The thalamus DR also showed a significant correlation with BMI and VFAT_MASS. Percentile BMI showed significant correlations to whole brain SM, WBTOT_PFAT and VFAT_MASS. See Table 2
DISCUSSION
The goals in this pilot study were to identify stiffness measurements of the liver and brain structures in the pediatric population and any correlations to body composition. The original participant number for this study was 30 but eight subjects were removed for various reasons (unable to complete all portions of study, equipment malfunction). Of the 22 subjects, only two were categorized as obese and three as overweight. The low population of subjects with overweight and obesity may play a factor in identifying correlations between adiposity and the brain and liver in children as is seen in the adult population. While there are few studies measuring stiffness values in pediatric populations, there is discrepancy in reported results. The mean liver stiffness in our population was 0.33kPa ± 0.014 SD compared to 2.2kPa ±.3 per Etchell et all and 2.45kPa ±0.35 per Sawh et al.13,14CONCLUSION
Childhood obesity and its negative effects are on the rise. It is important to identify illness and disease as early as possible to slow down or reverse progression. We have shown here that, in addition to impacts on liver adiposity, childhood obesity can have impacts on critical brain regions using the sensitive measure of tissue microstructure of MRE. However, a larger population including a broader range of obesity would be helpful in further evaluations of the relationship between changes in the liver and the brain.Acknowledgements
Dr. Bradley P. Sutton, PhD
Dr. Naiman A. Kahn, PhD
Dr. Corinne Cannavale, PhD
Dr. Aaron T. Anderson, PhD
References
1. Obita, G., & Alkhatib, A. (2022). Disparities in the prevalence of childhood obesity-related comorbidities: A systematic review. Frontiers in Public Health, 10, 1–16. https://doi.org/10.3389/fpubh.2022.923744
2. Shuster, A., Patlas, M., Pinthus, J. H., & Mourtzakis, M. (2012). The clinical importance of visceral adiposity: A critical review of methods for visceral adipose tissue analysis. The British Journal of Radiology, 85(1009), 1–10. https://doi.org/10.1259/bjr/38447238
3. Meo, S. A., Altuwaym, A. A., Alfallaj, R. M., Alduraibi, K. A., Alhamoudi, A. M., Alghamdi, S. M., & Akram, A. (2019). Effect of obesity on cognitive function among school adolescents: A cross-sectional study. Obesity Facts, 12(2), 150–156. https://doi.org/10.1159/000499386
4. Moran, A., Jacobs, D. R., Steinberger, J., Hong, C. P., Prineas, R., Luepker, R., & Sinaiko, A. R. (1999). Insulin resistance during puberty: Results from clamp studies in 357 children. Diabetes, 48(10), 2039–2044. https://doi.org/10.2337/diabetes.48.10.2039
5. Nguyen, J. C., Killcross, A. S., & Jenkins, T. A. (2014). Obesity and cognitive decline: Role of inflammation and vascular changes. Frontiers in Neuroscience, 8. https://doi.org/10.3389/fnins.2014.00375
6. Kamijo, K., Kahn, N. A., Pontifex, M.B., Scudder, M. R., Drollette, E. S., Raine, L. B., Evans, E. M., Castelli, D. M., & Hillman, C. H. (2012). The relation of adiposity to cognitive control and scholastic achievement in preadolescent children. Obesity (Silver Spring), 20(12), 2406-2411. https://doi.org/10.1038/oby.2012.112
7. Young, J. L., Xin, Y., Rajesh, M., & Cai, L. (2022). Editorial: Cardiovascular diseases related to diabetes and obesity – volume II. Frontiers in Endocrinology, 13. https://doi.org/10.3389/fendo.2022.1044326
8. Micklesfield, L. K., Goedecke, J. H., Punyanitya, M., Wilson, K. E., & Kelly, T. L. (2012). Dual‐Energy x‐ray performs as well as clinical computed tomography for the measurement of visceral fat. Obesity, 20(5), 1109–1114. https://doi.org/10.1038/oby.2011.367
9. Centers for Disease Control and Prevention. (2022, September 14). BMI Calculator Child and teen. Centers for Disease Control and Prevention. https://www.cdc.gov/healthyweight/bmi/calculator.html
10. Johnson, C. L., Holtrop, J. L., McGarry, M. D. J., Weaver, J. B., Paulsen, K. D., Georgiadis, J. G., & Sutton, B. P. (2013). 3D multislab, multishot acquisition for fast, whole‐Brain MR Elastography with high signal‐to‐Noise efficiency. Magnetic Resonance in Medicine, 71(2), 477–485. https://doi.org/10.1002/mrm.25065
11. Snap home. ITK. (n.d.). http://www.itksnap.org/pmwiki/pmwiki.php
12. Freesurfermethodscitation - Free Surfer Wiki. (2021, January 19). https://freesurfer.net/fswiki/FreeSurferMethodsCitation
13. Etchell, E., Jugé, L., Hatt, A., Sinkus, R., & Bilston, L. E. (2017). Liver stiffness values are lower in pediatric subjects than in adults and increase with age: A multifrequency mr Elastography study. Radiology, 283(1), 222–230. https://doi.org/10.1148/radiol.2016160252
14. Sawh, M. C., Newton, K. P., Goyal, N. P., Angeles, J. E., Harlow, K., Bross, C., Schlein, A. N., Hooker, J. C., Sy, E. Z., Glaser, K. J., Yin, M., Ehman, R. L., Sirlin, C. B., & Schwimmer, J. B. (2019). Normal range for MR elastography measured liver stiffness in children without liver disease. Journal of Magnetic Resonance Imaging, 51(3), 919–927. https://doi.org/10.1002/jmri.26905
Figures

Table 1 Demographics
Body mass index (BMI), percent body mass index (%BMI), whole body fat percentage (WBTOT_PFAT), visceral fat mass (VFAT_MASS)
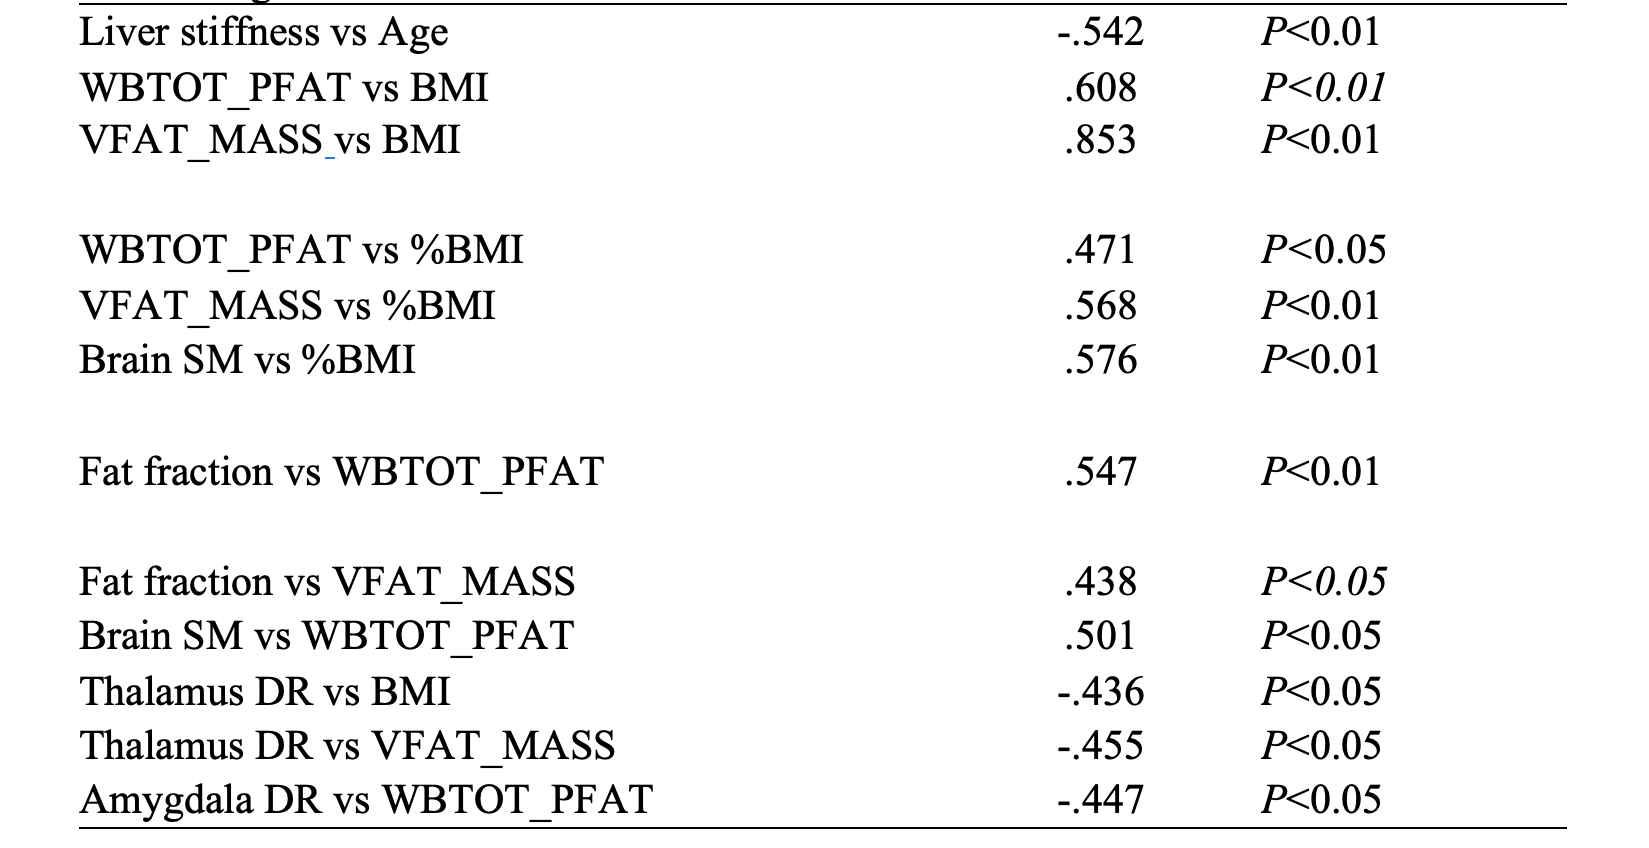
Table 2 Stiffness Correlations
Whole body fat percentage (WBTOT_PFAT), visceral fat mass (VFAT_MASS), damping ratio (DR), body mass index (BMI), percent body mass index (%BMI)
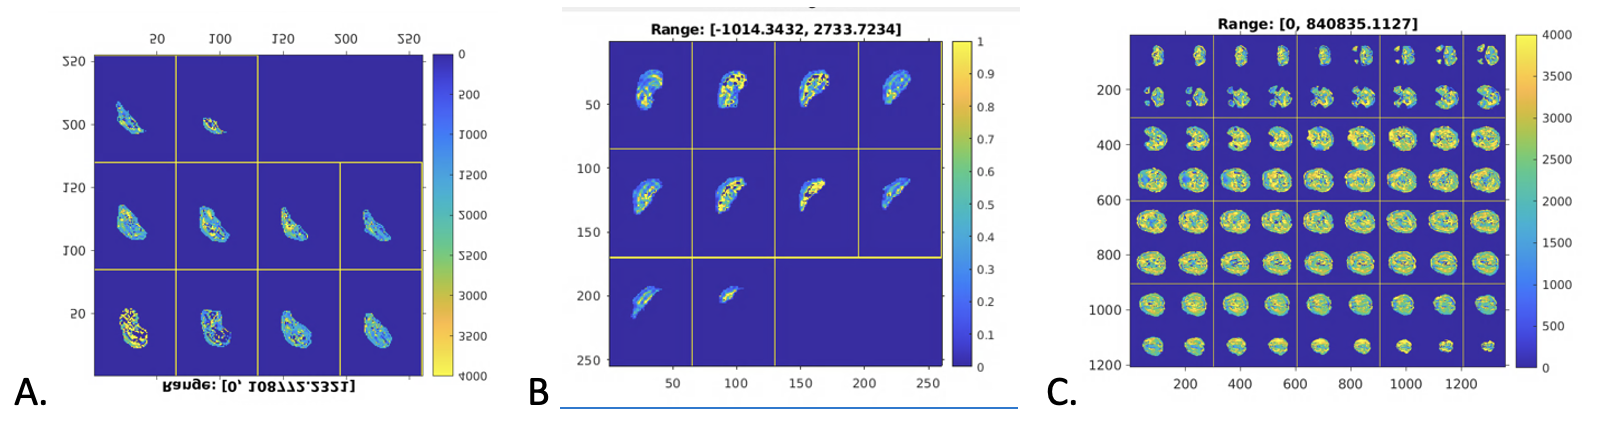
Figure 1 Stiffness Maps
A. Stiffness map of liver. B. Damping ratio of liver. C. Stiffness map of brain. All images are from same subject.