2539
Modified Look-Locker PETRA MRI for Quiet 3D T1 Mapping1Faculty of Science and Engineering, University of Nottingham Ningbo China, Ningbo, China, 2Xingaoyi Medical Equipment Co. Ltd, Ningbo, China, 3Nottingham Ningbo China Beacons of Excellence Research and Innovation Institute, Ningbo, China
Synopsis
Keywords: Neuro, Pulse Sequence Design, T1 Mapping
Motivation: T1 mapping is essential for demyelination disease diagnosis and brain development assessment, but conventional sequences suffer from considerable acoustic noise or long scanning time.
Goal(s): This study aims to develop a silent, accurate and fast 3D T1 mapping method.
Approach: It uses inversion recovery-prepared rotating radial trajectories to avoid significant gradient switching, forming a series of images collected at different TIs.
Results: Its accuracy is compared with IRSE method, acquiring 0.9994 R2, and its feasibility is tested on the human brain with gray and white matter T1 values close to literatures. The SPL is measured only 1.5 dBA higher than the background noise.
Impact: The high acoustic noise of sequences like MPRAGE has disadvantages for pediatric imaging due to its risks of neonatal hearing loss and decreased scanning comfort. Our study might provide a solution with nearly silent sound and highly accurate measurements.
Introduction
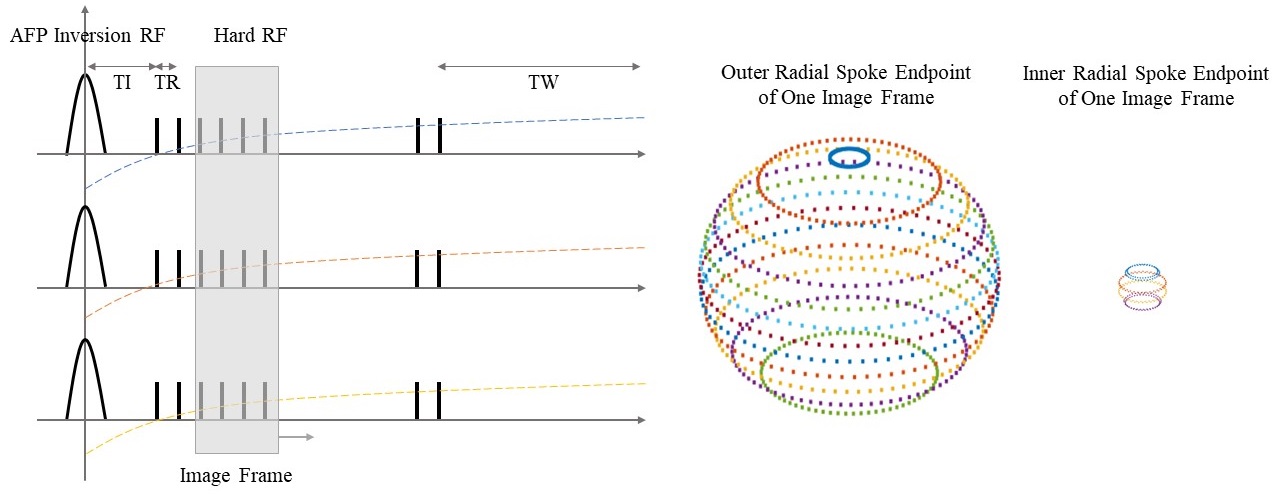
T1 mapping is widely used in MRI applications like neonatal brain development, demyelination disease, etc.1 The traditional inversion recovery spin-echo (IRSE) T1 mapping collects signal at different inversion times (TI) with long waiting time (TW) for signal recovery is quite time-consuming.2, 3 The commonly used magnetization-prepared rapid gradient echo (MPRAGE) has the disadvantage of high acoustic noise over 95 dBA which might be risky for patient hearing safety.4 In this study, we proposed a nearly inaudible 3D isotropic T1 mapping approach based on the 2D Look-Locker technique. The sequence applies radial spokes based on water and fat-suppressed proton projection MRI (WASPI) trajectory distribution and the gradient is ramped up before each excitation with small switching to maintain low acoustic noise.5 After each adiabatic inversion RF pulse, one segment of the spherical k space will be sampled by a long train of spokes with low flip angle (FA) and short TR, forming a series of images collected from moving time frames as shown in Figure 1. The trajectory is designed to have roughly uniform 3D distribution for each time frame. The longitudinal magnetization of the nth acquisition can be represented as Equation 1 for 3-parameter (T1, θ, M0) pixel-by-pixel curve fitting where $$$E_{TR}$$$ is $$$e^{-\frac{TR}{T1}}$$$, $$$E_{TI}$$$ is $$$e^{-\frac{TI}{T1}}$$$, $$$E_{TW}$$$ is $$$e^{-\frac{TW}{T1}}$$$, $$$θ$$$ is FA and N is the spoke number of each train.6, 7$$M_{n}=M_{0}(\frac{1-E_{TR}}{1-cosθE_{TR}}+(cosθE_{TR})^{n-1}(\frac{-\frac{1-E_{TR}}{1-cosθE_{TR}}cosθE_{TI}E_{TW}(1-(cosθE_{TR})^{N-1})-2E_{TI}+E_{TW}+1}{1+cosθE_{TI}E_{TW}(cosθE_{TR})^{N-1}}-\frac{1-E_{TR}}{1-cosθE_{TR}}))$$
Methods
The sequence parameters are set as: N=432, FOV=280 mm, matrix=256*256*256, hard RF $$$θ$$$=6 degrees, sampling frequency=10 kHz, TR=3.5 ms, TE=100 us, TI=10 ms, TW=500 ms, and total scanning time=10.5 min. For comparison, the IRSE sequence is also scanned with TR/TE=5000/11.2 ms, TI=(30, 530, 1030, 1530) ms, slice thickness=4 mm on the center slice with 2-parameter (T1, M0) fit. T1 mapping is tested on phantoms containing 1% agarose and different concentrations of GdCl3 (0, 3.7, 9.3, 18.1, 33.3, 66.8 and 200.8 umol/L) as well as the human brain on an XGY SuperScan-1.5T MR scanner (Xingaoyi Medical Equipment Company, China). The image reconstruction uses 3D non-uniform Fourier transform (NUFFT) in Matlab (The MathWorks, USA). 11 under-sampled images from different TIs are reconstructed and fitted based on the above equation. A 4955 microphone (Bruel Kjaer, Denmark) and a 2250 sound level meter (Bruel Kjaer, Denmark) are placed in the isocenter of the scanner bore to measure the sound pressure level (SPL).Results
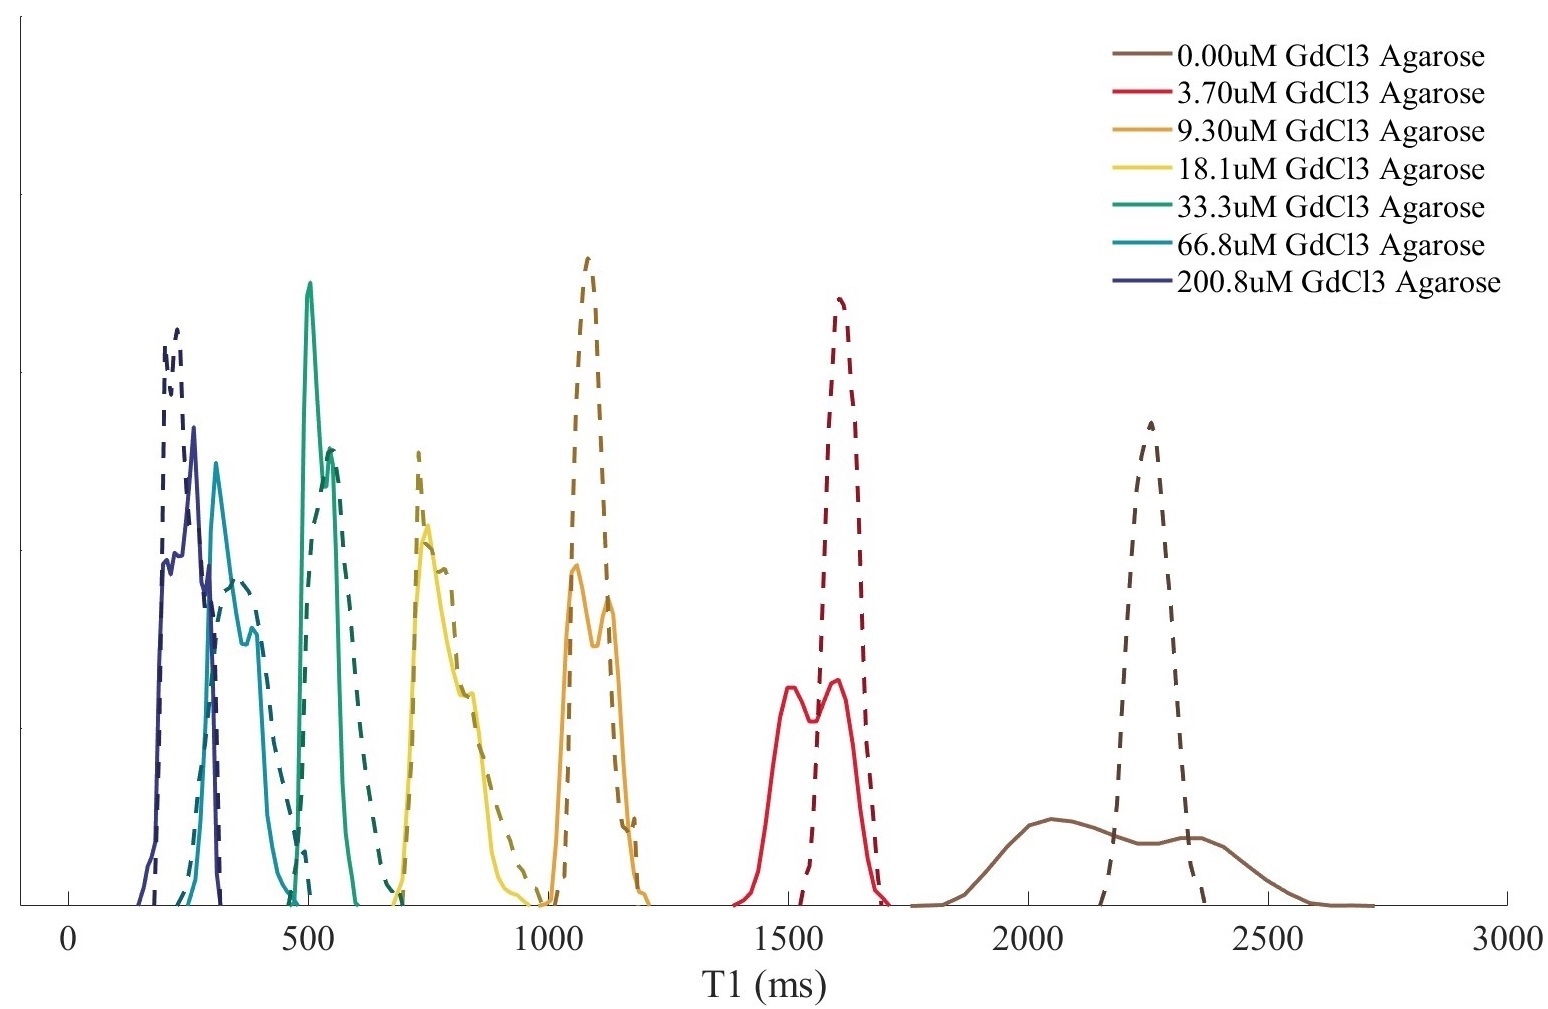
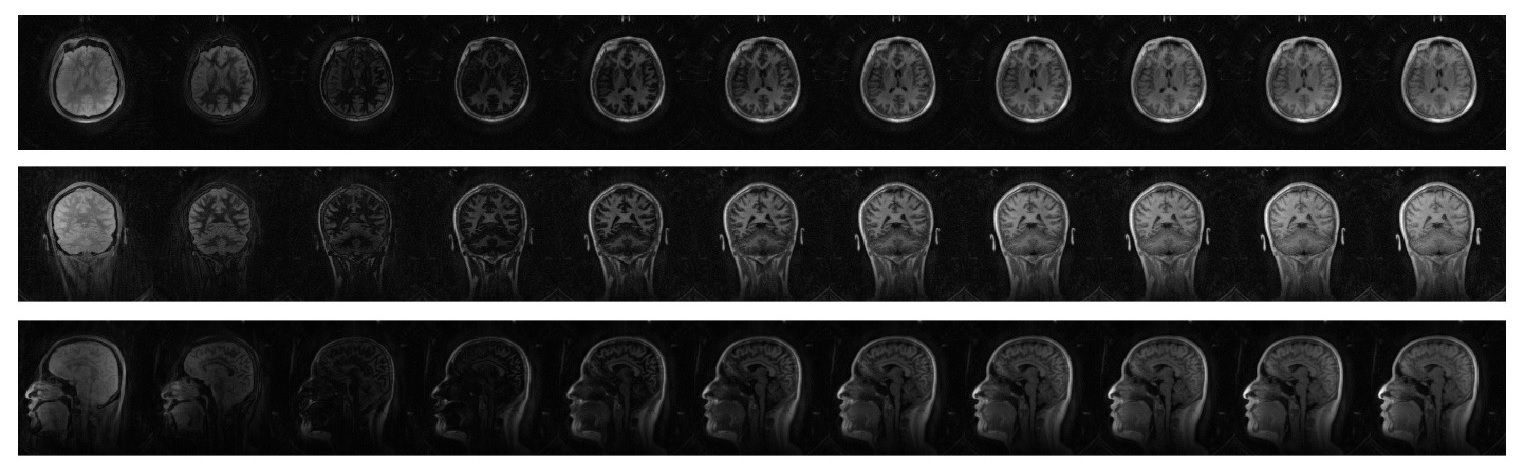
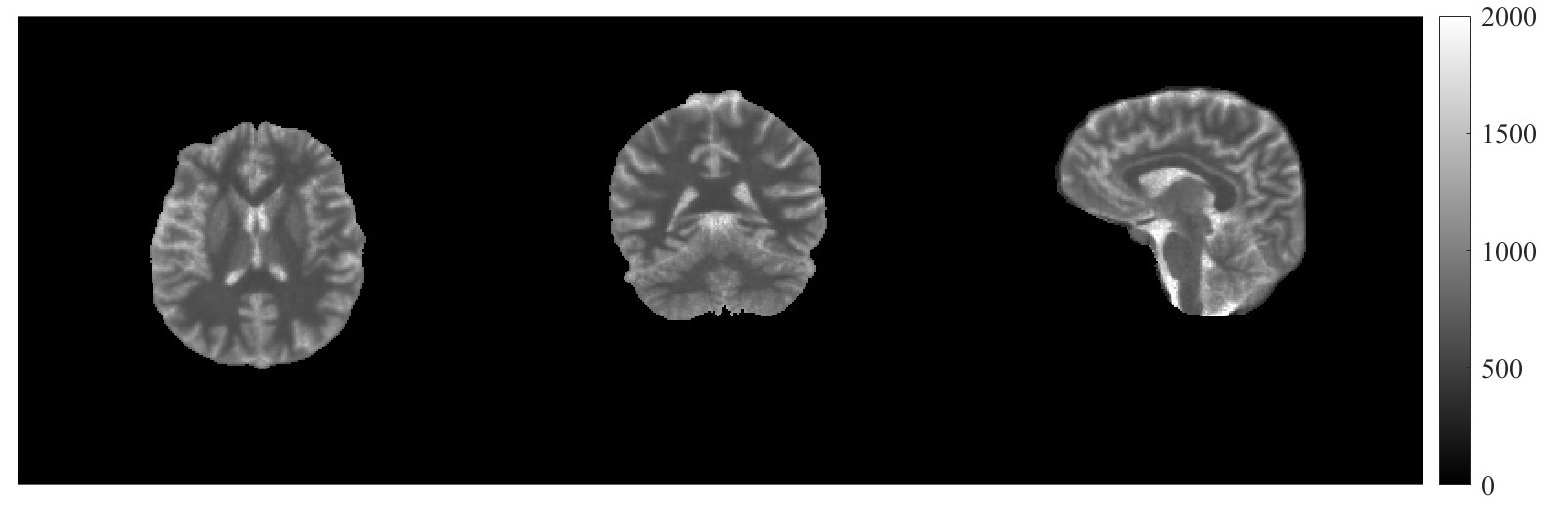
Figure 2 and Table 1 show the results of T1 mapping for the phantom study with high accuracy and precision (<10% relative error and 0.9994 correlation coefficient) compared with the IRSE method. A human normal brain T1 map calculated from images in Figure 3 is demonstrated in Figure 4 using the proposed sequence. The values of measured white matter and gray matter from extracted ROIs are 617.97±59.52 and 1037.52±129.08 ms, which are in agreement with the literature data.8 The mean SPL of the sequence is 66.4 dBA, only 1.5 dBA above the background noise. Some sequences with high acoustic noise like MPRAGE might harm neonatal hearing. This near-inaudible T1 mapping method with high accuracy can significantly increase patient comfort and hearing safety. Thus, its application practicability can be enhanced especially for pediatric imaging.Discussion
This quantitative T1 mapping method based on WASPI gradient trajectory and Look-Locker signal fitting shows its practicability on acoustic noise reduction and accurate T1 measurement within feasible scanning time. Compared with the IRSE method, this proposed approach provides accurate T1 values with a mean relative error of 3.19% in the range of around 200 to 2500 ms, though the standard deviation of higher T1 values goes larger and is slightly underestimated, which can be improved with longer TW. The scanning SPL is successfully reduced close to background noise.Conclusion
This study proposed and validated a silent, accurate and fast 3D T1 mapping method sampled by rotating radial trajectories in the phantom and in-vivo experiments. The almost removed acoustic noise improves patient comfort and safety, which is suitable for neonatal applications such as pediatric brain myelination process studies.Acknowledgements
No acknowledgement found.References
1. Fabienne K, Wolf-Julian N, Philip H, et al. Assessment of myelination in infants and young children by T1 relaxation time measurements using the magnetization-prepared
2 rapid acquisition gradient echoes sequence. Pediatric radiology. 2021;51(11):2058-2068. 2. Taylor, Andrew J, Michael S, et al. T1 mapping: basic techniques and clinical applications. JACC: Cardiovascular Imaging. 2016;9(1):67-81.
3. Stikov N, Boudreau M, Levesque R, et al. On the accuracy of T1 mapping: searching for common ground. Magn. Reson. Med. 2014;73(2):514–522.
4. Junjie Liu, Nicholas B, Afonso S. Rapid high-resolution three-dimensional mapping of T1 and age-dependent variations in the non-human primate brain using magnetization-prepared rapid gradient-echo (MPRAGE) sequence. NeuroImage. 2011;56(3):1154–1163.
5. Yao W, Guang D, Jerome A, et al. Water- and fat-suppressed proton projection MRI (WASPI) of rat femur bone. Magn. Reson. Med. 2007;57(3):554-567.
6. Look C, Locker R. Time saving in measurement of NMR and EPR relaxation times. Magn. Reson. Med. 1970;41(2):250-251.
7. Elizabeth H, Graeme M, Ting-Yim L, et al. A fast 3D Look-Locker method for volumetric T1 mapping. Magn. Reson. Imaging. 1990;17(8):1163–1171.
8. Wright J, Mougin E, Totman J, et al. Water proton T1 measurements in brain tissue at 7, 3, and 1.5 T using IR-EPI, IR-TSE, and MPRAGE: results and optimization. Magn. Reson. Mater. Phys., Biol. Med. 2008;21(1-2):121-130.
Figures