2537
Magnetic Resonance Image of Neonatal Acute Bilirubin Encephalopathy: A Quantitative Susceptibility Mapping Study1Department of Radiology, The First Affiliated Hospital of Nanjing Medical University, Nanjing, China, 2School of Biomedical Engineering, Shanghai Jiao Tong University, Shanghai, China, 3United Imaging Healthcare Group, Shanghai, China
Synopsis
Keywords: Neonatal, Brain
Motivation: Clinical diagnosis of neonatal acute bilirubin encephalopathy (ABE) based on the conventional MRI sequence has been limited by its difficulty in differentiating confounding image contrast changes associated with normal myelination.
Goal(s): This study aims to assess the value of quantitative susceptibility mapping (QSM) in detecting ABE and understanding its pathogenesis.
Approach: All MRI scans were carried out on 3.0T MR scanner (Omega, United Imaging Health Care, Shanghai, China) with multi-parametric MR imaging with flexible design (MULTIPLEX) transverse axis sequence.
Results: ABE caused significant magnetic susceptibility value changes in several brain regions which showed correlation with peak total serum bilirubin value.
Impact: Our study demonstrated that the brain regions with altered magnetic susceptibility values might be related with ABE pathology, which might be valuable for further studies. And QSM might have the potential efficacy in the auxiliary diagnosis of ABE.
Introduction
Neonatal hyperbilirubinemia is a common clinical disease that requires medical attention for newborns, which may develop into acute bilirubin encephalopathy (ABE), and carries a significant risk of long-term neurological dysfunction1. The current clinical challenge lies in the separation of acute bilirubin encephalopathy and non-acute bilirubin encephalopathy neonates since both of them demonstrated similar T1 hyperintensity, and the exact extent of the injury may not be recognizable with conventional sequences2. Moreover, the effects of hyperbilirubinemia on brain development are still under investigation. Quantitative susceptibility mapping (QSM) is a relatively new MRI technique for quantifying the spatial distribution of magnetic susceptibility within biological tissues, including iron, calcium, myelin, deoxyhemoglobin, and blood degradation products3. Recently, QSM has been used to study brain development in neonates4. This study aims to investigate the utility of QSM in diagnosing ABE.Methods
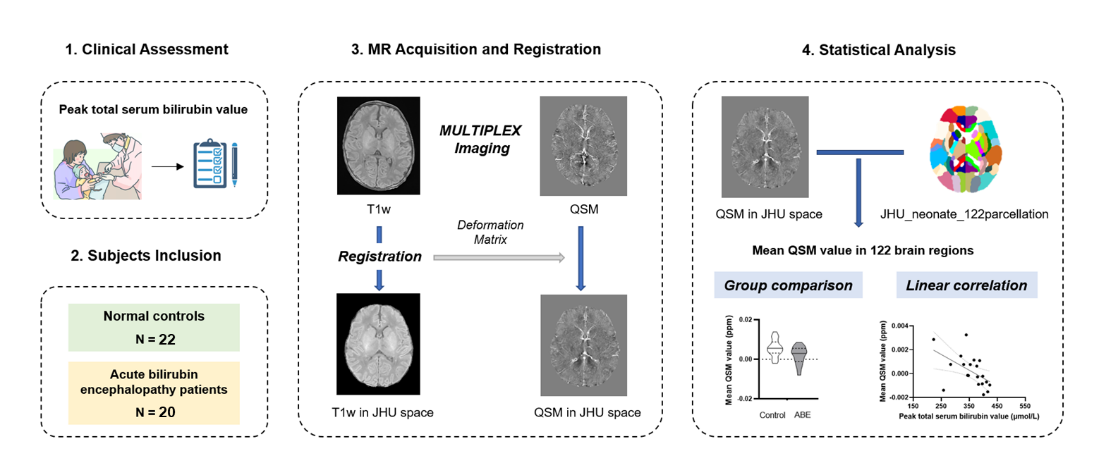
This retrospective study included 20 ABE and 22 non-ABE neonates (Table 1) who were scanned between September 2022 to June 2023 and for which synthetic MRI were performed as part of their routine neonatal MRI exam at term equivalent age(TEA, range 37 to 42 weeks). Head MRI scans were performed on 3.0T MR scanner (Omega, United Imaging Healthcare, Shanghai, China) using a 48-channel head coil. Conventional scans, including axial T2WI, T2WI-FLAIR(fluid attenuated inversion recovery), sagittal 3D T1WI, and diffusion-weighted imaging (DWI) were performed, followed by multi-parametric MR imaging with flexible design (MULTIPLEX) transverse axis sequence scans5 (TR=38.3ms, TE=4.25ms, FOV=180×180mm, scan matrix = 256×256, voxel size = 0.7×0.7×2.0 mm3, 42 slices, acquisition time = 6 min 57 sec). After visual quality assessment, T1W images were first registered to a JHU neonate T1 template in a common space6 using Advanced Normalisation Tools (ANTs). The resulting registration parameters matrix were applied to the corresponding QSM images. The mean magnetic susceptibility value of 122 brain areas (determined by JHU neonate atlas6) was extracted and then compared between groups. Correlation analysis was also performed to evaluate the relationship between magnetic susceptibility and serum bilirubin in neonates (Figure 1).Results
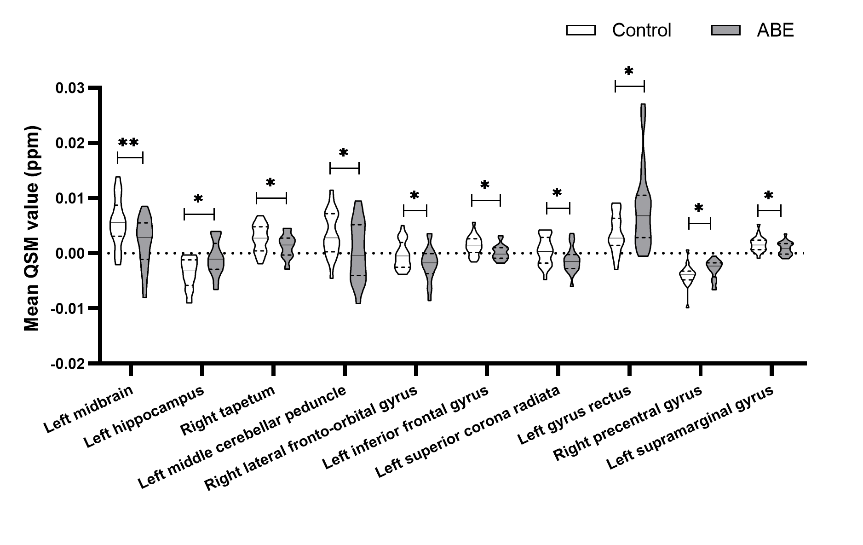
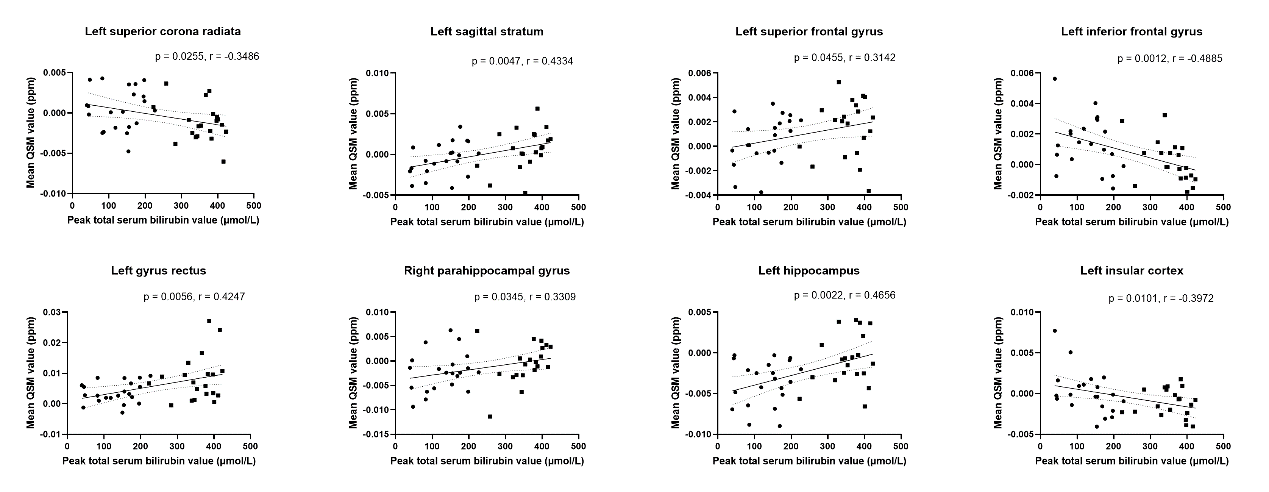
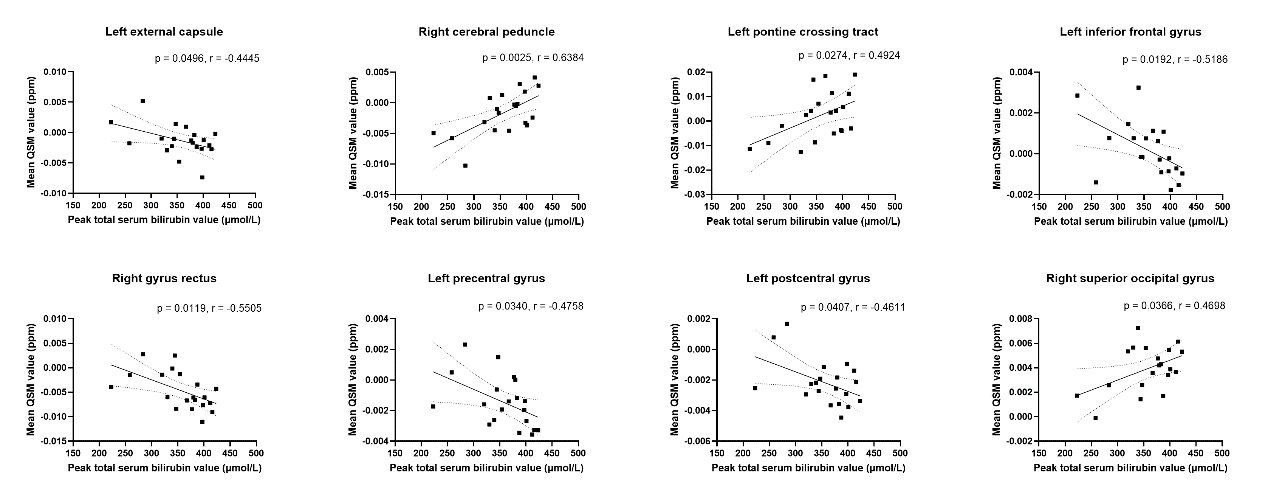
Demographic characteristics were showen in Table 1. ABE neonates showed higher magnetic susceptibility values in the left hippocampus, left gyrus rectus, right precentral gyrus, and lower magnetic susceptibility values in the left midbrain, right tapetum, left middle cerebellar peduncle, right lateral fronto-orbital gyrus, left inferior frontal gyrus, left superior corona radiata, left supramarginal gyrus compared with non-ABE neonates(all P<0.05, Figure 2). The result showed that the peak value of total serum bilirubin was negatively correlated with the mean QSM value of left superior corona radiata and left inferior frontal gyrus, and was positively correlated with that of left gyrus rectus and left hippocampus (P<0.05, Figure 3). In the ABE group alone, the peak value of total serum bilirubin still showed significant negative correlation with the mean QSM value of left superior corona radiata (P<0.05, Figure 4).Discussion
The result suggested that ABE neonates showed higher magnetic susceptibility values (i.e., becomes less diamagnetic) in the left hippocampus and right precentral gyrus. Hippocampus was the brain area most frequently involved in kernicterus7-8. Li et al. demonstrated that the white matter magnetic susceptibility first becomes more diamagnetic due to progressive myelination, followed by a continuous decreasing of diamagnetism as the brain ages secondary to demyelinating processes9. The increase of magnetic susceptibility values of these area may indicate the injury of myelin. ABE neonates showed lower magnetic susceptibility values in the left midbrain, right tapetum, left middle cerebellar peduncle, right lateral fronto-orbital gyrus, left inferior frontal gyrus, left superior corona radiata and left supramarginal gyrus. Due to excessive hemolysis, Fe and Cu are released from destructed red blood cells(RBCs). An excessive amount of free metals passes the immature BBB and accumulate in brain cells, leading to the development of bilirubin encephalopathy3. We speculated that the changes of QSM values in these brain regions are the result of synergistic effect of these metal substances and myelin development abnormalities or just caused by bilirubin itself. Bilirubin toxicity in the cerebellum (middle cerebellar peduncle) and auditory system (midbrain) have been proven in previous studies7. Previous studies have identified QSM asymmetries in neonatal and adult brain morphology10-12. In our study, the brain regions involved in the ABE pathology were prone to be located in the left brain.Conclusion
Quantitative susceptibility mapping appears to noninvasively assess of brain damage caused by hyperbilirubinemia in vivo and provide further insight into the pathophysiologic features of ABE.Acknowledgements
No acknowledgement found.References
1. Maimburg RD, Bech BH, Vaeth M, et al. Neonatal jaundice, autism, and other disorders of psychological development. Pediatrics 2010;126(5):872-8.
2. Wu M, Shen X, Lai C, et al. Detecting neonatal acute bilirubin encephalopathy based on T1-weighted MRI images and learning-based approaches. BMC Med Imaging 2021;21(1):103.
3. Viktorinova A. Current insights on the role of iron and copper dyshomeostasis in the pathogenesis of bilirubin neurotoxicity. Life Sci 2017;191:34-45.
4. Otani S, Fushimi Y, Iwanaga K, et al. Evaluation of deep gray matter for early brain development using quantitative susceptibility mapping. Eur Radiol 2023;33(6):4488-99.
5. Ye Y, Lyu J, Hu Y, et al. MULTI-parametric MR imaging with fLEXible design (MULTIPLEX). Magnetic resonance in medicine 2022;87(2):658-73.
6. Oishi K, Mori S, Donohue PK, et al. Multi-contrast human neonatal brain atlas: application to normal neonate development analysis. Neuroimage 2011;56(1):8-20.
7. Hansen TWR, Wong RJ, Stevenson DK. Molecular Physiology and Pathophysiology of Bilirubin Handling by the Blood, Liver, Intestine, and Brain in the Newborn. Physiol Rev 2020;100(3):1291-346.
8. Zheng H, Lin J, Lin Q, et al. Magnetic Resonance Image of Neonatal Acute Bilirubin Encephalopathy: A Diffusion Kurtosis Imaging Study. Frontiers in neurology 2021;12:645534.
9. Li W, Wu B, Batrachenko A, et al. Differential developmental trajectories of magnetic susceptibility in human brain gray and white matter over the lifespan. Human brain mapping 2014;35(6):2698-713.
10. Hill J, Dierker D, Neil J, et al. A surface-based analysis of hemispheric asymmetries and folding of cerebral cortex in term-born human infants. The Journal of neuroscience : the official journal of the Society for Neuroscience 2010;30(6):2268-76.
11. Koelkebeck K, Miyata J, Kubota M, et al. The contribution of cortical thickness and surface area to gray matter asymmetries in the healthy human brain. Human brain mapping 2014;35(12):6011-22.
12. Machado-Rivas F, Gandhi J, Choi JJ, et al. Normal Growth, Sexual Dimorphism, and Lateral Asymmetries at Fetal Brain MRI. Radiology 2022;303(1):162-70.
Figures