2536
MRS measured brain metabolite alterations in autism: a meta-analysis.1King's College London, London, United Kingdom, 2MRC Centre for Neurodevelopmental Disorders, London, United Kingdom, 3Centre for the Developing Brain, London, United Kingdom
Synopsis
Keywords: Neuro, Brain, Spectroscopy, Autism, Neurological, Analysis
Motivation: 1H-Magnetic Resonance Spectroscopy (MRS) studies have revealed alterations in neuro-metabolite concentrations in autism, but results have been inconsistent.
Goal(s): Perform a comprehensive meta-analysis of previous MRS studies in autism.
Approach: Data was included from 59 relevant studies. After assessment of data quality, data was grouped by metabolite, brain region and other demographic and methodological factors.
Results: We find significantly lower concentrations of GABA and NAA in autism. These alterations were most pronounced in children and in limbic brain regions involved in processes relevant to autism phenotypes. We also investigate factors that contribute to effect size variation between studies, including MRS quantification method.
Impact: Our meta-analysis comprehensively summarises previous MRS studies to provide evidence of regional disruptions to brain metabolite concentrations in autism. We also examine how MRS study outcome varies due to methodological and demographic factors.
Introduction
Evidence suggests that a key pathophysiological feature of autism is an imbalance between excitatory/inhibitory (E/I) neural activity1. This is predominantly determined by glutamate and gamma-aminobutyric acid (GABA), the adult brain’s principal excitatory and inhibitory neurotransmitters respectively. 1H-Magnetic Resonance Spectroscopy (MRS) can be used to quantify the concentrations of glutamate and GABA in the brain in vivo, and thus is valuable for validating the E/I imbalance hypothesis in humans. However, MRS findings in the context of autism have been inconsistent2. To comprehensively summarise this previous work, we performed a meta-analysis of MRS studies in autistic and neurotypical (NT) participants measuring GABA and/or glutamate, as well as metabolites involved in energy metabolism (glutamine, creatine), and neural integrity (e.g., n-acetyl aspartate (NAA), choline). We find strong evidence for neuro-metabolic alterations in autism. We also show how MRS methodological and demographic factors contributed to the heterogeneity of previous findings to guide researchers towards replicable MRS study designs.Methods
Study searchA systematic search of databases (Ovid Medliner, Pubmed, etc.) was performed. Relevant abstracts were independently assessed by two investigators (NAP and AT) using the following criteria: (1) use of in-vivo MRS; (2) investigation of brain metabolite concentrations in autism and NT (3) a specified brain region (4) published in a peer-reviewed journal. Reasons for exclusion were documented.
Quality assessments
The consensus MRS quality appraisal tool ‘MRS-Q’3-4 was used to categorise studies as ‘high quality’, ‘low quality’ or ‘unsure’ based on reporting of spectroscopy parameters. Egger’s regression and trim-and-fill tests were used to assess for publication bias in included studies 5-7.
Data extraction
Data were extracted and grouped by metabolite, brain region and other demographic and methodological factors.
Data analysis
Standardized mean differences (Hedges’ G) and 95% confidence intervals were calculated from the mean metabolite concentrations and standard deviation in the autism and NT group. The robust variance estimation method was used to account for non-independent data 7-9. Heterogeneity of data was evaluated using I2 and Tau2 10-11. The R forestplot function was used to plot data. The cor function was used to estimate the Spearman’s rho correlation coefficient between voxel size/number of transients and effect size.
Results
59 studies were included in the meta-analysis after screening (Figure 1), most of these (88%) reported methods that satisfied the MRS-Q criteria and so were deemed to be of high quality (Figure 2). Figure 3 shows that when data were grouped by metabolite, we observed significantly lower concentrations of NAA and GABA in autism (significant negative group effect size). Figure 4 shows that when data were grouped by metabolite, brain region and age of cohort, we observed significantly lower concentrations of limbic NAA and GABA in children but not in adults with autism (significant negative group effect sizes). We observed no significant alterations in Glx/Glu. Figure 5 shows that studies that did not include at least a 1:3 female:male ratio in cohorts (this being the population prevalence) observed significantly lower GABA concentrations in autism, while studies that did observed no significant alteration in GABA concentrations (non-significant group effect size). Similarly, studies including individuals on psychotropic medications observed significantly lower GABA concentrations in autism (significant negative group effect size), while studies excluding psychotropic mediation use observed no significant GABA alteration (non-significant effect size). Finally, studies reporting metabolite concentrations as creatine ratios observed significantly lower GABA concentrations in autism (significant negative group effect size), while studies reporting estimated metabolite concentrations (in i.u.) observed no significant GABA alteration (non-significant effect size). Voxel size/number of transients showed no relationship with study effect size. When low quality MRS studies were excluded (assessed by MRS-Q), all trends identified were preserved (not shown).Discussion
Overall, we find evidence of autism-associated neuro-metabolite alterations. We find that autistic children have significantly lower concentrations of limbic NAA. This is likely indicative of structural differences and/or mitochondrial differences in this region12-17. We also find evidence of uncompensated shifts in E/I imbalance; autistic children have significantly lower limbic GABA concentrations, while we observe no significant alterations to Glx/glutamate concentrations. The severity of alterations in both NAA and GABA have been shown to correlate with the severity of autism clinical scores (e.g. autistic mannerisms & sensory processing differences18-22), suggesting that these differences mechanistically contribute to the expression of autism phenotypes in children, with GABA specifically representing a valid therapeutic target23. Finally, we observe that cohort sex, psychotropic medication use, and MRS quantification method influence the degree of GABA alteration observed and so likely contribute to the heterogeneity of previous findings. Compliance with consensus MRS parameters and adequate reporting is essential to address this.Acknowledgements
No acknowledgement found.References
Figures
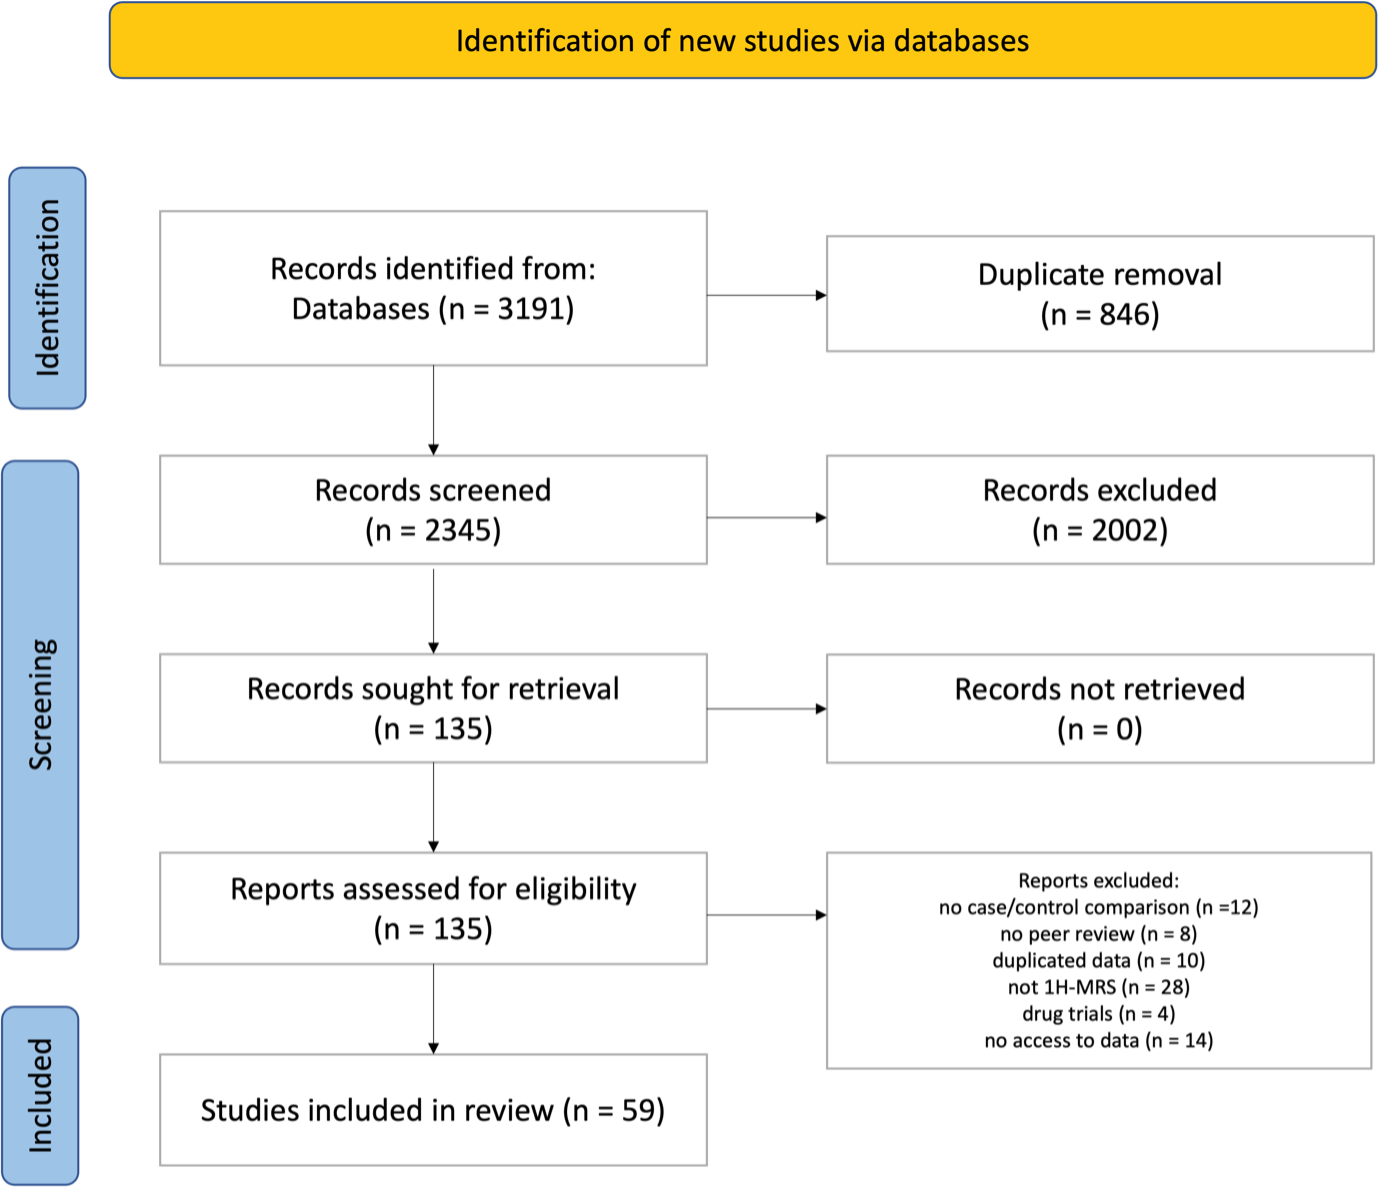
Figure 1. PRIMSA flow diagram of study selection.
3191 studies were identified in the initial database search. After duplicated removal, relevant abstracts were independently assessed by two investigators (NAP and AT). This was followed by full text screening, with reasons for exclusion documented. Overall, 59 studies are included in this meta-analysis.
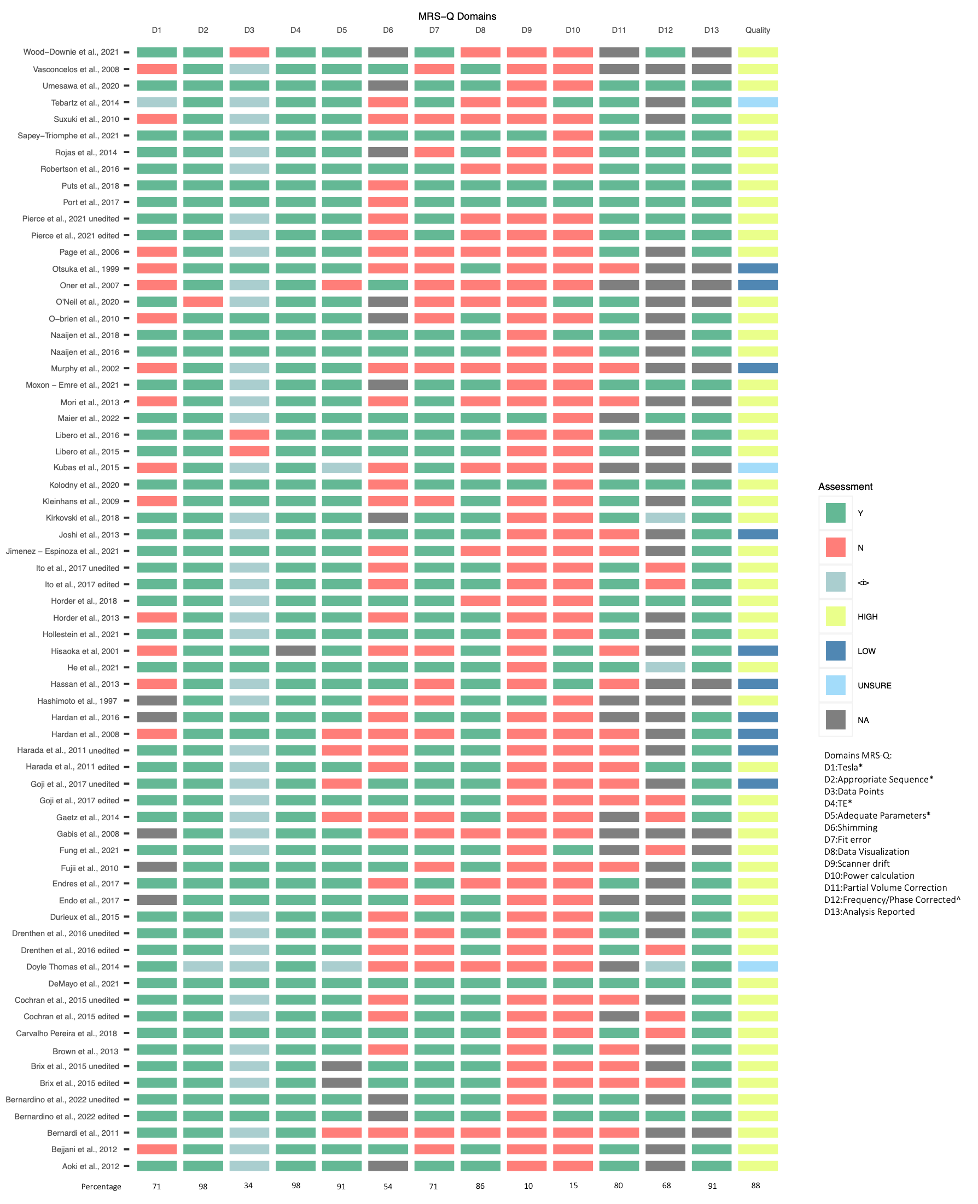
Figure 2. MRS quality as assessed by MRS-Q.
The quality appraisal tool ‘MRS-Q’ was used to assess if reported MRS acquisition parameters satisfied consensus standards. Studies were classified as ‘high quality’, ‘low quality’, or ‘unsure’ when insufficient information was provided. Two investigators (NAP and AT) independently assessed the quality of each study. * = used for quality assessment of quality of MRS acquisition and reporting. ^ = only applicable to edited MRS.
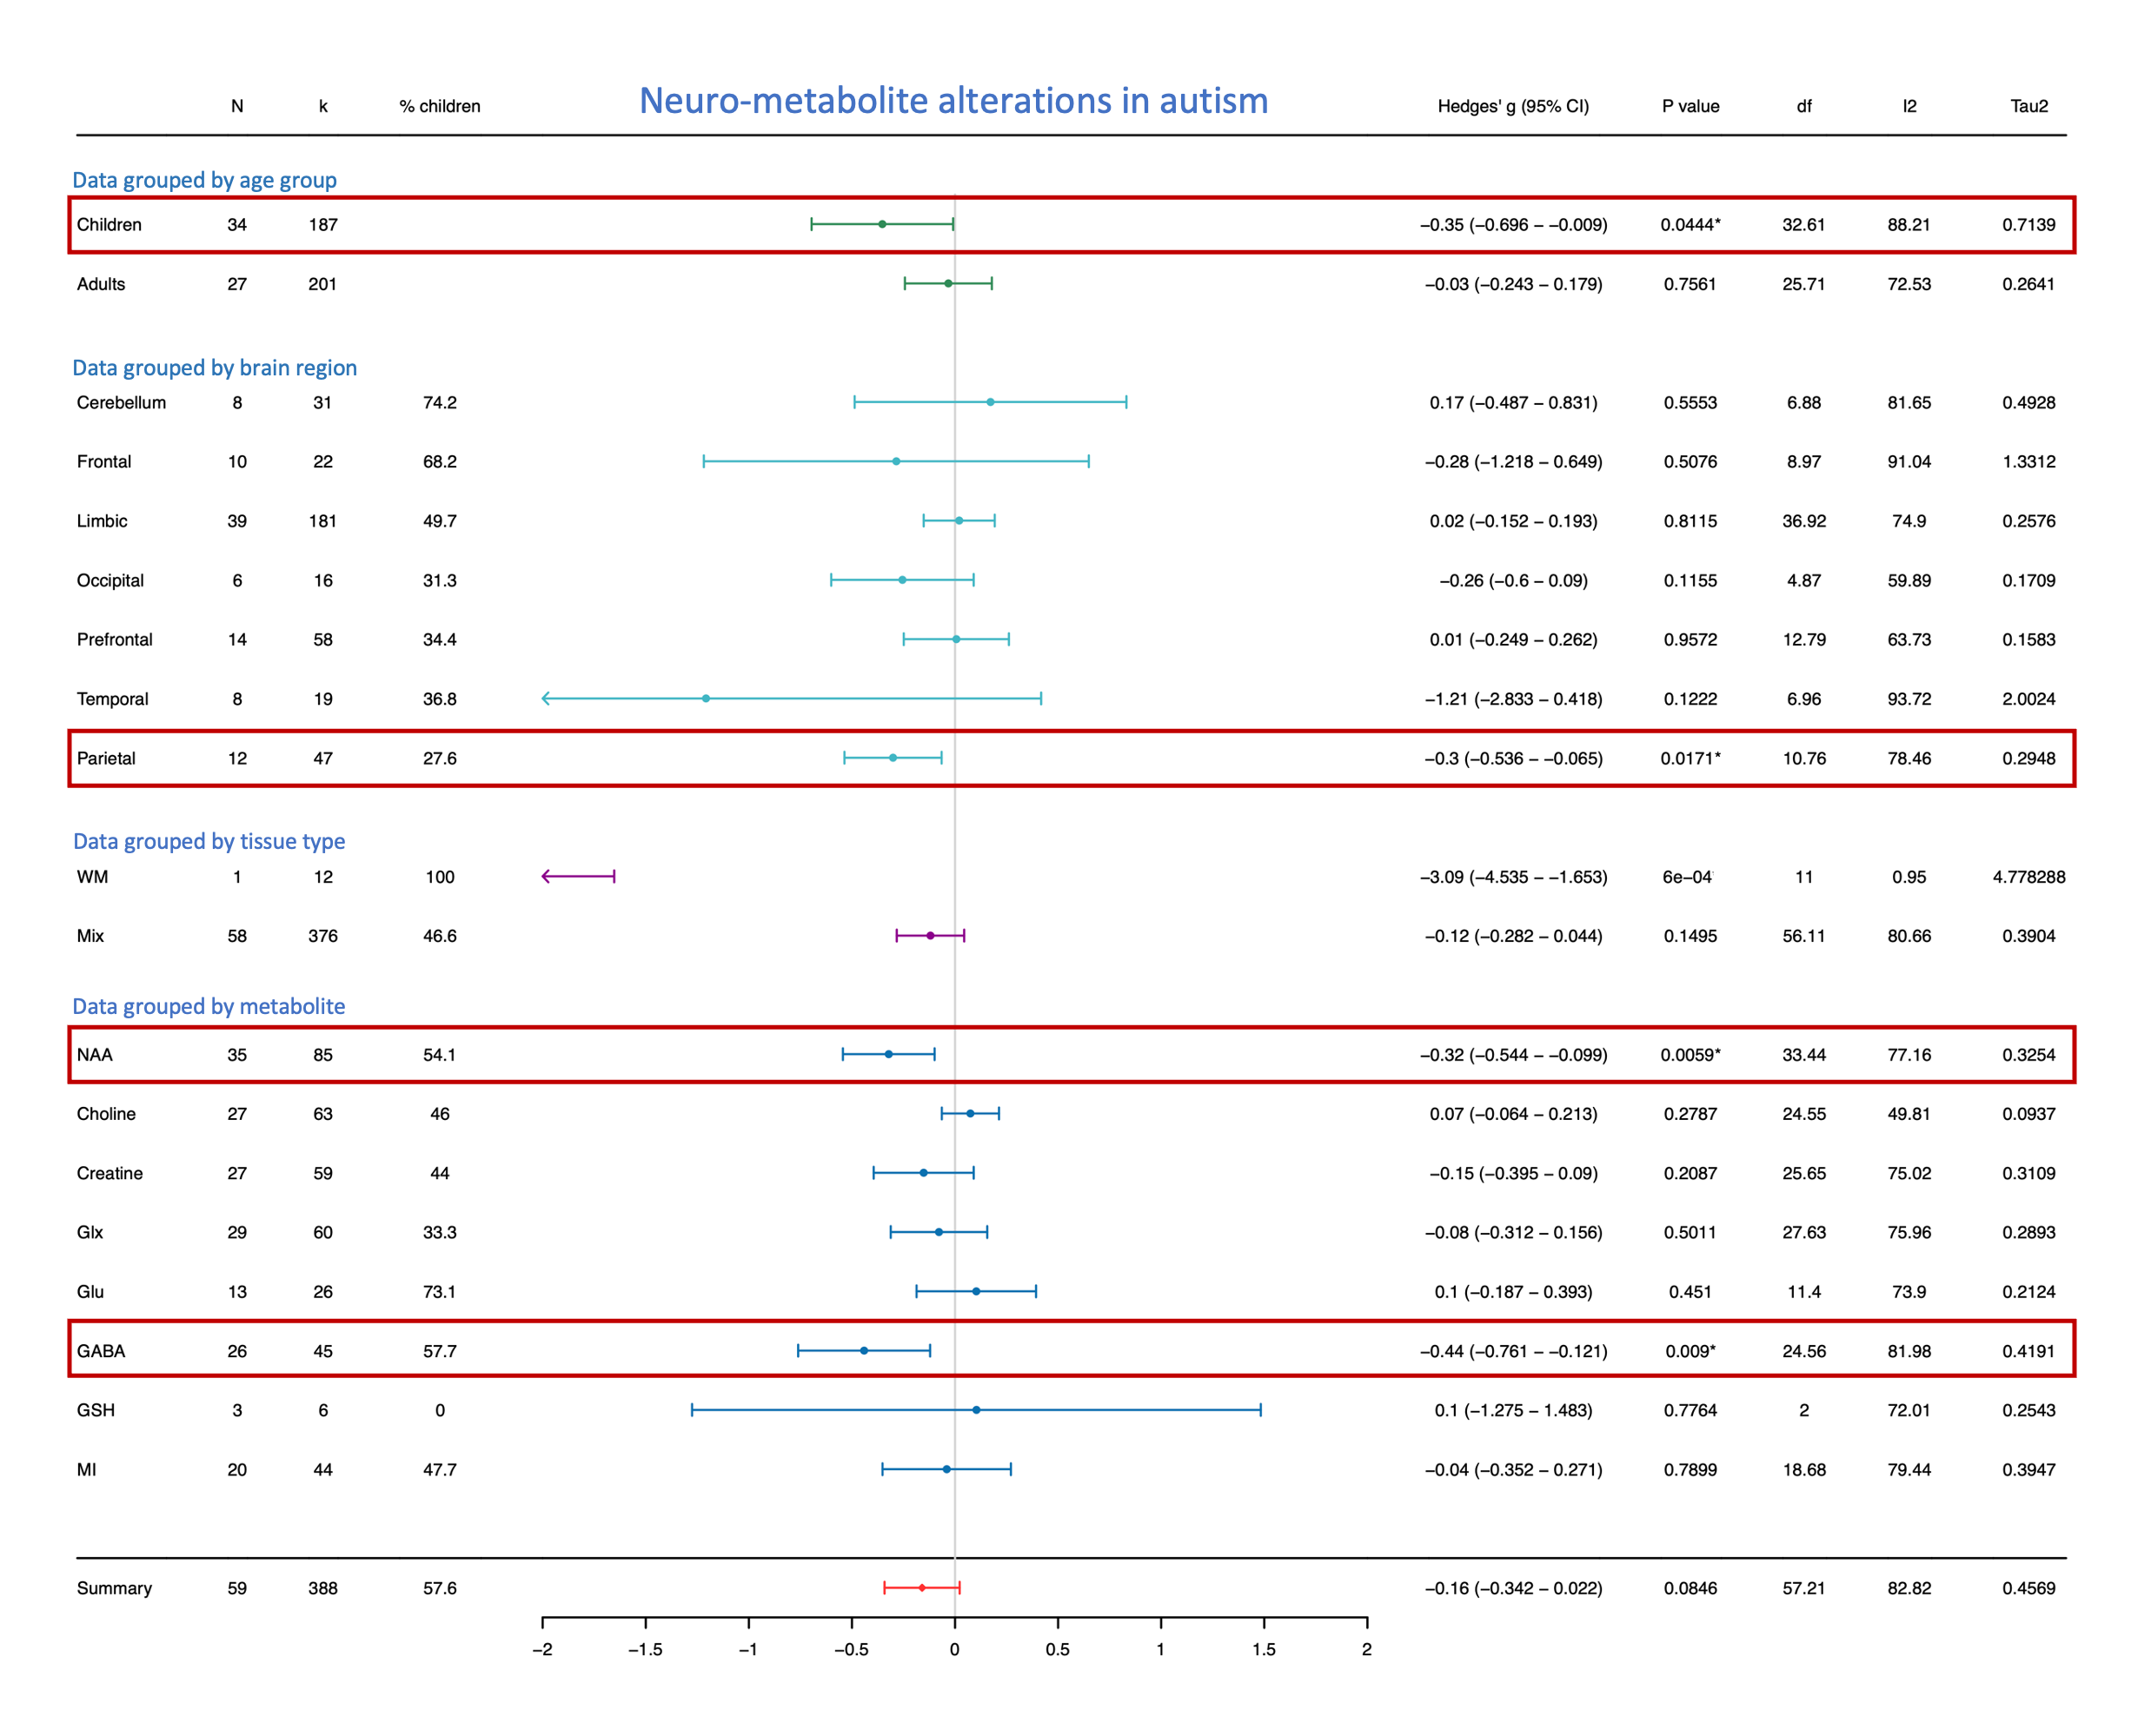
Figure 3. Summary forest plot for data grouped by age, brain region, voxel tissue type, and metabolite of interest. N: number of studies, k: number of observations, % children: percentage of studies observing metabolite concentrations in children only cohorts, I2: measure of between study heterogeneity, Tau2: variance in true effect sizes (another measure of between study heterogeneity). * statistically significant at p < 0.05, and at p < 0.01 when the degrees of freedom < 4.
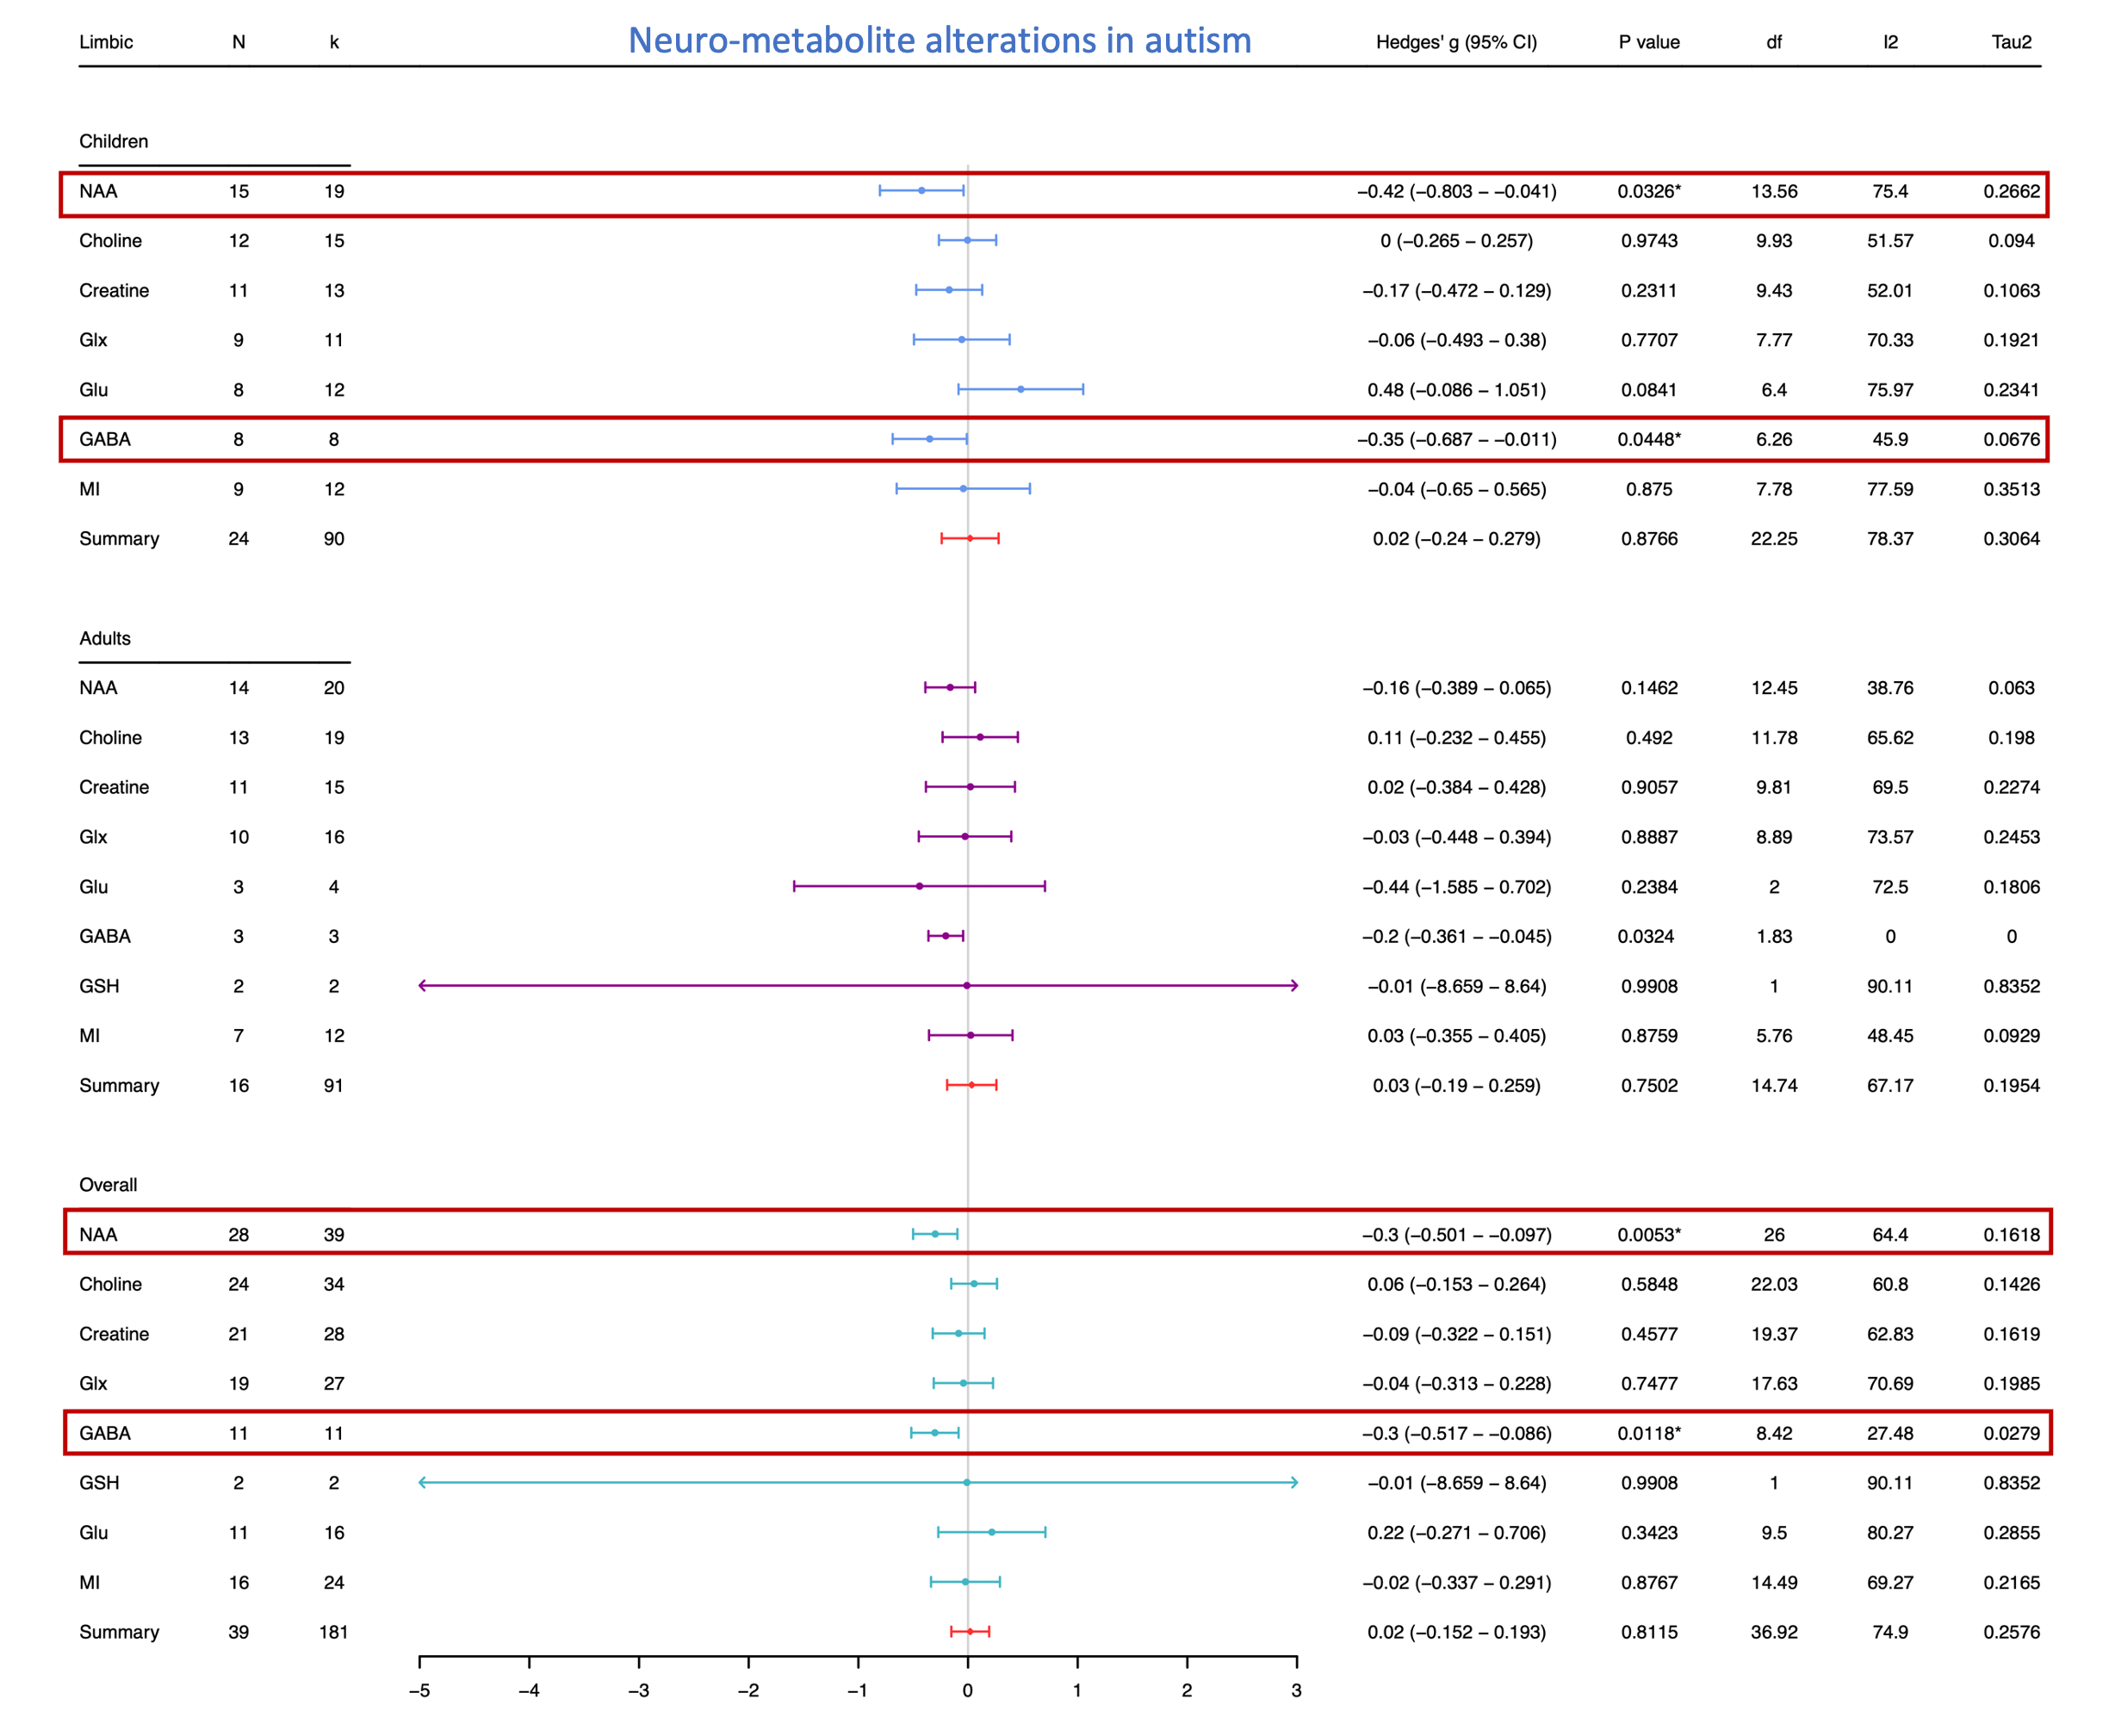
Figure 4. Summary forest plot findings in the limbic regions split by metabolite and age group (children, adults, and pooled ages (overall)). N: number of studies, k: number of observations, % children: percentage of studies observing children only, I2: measure of between study heterogeneity, Tau2: variance in true effect sizes (another measure of between study heterogeneity). * statistically significant at p < 0.05, and at p < 0.01 when the degrees of freedom < 4.
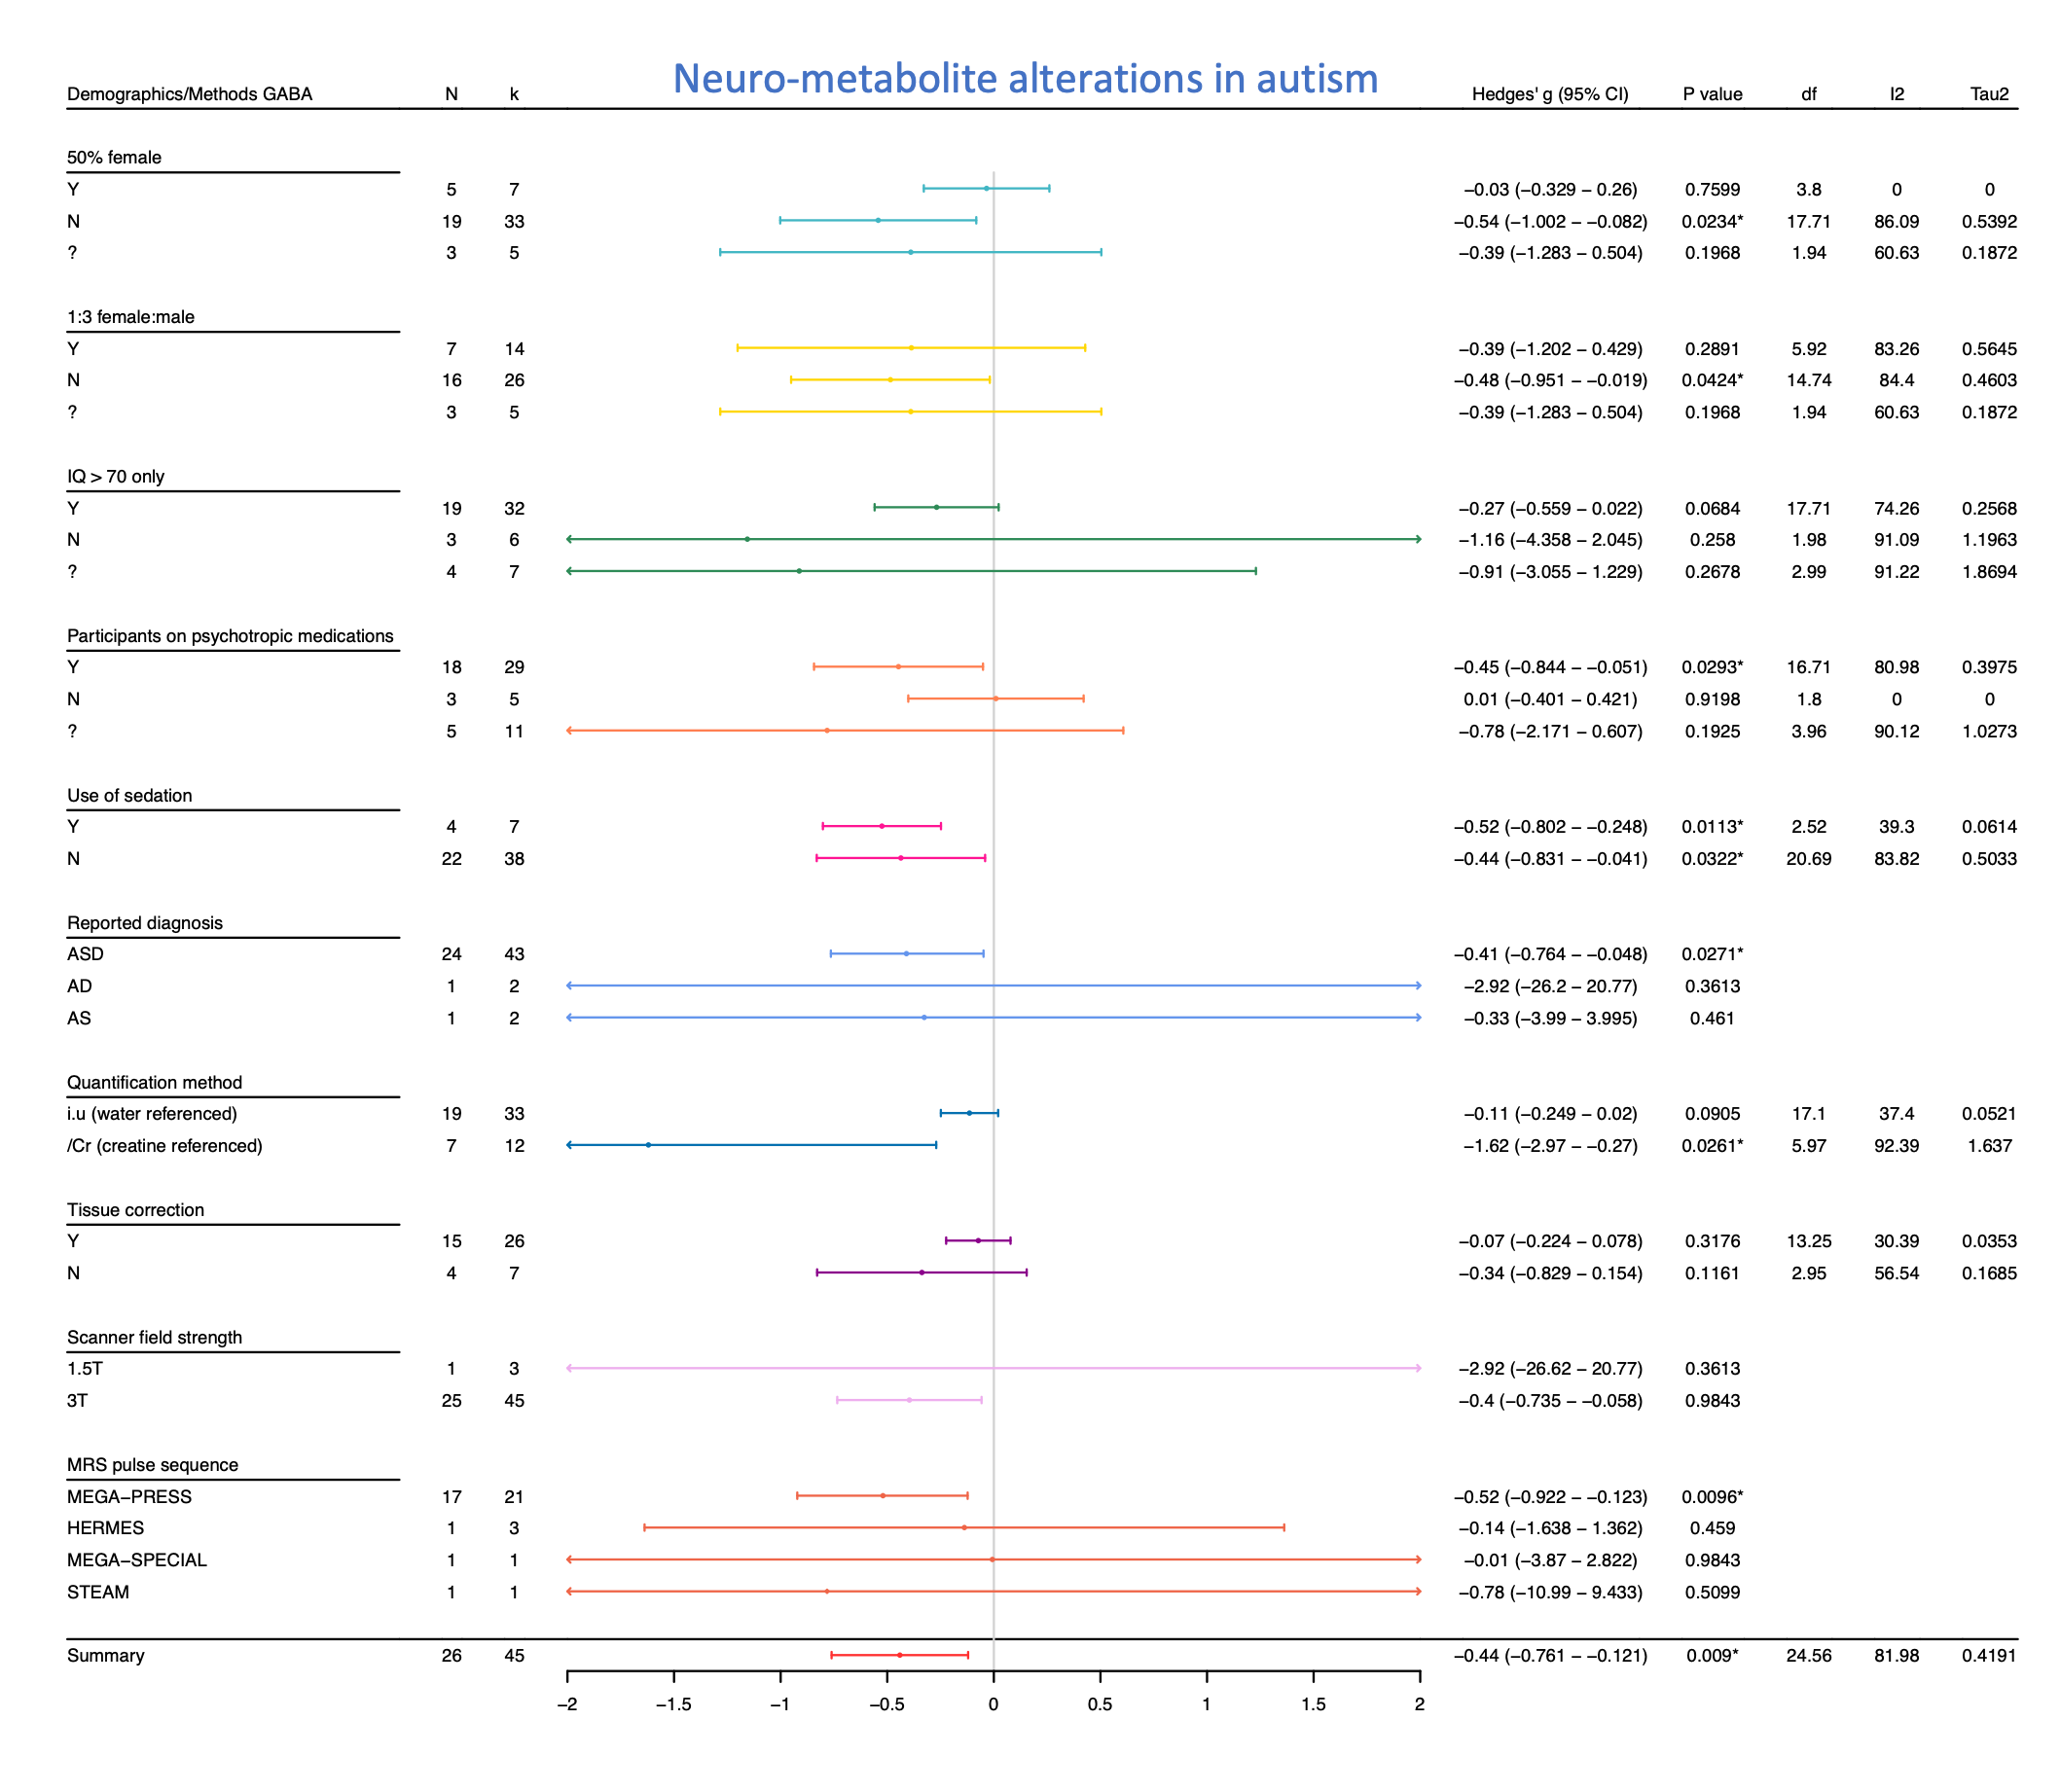
Figure 5. Forest plot summary of GABA data grouped by several demographic and MRS acquisition parameters. N: number of studies, k: number of observations, % children: percentage of studies observing children only, I2: measure of between study heterogeneity, Tau2: variance in true effect sizes (another measure of between study heterogeneity). * statistically significant at p < 0.05, and at p < 0.01 when the degrees of freedom < 4.