2534
Evaluation of a rapid multi-parametric quantitative brain mapping method in awake children1Radiology, Cincinnati Children's Hospital Medical Center, Cincinnati, OH, United States, 2Radiology, University of Cincinnati College of Medicine, Cincinnati, OH, United States, 3Neurodevelopmental Disorders Prevention Center, Cincinnati Children's Hospital Medical Center, Cincinnati, OH, United States, 4Pediatrics, University of Cincinnati College of Medicine, Cincinnati, OH, United States
Synopsis
Keywords: Neuro, Brain, Brain, quantitative imaging, relaxometry, pediatric, synthetic MR
Motivation: Rapid multi-contrast MRI acquisitions are crucial to minimize motion artifacts in awake pediatric subjects.
Goal(s): To evaluate a newly developed EPI-based multi-contrast MRI sequence for generating multi-parametric quantitative brain maps in awake pediatric participants.
Approach: T1, T2, and T2* measurements were obtained using the rapid imaging sequence in 17 children (age 3-10 years). The parametric values were compared to those acquired using conventional mapping sequences, and repeatability and reproducibility were assessed.
Results: The brain relaxation parametric values obtained with the rapid sequence were comparable to those obtained through conventional acquisitions. Furthermore, these values exhibited good repeatability and reproducibility.
Impact: Rapid (1 minute and 15 seconds) measurements of T1, T2, and T2* in the brains of awake children (aged 3-10 years) were comparable to those obtained using conventional quantitative mapping methods.
INTRODUCTION
Scanning awake pediatric subjects is challenging due to long acquisition times, resulting in motion artifacts and low-quality non-diagnostic MR images1,2. Sedation increases costs and risks to the patient3-4 but can be avoided by using rapid acquisition methods5-7. Recently, an EPI-based Multi-Inversion Spin and Gradient Echo sequence (MI-SAGE) was used to acquire multiple image contrasts in adult brains in a single acquisition8 and estimate quantitative T1, T2, and T2* relaxometry maps8,9. Quantitative MRI is useful to study the behavior of underlying tissue and has demonstrated application in epilepsy, multiple sclerosis, gliomas, dementia, and other neurodevelopment disorders10, while also allowing for the generation of synthetic image contrasts. In our study, the MI-SAGE technique was employed to perform rapid brain scans of awake children to obtain estimates of quantitative parametric maps and generate synthetic weighted images11-14. The results were then compared to conventional mapping methods and clinical contrasts and assessed for repeatability and reproducibility.METHODS
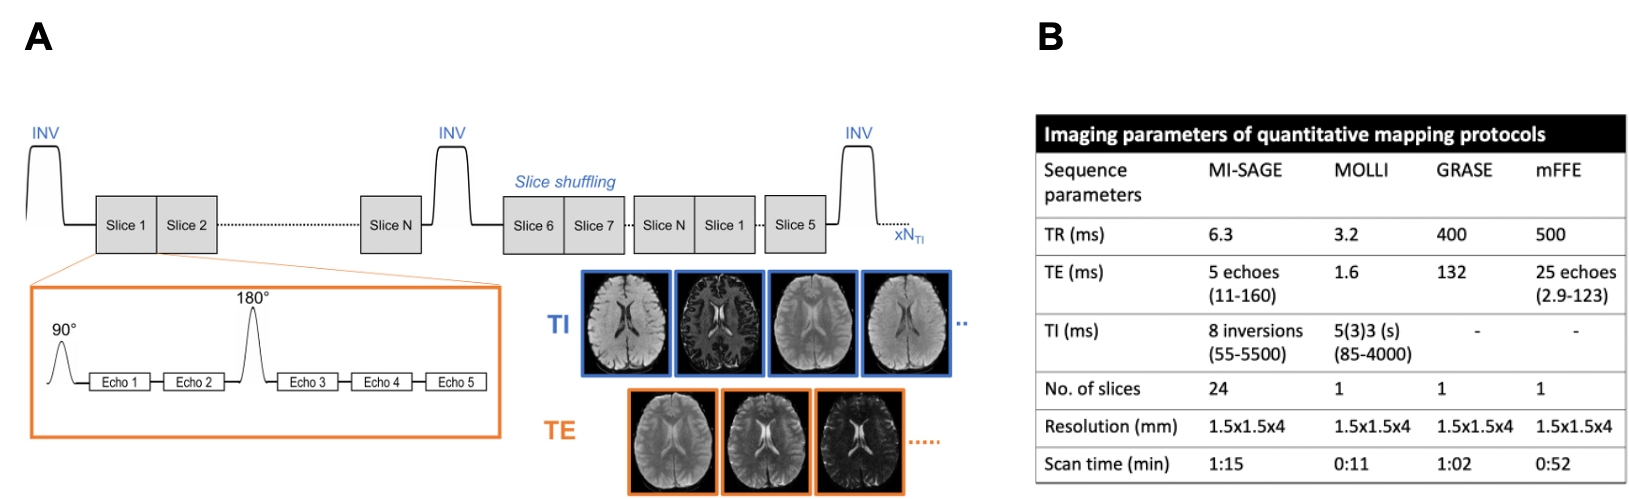
In this IRB-approved study, brains of 17 asymptomatic pediatric participants were scanned on a 3T scanner (Elition, Philips Healthcare) using a 32-element coil. During a single MI-SAGE acquisition (Figure 1A9), a total of 8 repetitions were performed with shuffled interleaved slice ordering resulting in a total scan time of 1 min 15 seconds. Repeatability and reproducibility of the MI-SAGE technique were assessed by repeating the acquisition once, and then repositioning the participant before performing the acquisition again. All the acquired image contrasts were fit together on a voxel-by-voxel basis using Bloch simulations and dictionary matching to estimate the T1, T2, and T2* maps8,9. Additionally, T1, T2, and T2* maps were obtained at one matching mid-brain slice with the same FOV and resolution using clinically available sequences (MOLLI, GRASE, and mFFE). The imaging parameters for all quantitative sequences are shown in Figure 1B. Standard contrasts including T1-, T2-, and T2*-weighted images were acquired for comparison to synthetic images at similar resolution in a combined scan time of 5 minutes and 13 seconds. Matching regions of interest (ROI) were manually drawn in the white matter (WM) and gray matter (GM) tissues to measure mean parametric values for each mapping method. The concordance correlation coefficient (CCC) and Bland Altman analysis were used to assess consistency and agreement.RESULTS
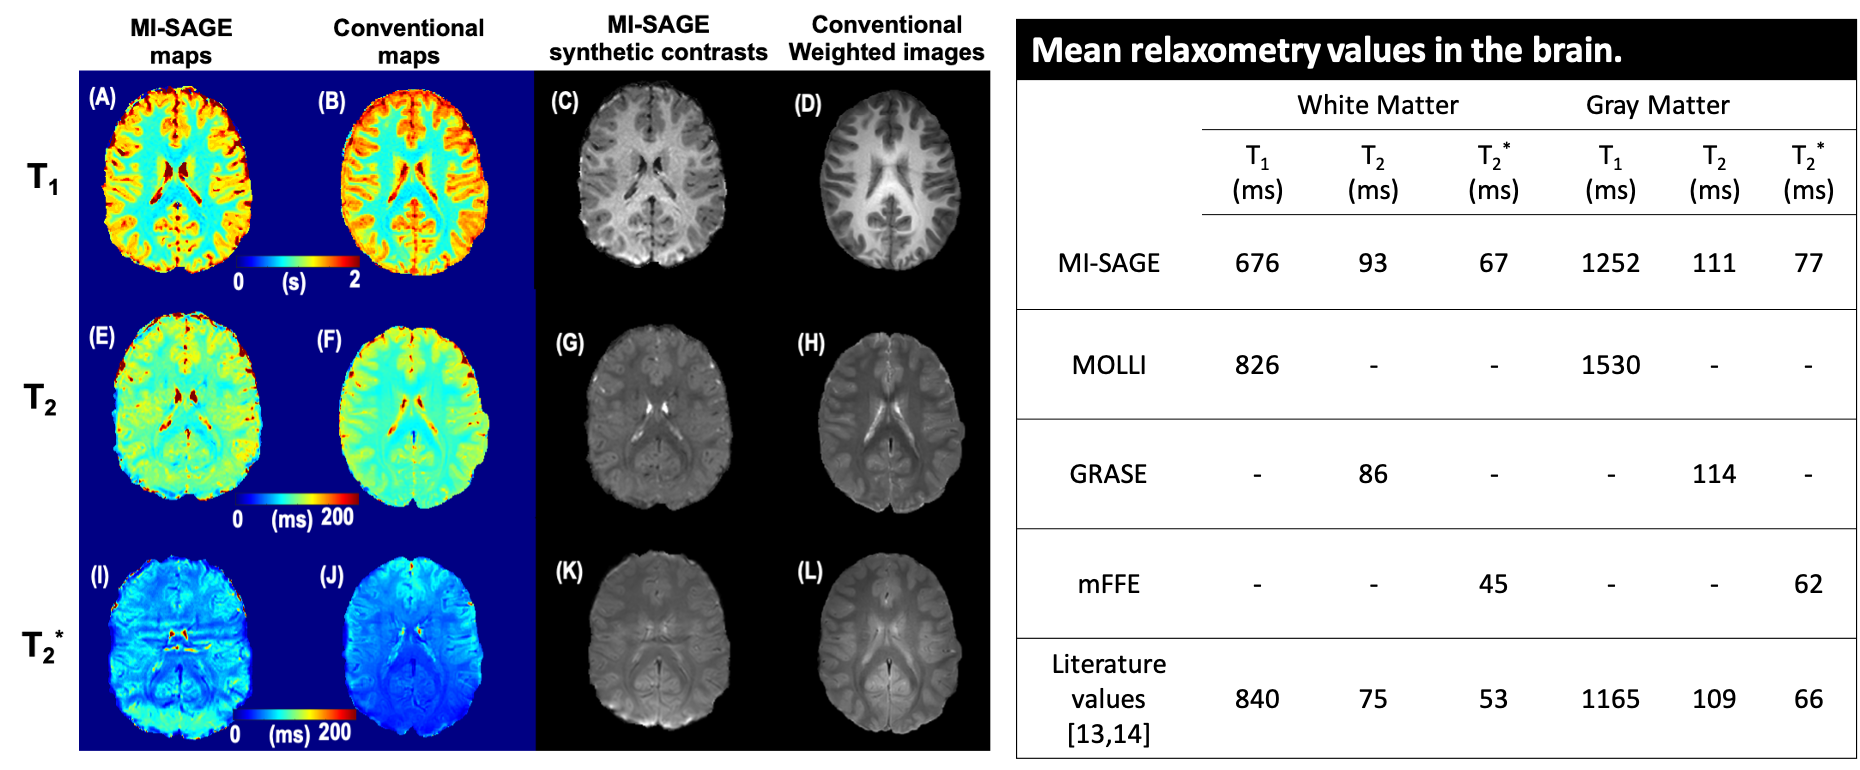
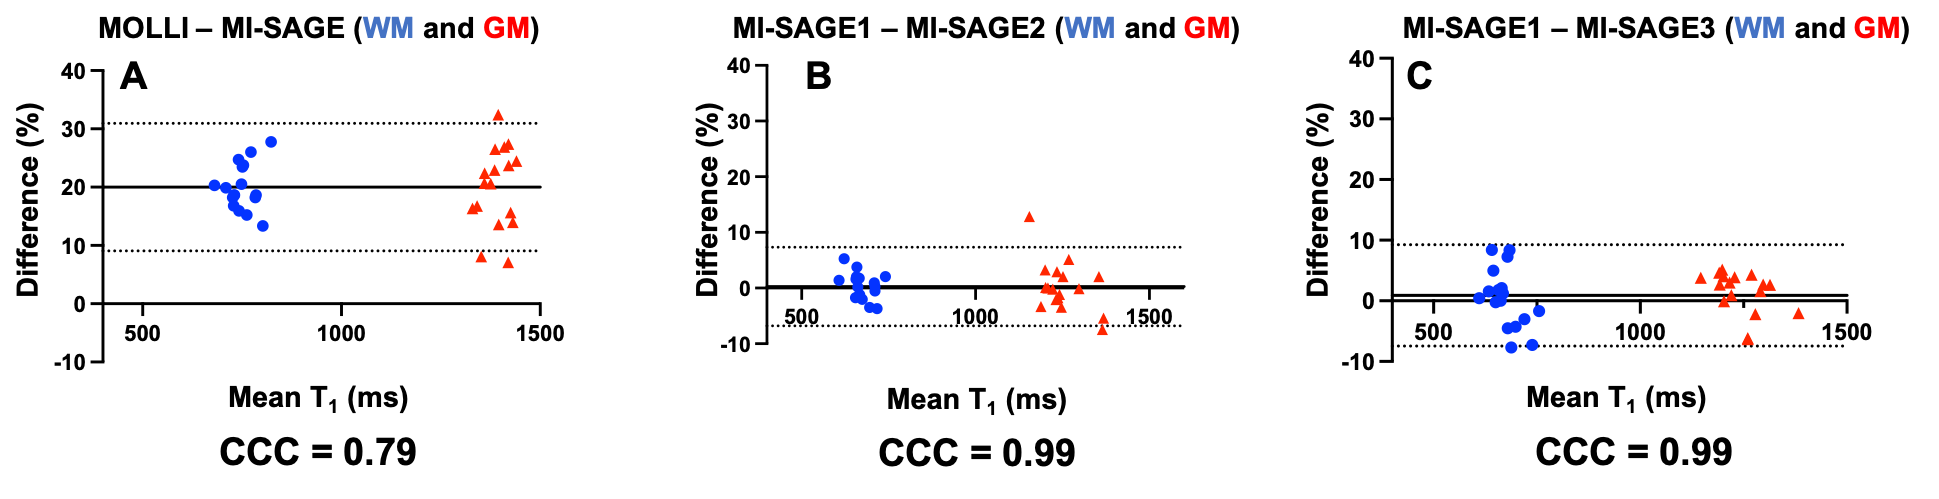
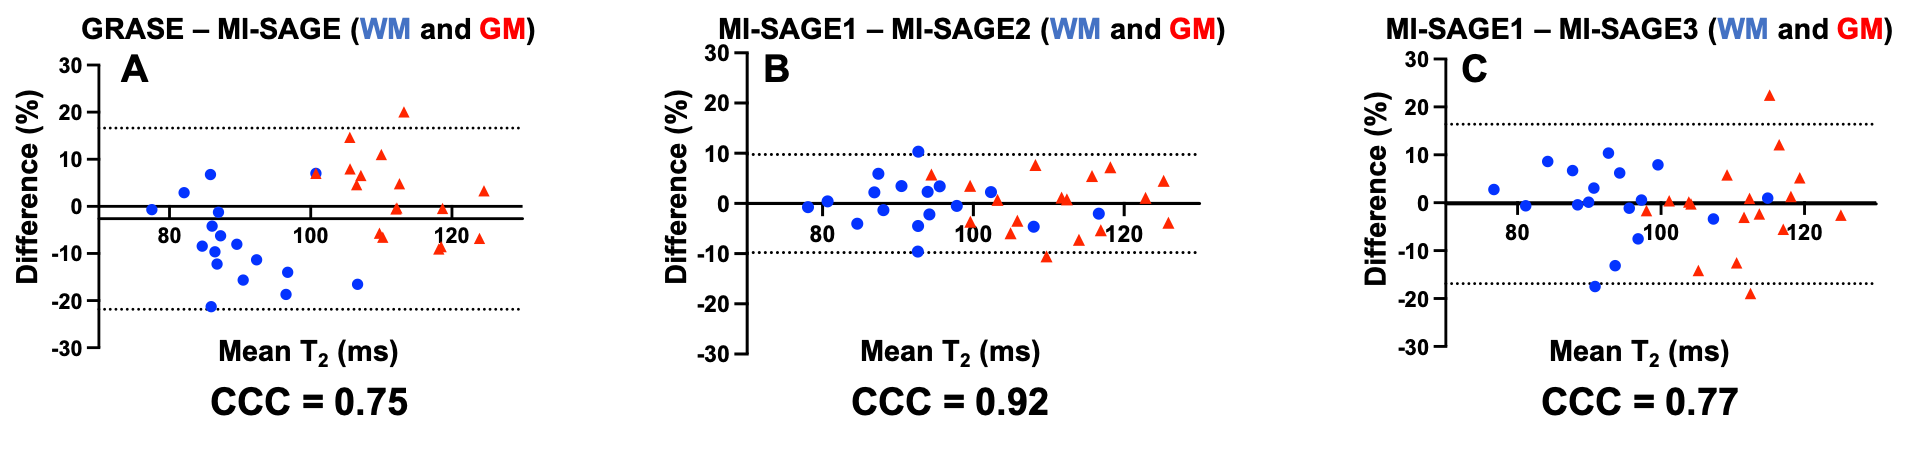
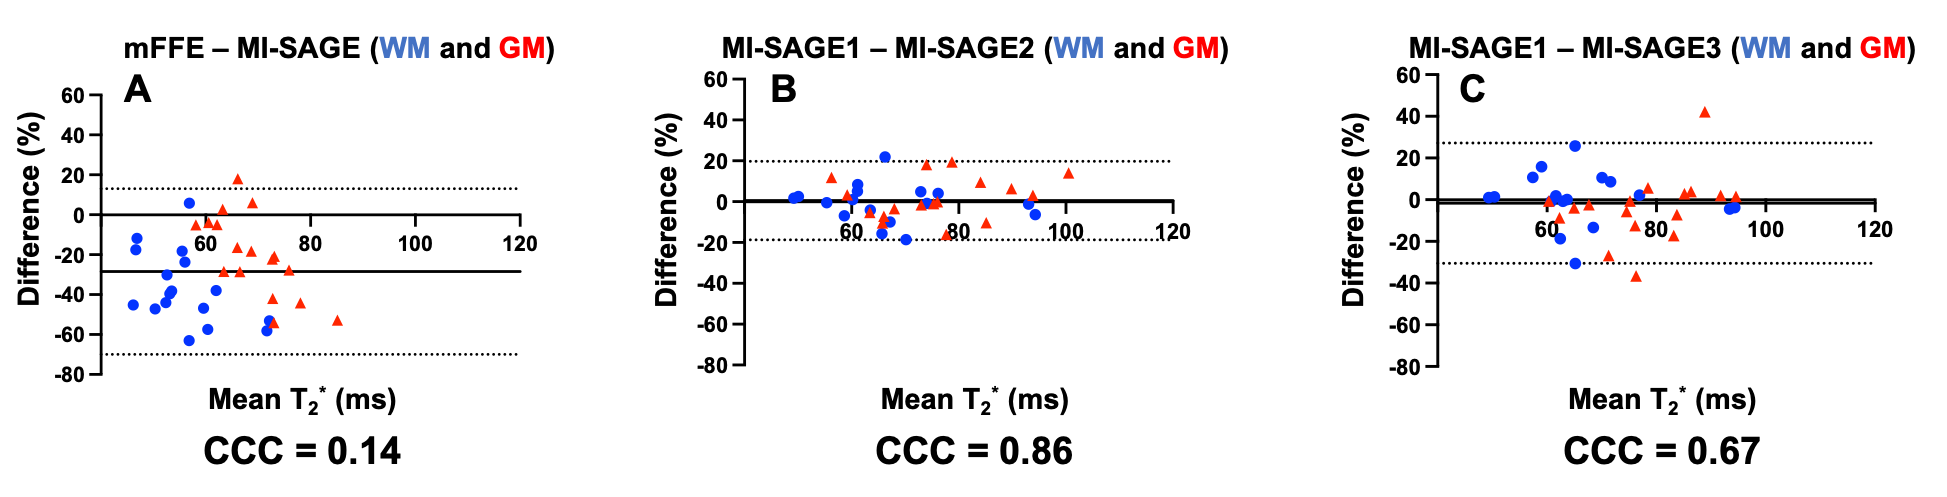
Study participants ranged from 3-10 years (mean age: 6.5 years; 10 males). Figure 2 shows a representative mid-brain slice of an 8-year-old participant with T1, T2, and T2* maps obtained using MI-SAGE and commercially available methods (MOLLI, GRASE, and mFFE). Synthetic T1, T2, and T2* weighted images from the same mid-brain slice are also shown, along with standard T1-, T2-, and T2*-weighted images with identical MR sequence parameters. The mean T1 and T2 values from MI-SAGE across subjects were comparable to the values of conventional methods and values reported in the literature (Figure 2), though WM T1 values are underestimated with MI-SAGE compared to MOLLI. The T2* maps have susceptibility artifacts that may influence estimated T2* values. Figures 3, 4, and 5 show Bland-Altman plots comparing T1, T2, and T2* MI-SAGE to the corresponding conventional methods, repeatability, and reproducibility of MI-SAGE, respectively. When compared to conventional methods, MI-SAGE derived T1, T2, and T2* values had biases of 19.99, -2.62, and -28.48 %, respectively. MI-SAGE demonstrated excellent (CCC 0.86-0.99) repeatability and moderate to excellent (CCC 0.67-0.99) reproducibility. The synthetic weighted images showed visually similar gray and white matter contrast as the standard images (Figure 2).DISCUSSION
The rapid MI-SAGE acquisition, completed in just 1 minute and 15 seconds, successfully estimated T1, T2, and T2* measurements in the brains of awake 3–10-year-old children. These measurements were comparable to those achieved through conventional quantitative mapping methods. The relaxometry values from the MI-SAGE technique showed excellent repeatability and reproducibility. Importantly, the MI-SAGE technique maintained identical spatial resolution and provided 24x greater coverage in half the scan time than the conventional mapping techniques combined using only single-slice acquisitions. Additionally, the MI-SAGE acquisition generated visually similar synthetic contrast images, which were achieved from a 5-fold faster scan time than the corresponding conventional sequences. The differences in estimated T1 values between MI-SAGE and MOLLI may be influenced by the difference in sampled inversion time intervals. The reliability of MI-SAGE based T2* maps suffered from factors such as low SNR, single-shot EPI readout, partial Fourier sampling, and field inhomogeneities. These limitations could potentially be improved by employing a faster data sampling rate and pediatric-specific coils.Acknowledgements
No acknowledgement found.References
1. Barkovich MJ, Li Y, Desikan RS, et al. Challenges in pediatric neuroimaging. Neuroimage. 2019;185:793-801.
2. Copeland A, Silver E, Korja R, et al. Infant and child MRI: a review of scanning procedures. Front. Neurosci. 2021;15:666020.
3. Kozak BM, Jaimes C, Kirsch J, et al. MRI techniques to decrease imaging times in children. Radiographics. 2020; 40(2):485-502.
4. Gallo-Bernal S, Bedoya MA, Gee MS, et al. Pediatric magnetic resonance imaging: faster is better. Pediatr Radiol. 2023; 53(7):1270-84.
5. Conklin J, Tabari A, Longo MG, et al. Evaluation of highly accelerated wave controlled aliasing in parallel imaging (Wave-CAIPI) susceptibility-weighted imaging in the non-sedated pediatric setting: a pilot study. Pediatr Radiol. 2022; 52(6):1115-24.
6. Dong SZ, Zhu M, Bulas D. Techniques for minimizing sedation in pediatric MRI. J Magn Reson Imaging. 2019; 50(4):1047-54.
7. Kim HG, Oh SW, Han D, et al. Accelerated 3D T2-weighted images using compressed sensing for pediatric brain imaging. Neuroradiology. 2022; 64(12):2399-407.
8. Manhard MK, Liao C, Stockmann J, et al. Combined T1, T2, and T2 * mapping using a multi-inversion multi-echo spin and gradient echo EPI sequence. Proc 27th Annu Meet ISMRM, Montr Canada. 2019. Abstract 1189.
9. Manhard MK, Stockmann J, Liao C, et al. A multi‐inversion multi‐echo spin and gradient echo echo planar imaging sequence with low image distortion for rapid quantitative parameter mapping and synthetic image contrasts. Magn Reson Med. 2021; 86(2):866-80.
10. Cashmore MT, McCann AJ, Wastling SJ, et al. Clinical quantitative MRI and the need for metrology. Brit J Radiol. 2021; 94(1120):20201215.
11. Skare S, Sprenger T, Norbeck O, et al. A 1-minute full brain MR exam using a multicontrast EPI sequence. Magn Reson Med. 2018; 79:3045-3054.
12. Jara H, Sakai O, Farrher E, et al. Primary multiparametric quantitative brain MRI: state-of-the-art relaxometric and proton density mapping techniques. Radiology. 2022; 305(1):5-18.
13. Zhang H, Lai C, Liu R, et al. Age-specific optimization of T1-weighted brain MRI throughout infancy. Neuroimage. 2019; 199:387-95.
14. Stanisz GJ, Odrobina EE, Pun J, et al. T1, T2 relaxation and magnetization transfer in tissue at 3T. Magnet Reson Med. 2005; 54(3): 507-12.
Figures