2533
Combining orientation changes and fractional anisotropy of white matter fibers to diagnose autism spectrum disorder based on machine learning1Department of Radiology, Affiliated Children's Hospital of Jiangnan University, wuxi, China, 2Beijing Advanced Innovation Center for Biomedical Engineering, School of Biological Science and Medical Engineering, Beihang University, Beijing, China, 3Suzhou Institute of Biomedical Engineering and Technology, Chinese Academy of Science, Suzhou, China, 4The School of Computer Science and Engineering, Beihang University, Beijing, China
Synopsis
Keywords: Neuro, White Matter, autism spectrum disorder
Motivation: Autism spectrum disorder (ASD) lacks sensitive and effective imaging biomarkers.
Goal(s): Using diffusion tensor imaging to detect white matter tracts damage and changes in local directional fields in children with ASD and combining machine learning to construct a diagnostic model for preschool-aged children with ASD.
Approach: Introducing the novel mathematical framework of director field analysis, we investigate the local geometric structure of white matter tracts using tract-based spatial statistics and automated fiber quantification techniques.
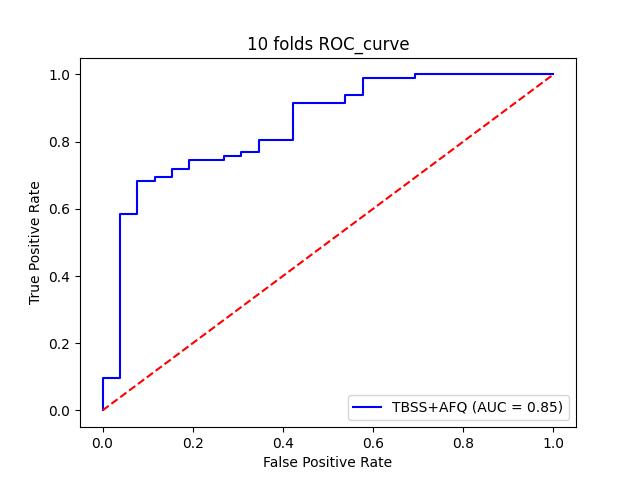
Results: Children with ASD have reduced fractional anisotropy and increased twist and distortion values. The machine learning model showed an area under the curve of 0.85 for diagnosing ASD.
Impact: The director field analysis parameters fill the gap in previous studies and provide a new perspective for exploring the neuropathological mechanisms of ASD. By combining machine learning, the diagnostic efficiency of ASD is improved.
Introduction
Autism spectrum disorder (ASD) is a common neurodevelopmental disorder in children. There is currently a lack of sensitive and effective imaging biomarkers1. Although fractional anisotropy (FA) based on diffusion tensor imaging (DTI) can reveal the integrity of white matter, the local directional characteristics of fiber tracts remain unclear. Director field analysis (DFA) parameters can reflect changes in the directional field of white matter fibers2, and the combination of tract-based spatial statistics (TBSS) and automated fiber quantification (AFQ) techniques can further detect local microstructural abnormalities in ASD individuals. Therefore, this study aims to analyze local geometric structural changes in the white matter of preschool-aged children with ASD and use machine learning to diagnose ASD.Methods
Prospectively collected 82 children with ASD and 27 children with TD, aged 3-6 years. MRI examinations were conducted using a Siemens Magnetom Aera 1.5T MRI system. The protocols sequence included 3D T1WI (thickness: 1 mm; field of view: 192×192 mm), 3D T2WI (thickness: 1 mm; field of view: 192×192 mm), DTI (TR/TE: 5500 ms/95 ms; thickness: 3 mm; b-value: 0,1000 s/mm2 with 30 gradient directions; field of view: 192×192 mm). TBSS was used to align FA images of all subjects to the target image. The mean FA image and its skeleton were created. Each subject’s aligned FA images were projected onto the mean FA skeleton (threshold=0.2). Voxel-wise, cross-subject statistics were performed to assess differences in FA values and DFA parameters between ASD, and control groups. Additionally, automated fiber-tract quantification (AFQ) software was used to identify WM tracts in each participant's brain. The FA values and DFA parameters along the core fiber which are plotted for 100 equidistant locations between two defining ROIs were compared between the groups. This study used the AFQ method to draw the pearson correlation curve between the FA, splay, bend, twist, and distortion of white matter fiber tracts and the autism behavior checklist (ABC) score in children with ASD. The Autogluon machine learning framework was used to assess the diagnostic performance of ASD. All group comparisons were analyzed using age as a covariate. P<0.05 was considered as statistically significant difference.Results
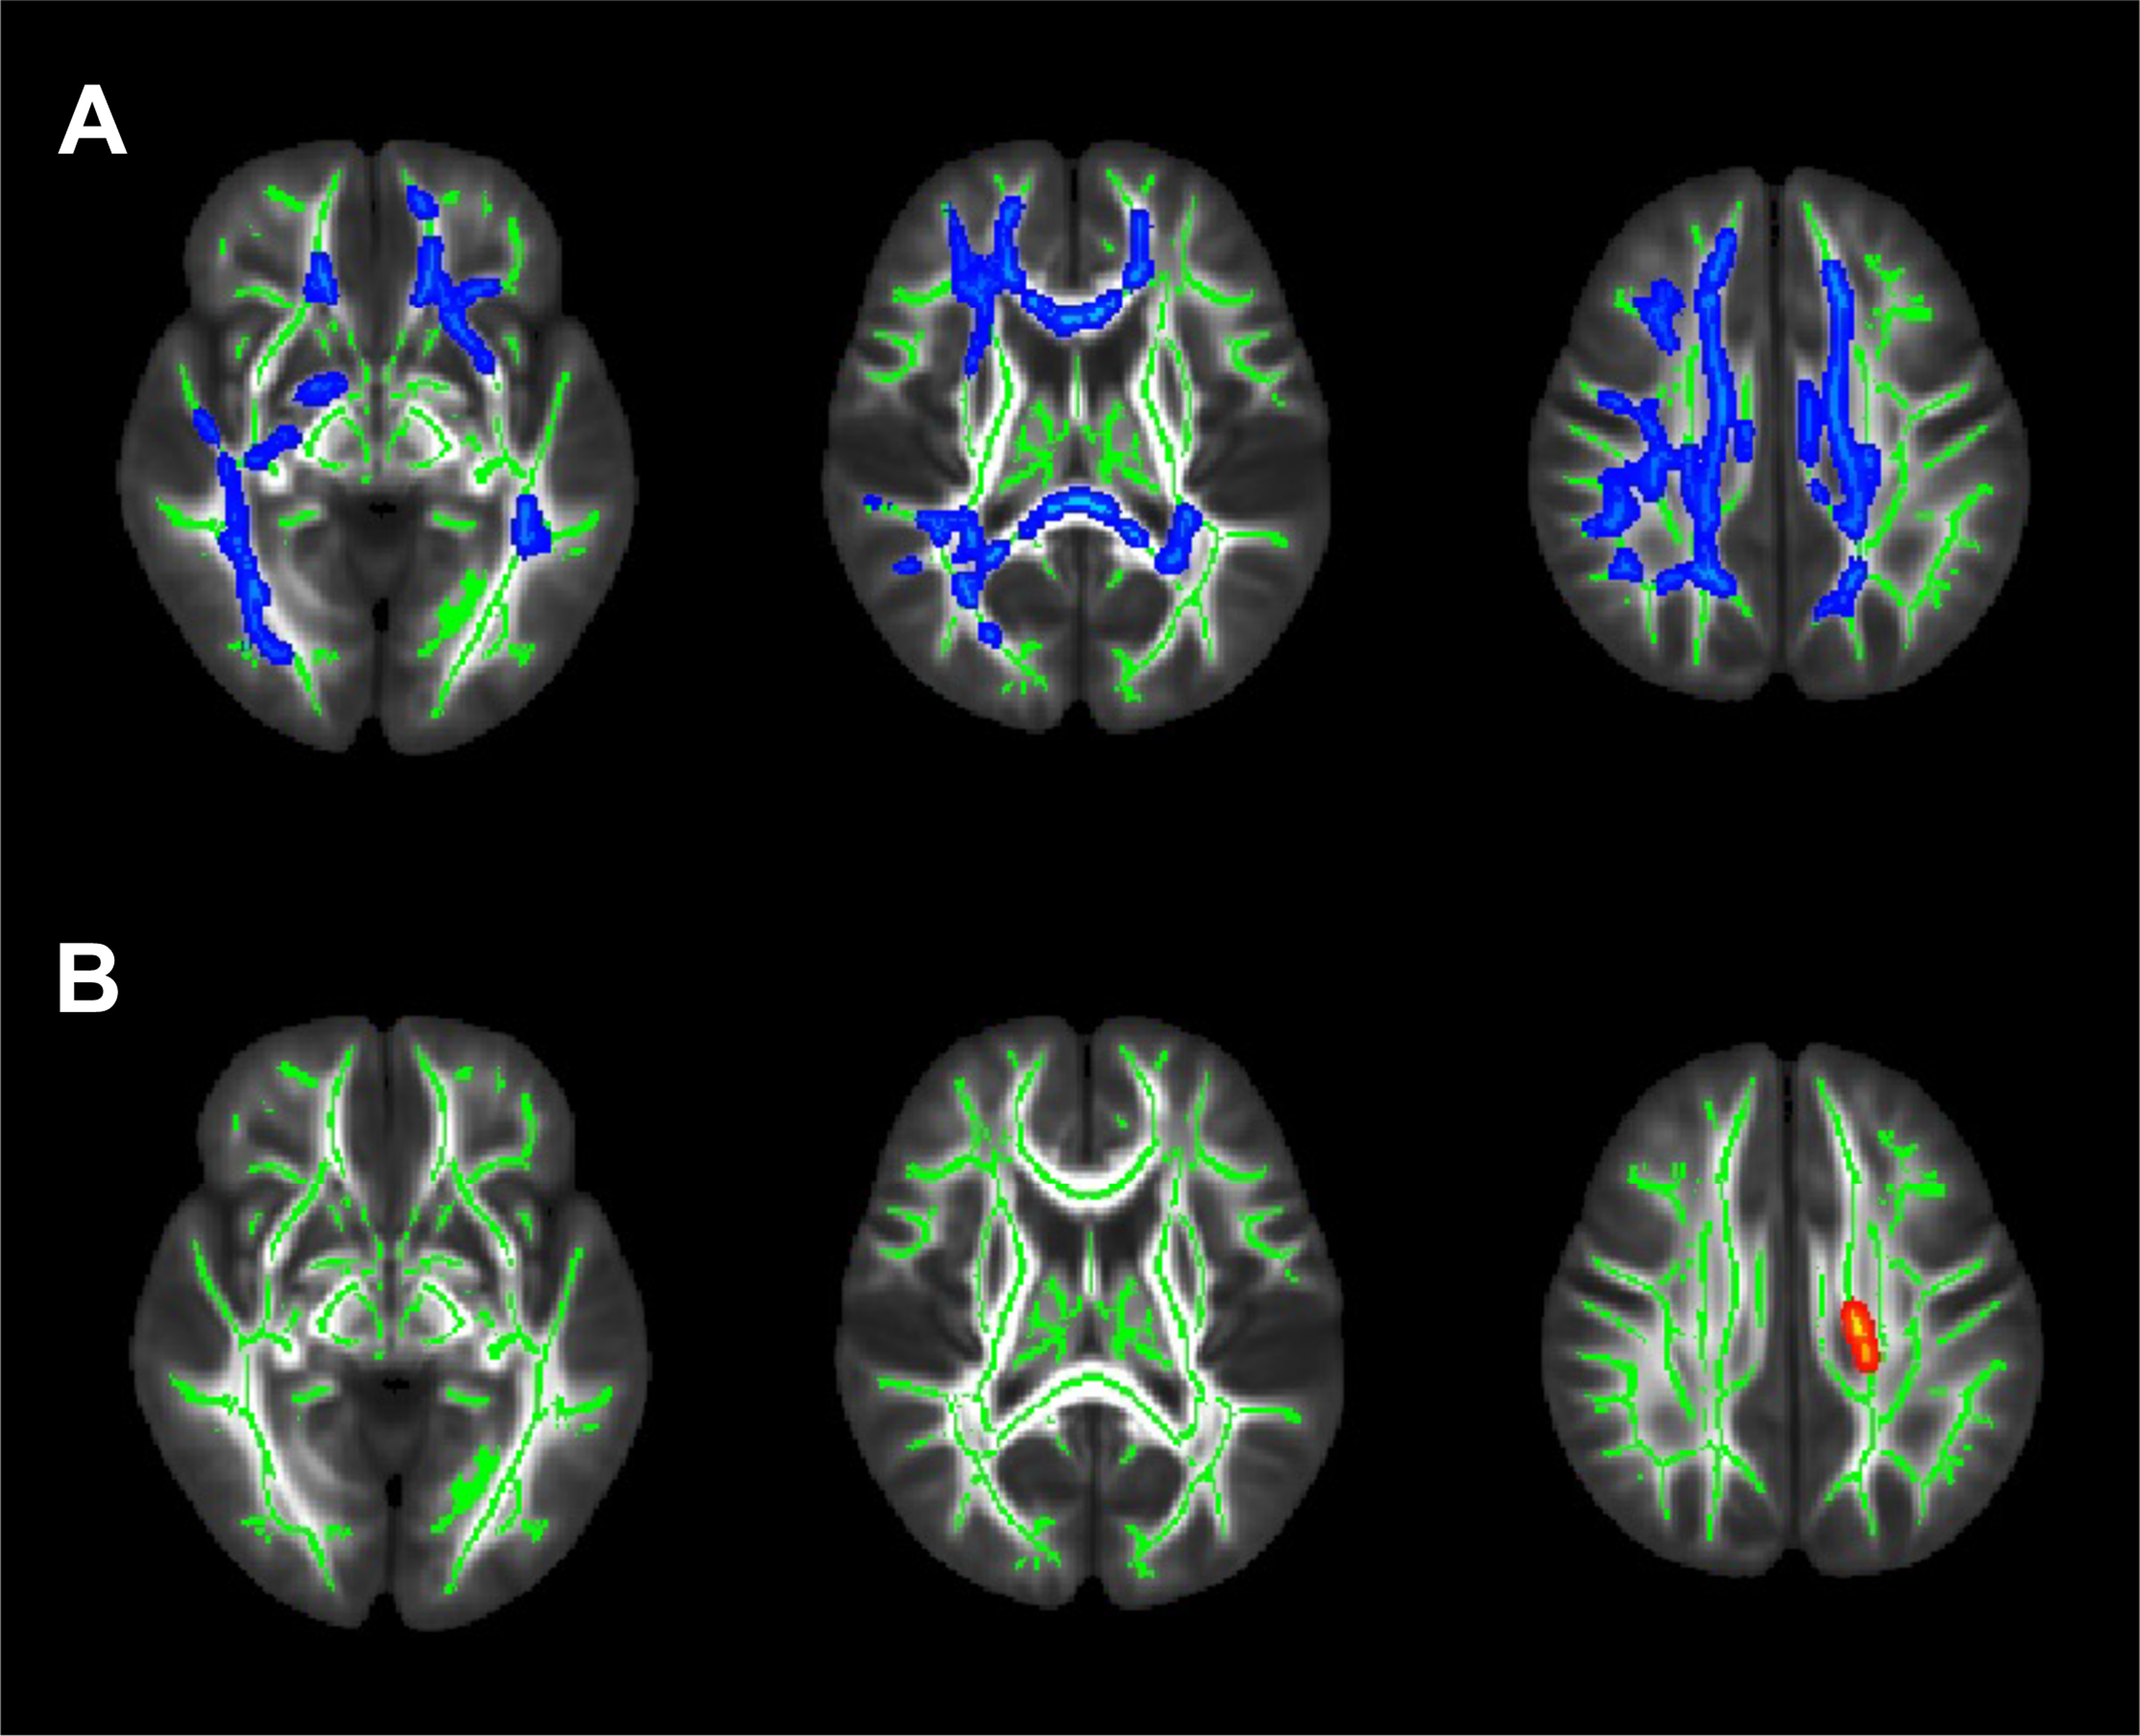
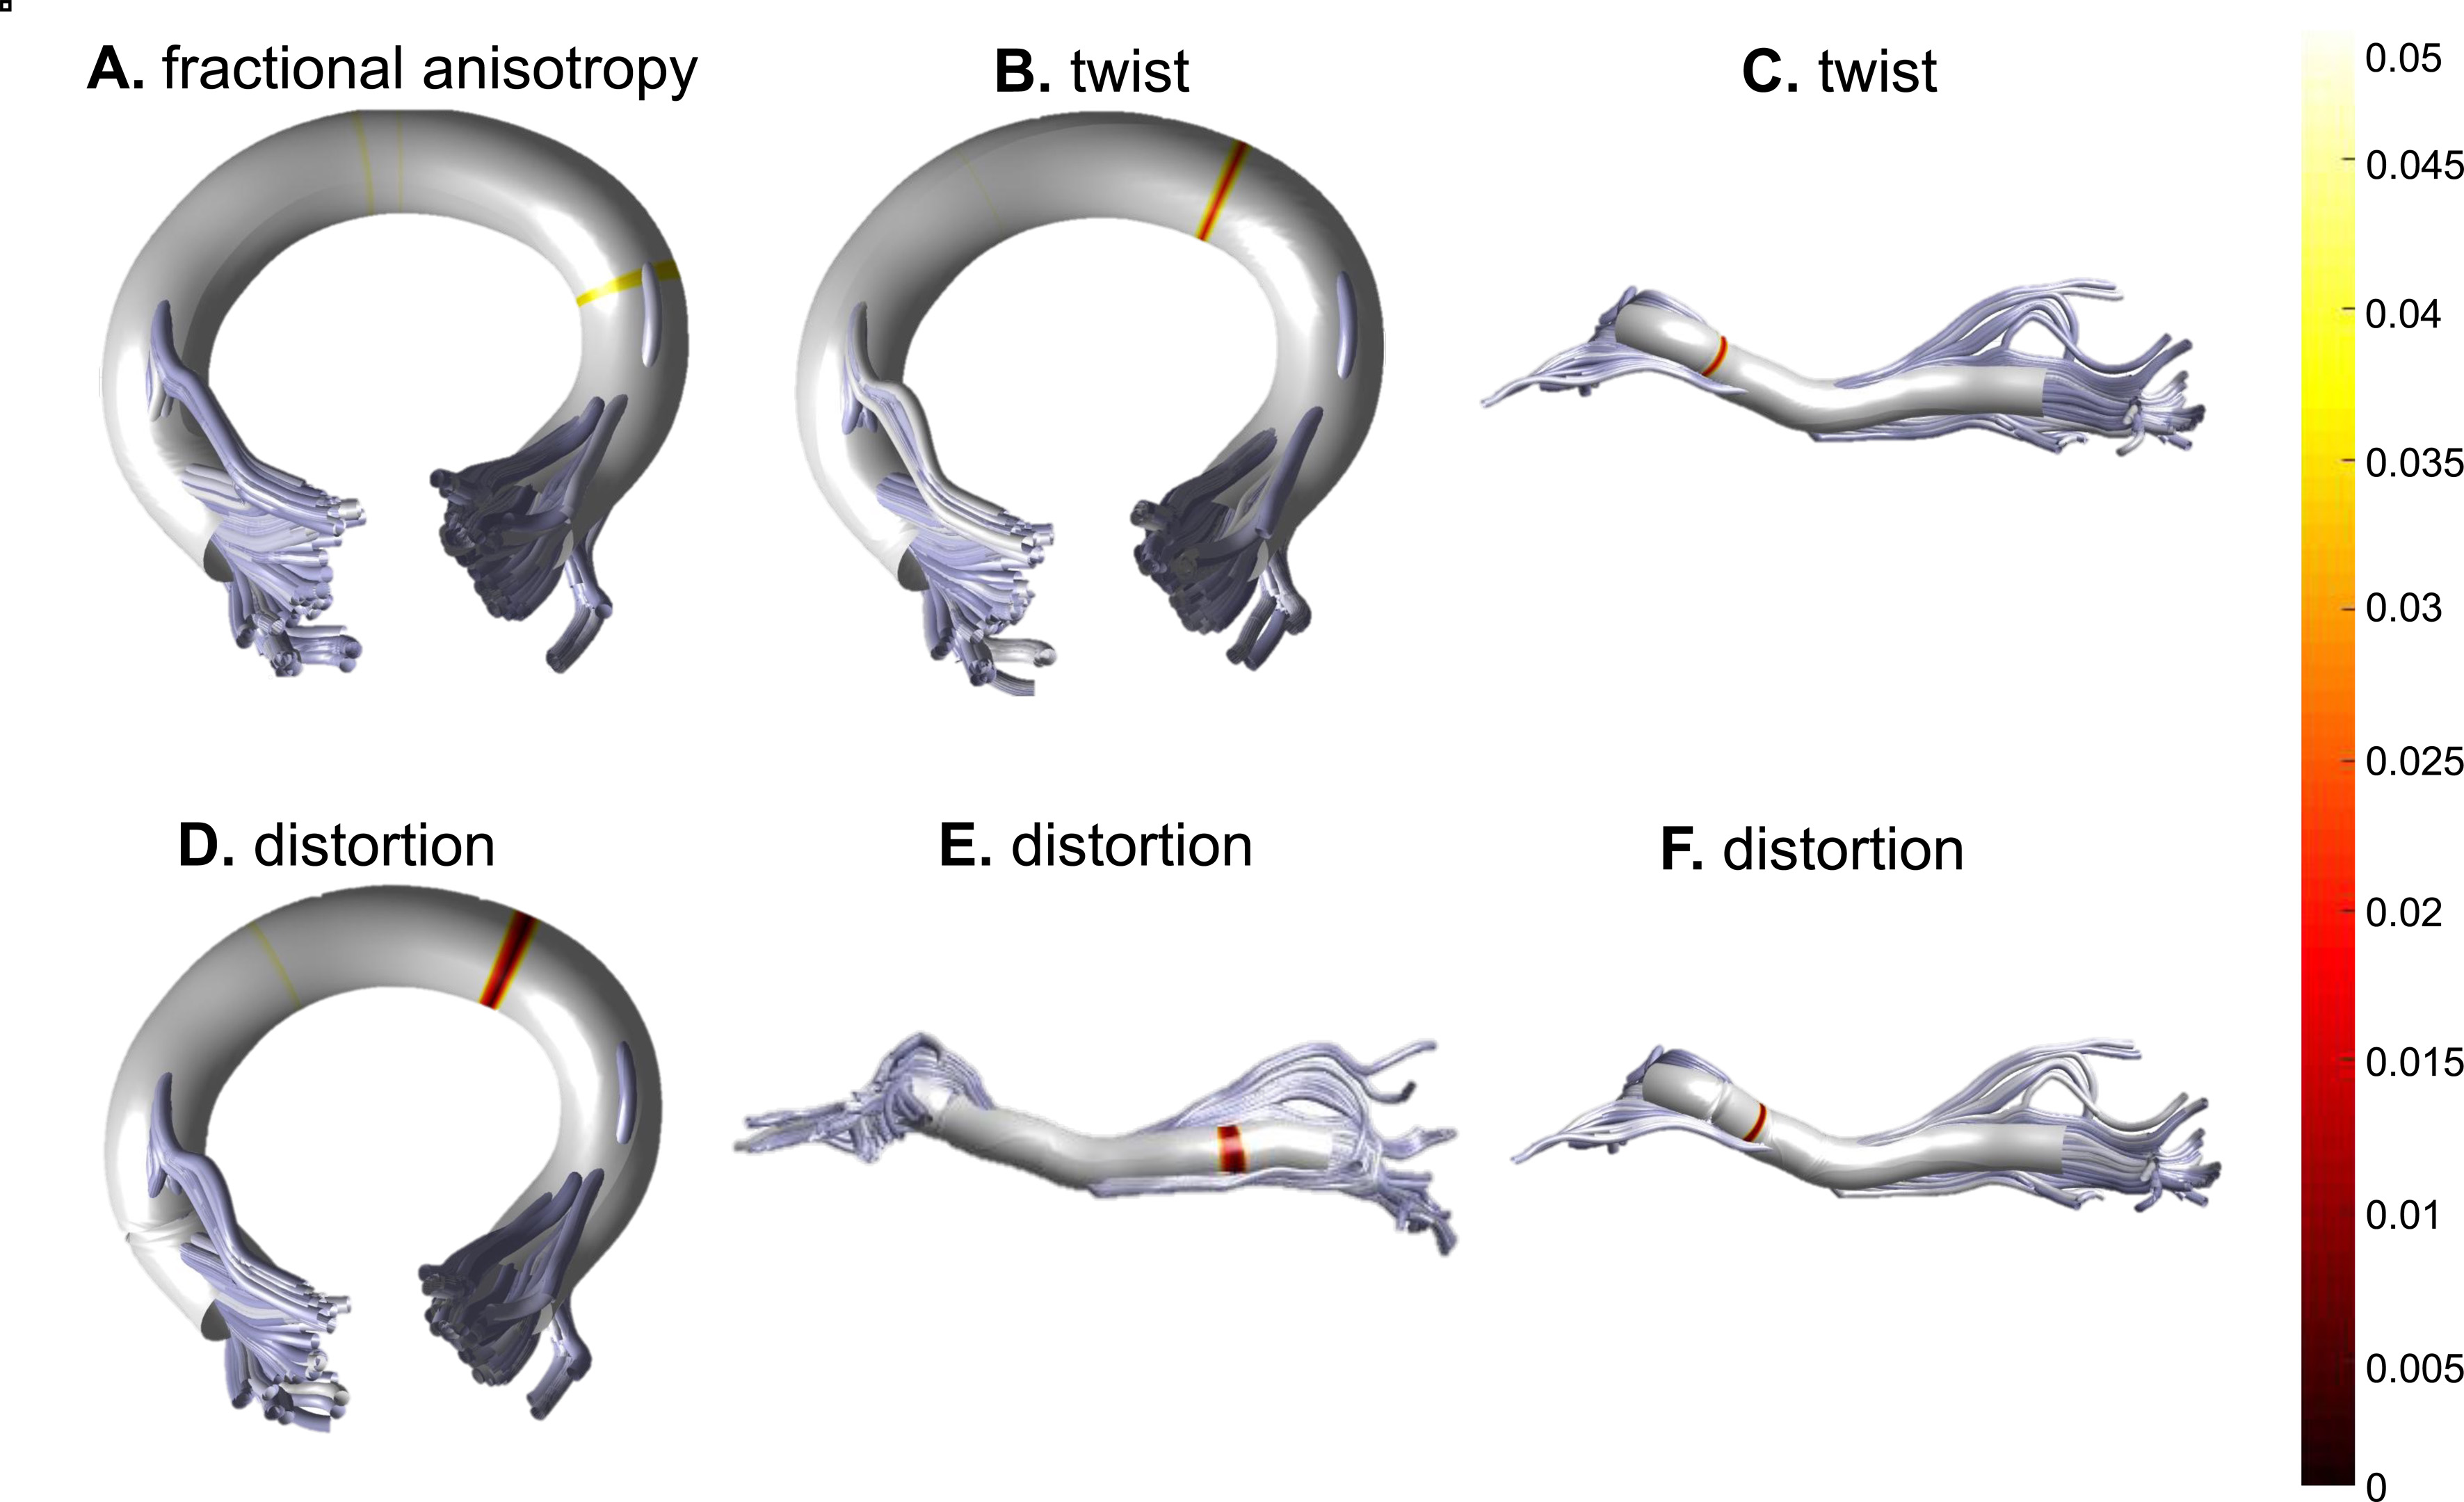
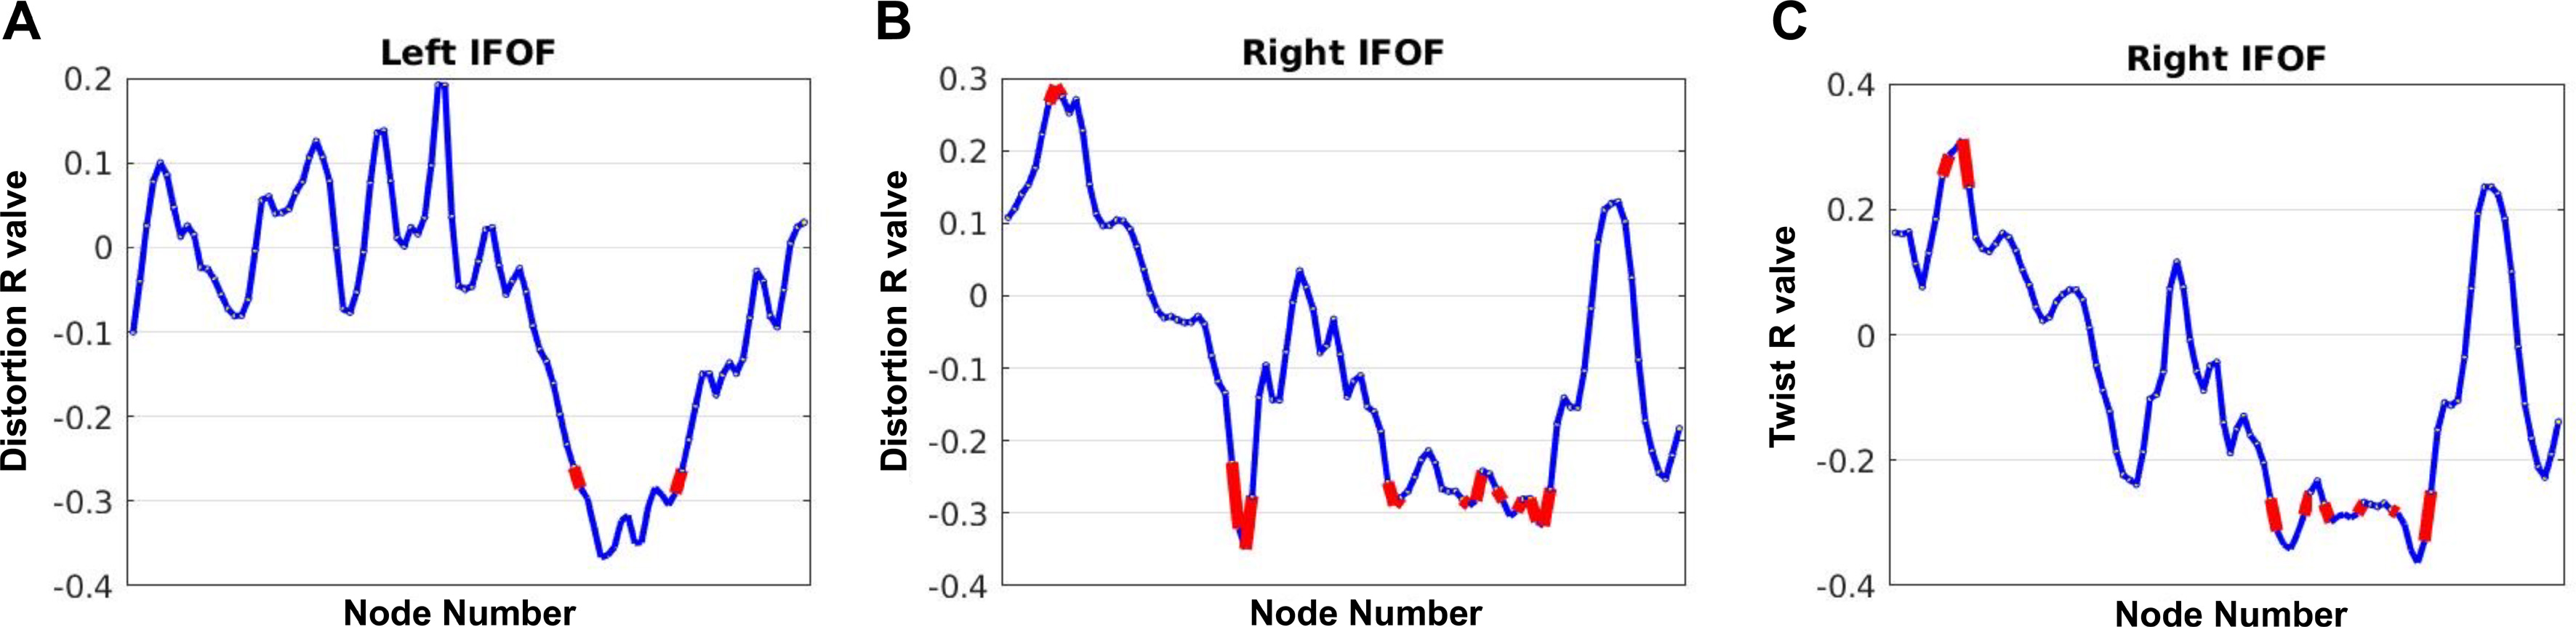
Compared with the control group, the TBSS results of the ASD group had significant decreases in FA values mainly located in the major and minor callosum forceps, right posterior thalamic radiation, bilateral inferior longitudinal fasciculus (IFOF), right superior longitudinal fasciculus, and bilateral corona radiata. The ASD group had significant increases in twist values mainly located in the left corona radiata (TFCE corrected p < 0.05) (Fig.1). Compared to the control group, the AFQ results of the ASD group showed decreased FA values in the central part of the callosum forceps major and increased FA values in the right part of the callosum forceps major. In addition, increased distortion values were observed in the central part of the callosum forceps major and right anterior IFOF, while decreased distortion values were observed in the left posterior IFOF. Finally, increased twist values were observed in the central part of the callosum forceps major and right anterior IFOF (p < 0.05) (Fig.2). The pearson correlation curve based on AFQ shows that the distortion values within the bilateral IFOF are negatively correlated with the ABC score. The twist value within the right IFOF is also negatively correlated with the ABC score (Fig.3). The machine learning model based on TBSS and AFQ results showed an area under the curve of 0.85 for diagnosing ASD, with an accuracy of 0.82 (Fig.4).Discussion
The reduced FA values reflected the impaired integrity in the white matter fibers of ASD. The increased twist and distortion values further suggested the abnormality of neural fiber direction and structure in ASD. Previous studies have suggested the presence of a disturbance in the glymphatic system circulation in ASD3. The increased twist value in the corona radiata area may be related to the widening of perivascular space in this area of ASD. The increased twist and distortion values in the callosum forceps major may be due to the morphological changes in the white matter caused by the expansion of the lateral ventricles. The correlation between twist and distortion values and the ABC score reflects the neural geometric microstructure changes associated with core symptoms of ASD. Furthermore, the machine learning models based on TBSS and AFQ results can effectively diagnose ASD.Conclusion
The lower FA and higher DFA parameters in white matter fiber tracts may be sensitive imaging biomarkers for diagnosing ASD, providing a new perspective for exploring the neuropathological mechanisms of ASD and precision diagnosis.Acknowledgements
This study has received funding from the Wuxi Science and Technology Development Project (CN) (Grant No. N20192005).References
1. Wang M, Xu D, Zhang L, et al.Application of Multimodal MRI in the Early Diagnosis of Autism Spectrum Disorders: A Review.Diagnostics (Basel),2023,13(19):
2. Cheng J, Basser P J.Director Field Analysis (DFA): Exploring Local White Matter Geometric Structure in Diffusion MRI.Med Image Anal,2018,43(112-128).
3. Li X, Ruan C, Zibrila A I, et al.Children with autism spectrum disorder present glymphatic system dysfunction evidenced by diffusion tensor imaging along the perivascular space. Medicine (Baltimore),2022,101(48):e32061.
Figures