2527
Novel 3D myelin weighted imaging in the cervical spinal cord using myelin-sensitive inversion recovery (MySIR): a feasibility study1Department of Radiology, Faculty of Medicine, University of Miyazaki, Miyazaki, Japan, 2Division of Radiology, Miyazaki University Hospital, Miyazaki, Japan, 3Philips Japan, Tokyo, Japan
Synopsis
Keywords: Spinal Cord, Spinal Cord
Motivation: Myelin water fraction (MWF) is a promising method for quantitative evaluation of myelin function in the brain. On the other hand, myelin-sensitive inversion recovery (MySIR) sequence is thought to show spinal myelin structure.
Goal(s): To evaluate the feasibility of MySIR imaging for myelin visualization in the cervical spinal cord. .
Approach: MySIR images were compared with MWF as the gold standard.
Results: We have demonstrated that MySIR showed similar results to MWF in evaluating the distribution of myelin in the spine. MySIR may be useful for evaluating the distribution of myelin.
Impact: MySIR gave us a novel contrast between grey matter and white matter. Additionally, MySIR showed similar results to MWF in evaluating myelin. We demonstrated the feasibility of MySIR for evaluating the distribution of myelin in cervical spine.
INTRODUCTION
Myelin water fraction (MWF), the fraction of signal contribution from myelin water, is a promising method for quantitative evaluation of myelin function in the brain. MFW has been histopathologically validated as a biomarker for myelin and has demonstrated significant variation in myelination between different brain structures1,2.Assessment of myelin content in the spinal cord is also clinically desirable. However, myelin-sensitive imaging in the spinal cord is not well investigated yet.
In this study, we developed a new sequence for 3D myelin weighted imaging in the cervical spinal cord, called myelin-sensitive inversion recovery (MySIR). MySIR is based on the phase-sensitive inversion recovery framework3. Several studies have demonstrated the usefulness of either 2D4,5 or 3D6.7 PSIR for improved visualization of spinal cord so far, basically they were using a long TR for maximizing the SNR and contrast, but we applied different approach from these studies. We attempted to combine PSIR with so called short-TR adiabatic inversion-recovery (STAIR)8 sequence, which has been demonstrated for faster myelin weighted imaging with better contrast in the brain and quantification of myelin water.
In this study, we tried to evaluate the feasibility of MySIR imaging for myelin visualization in the cervical spinal cord. The purpose of this study was to evaluate whether MySIR is also useful in evaluating spinal cord white matter similar to MWF as the gold standard.
METHODS
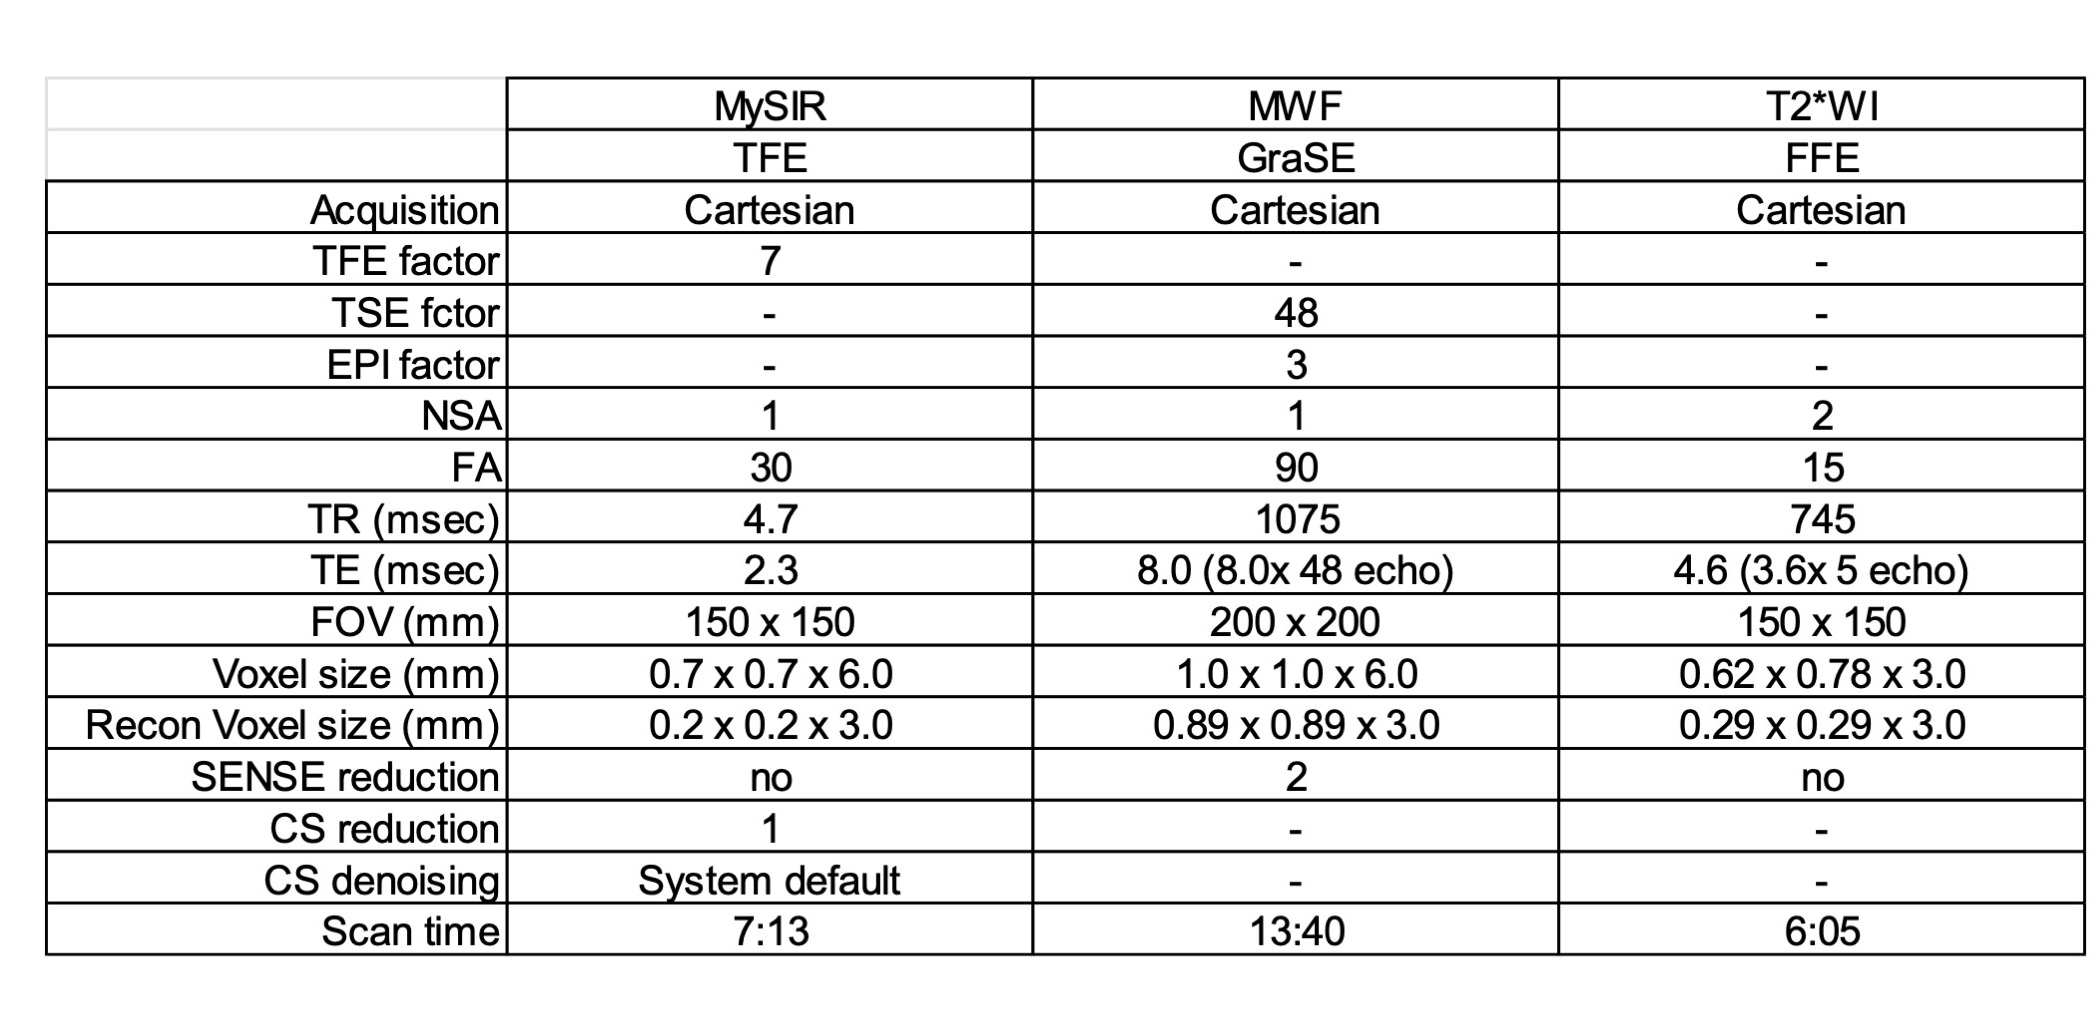
A total of eight healthy volunteers were included in this study. Age and sex demographic information was collected for all subjects ( mean age 32.7 years, range 24 – 50 years, 3 female/5 male). The local IRB approved the study, and written informed consent was obtained from all subjects. All subjects were examined with a 3.0T whole-body clinical system (Ingenia CX, Philips Healthcare) and scanned MySIR and MWF.MySIR is based on the 3D IR-prepared segmented gradient echo (Turbo Field Echo: TFE) with PSIR reconstruction with a short TR (TFE shot interval) and short inversion time (TI). When a short TR is used, the MySIR sequence effectively suppresses signals from long T2 species over a wide range of T1 relaxation times, while preserving the signals from myelin water. For the MWF, 3D multi-echo (48 echoes) gradient and spin-echo (GraSE) sequence9 is used. The Sparsity Promoting Iterative Joint NNLs (non-negative least squares) (SPIJN)10 algorithm is used for generating MWF map. T2* weighted images were also taken for all participants. Parameters of all sequences were shown Table 1.
For qualitative analysis, one radiologist detected the grey matter to show the contrast between white matter and grey matter using a 4-point scale where 3 = extremely clear; 2 = clear, but partially ambiguous; 1 = fair, considered relatively diagnostic; 0 = poor.
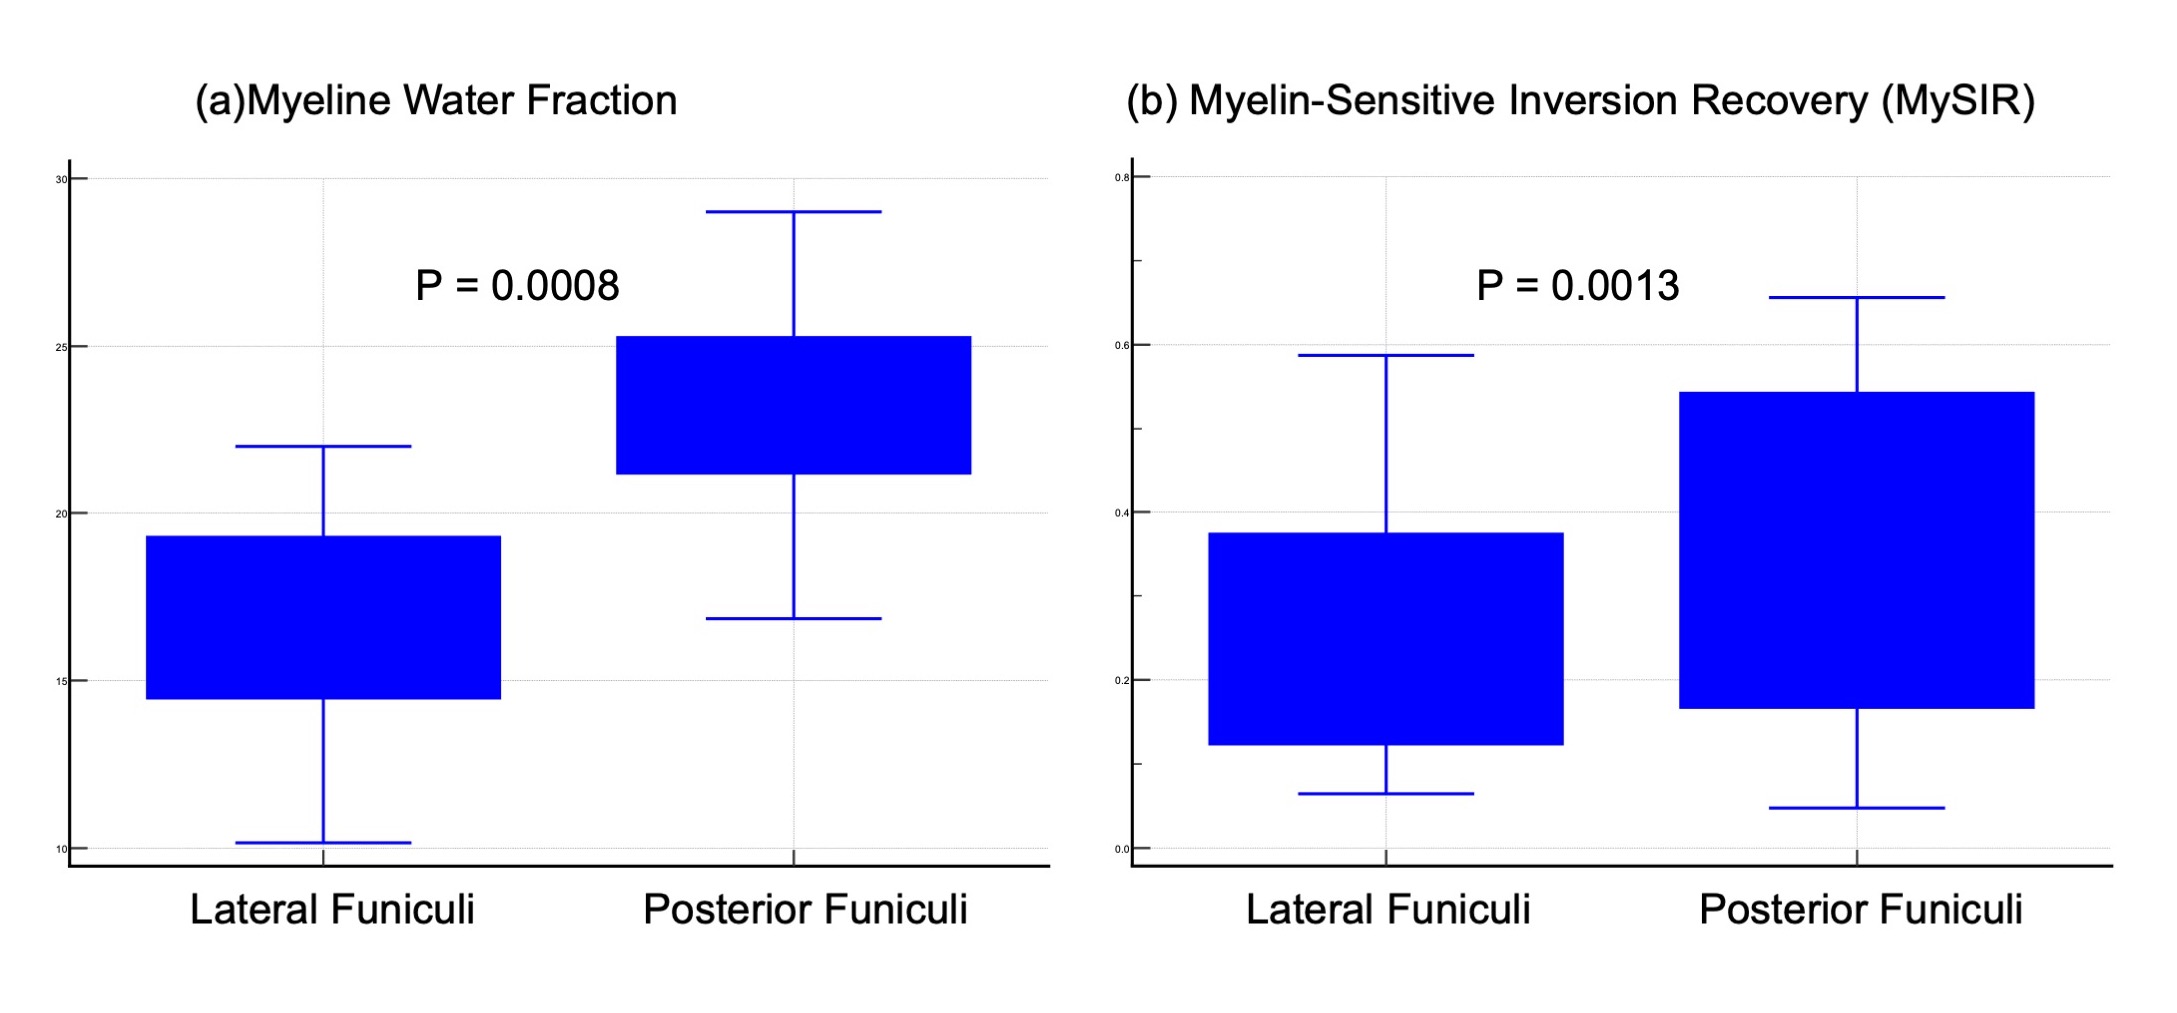
For quantitative analysis, one radiologist manually placed three 5-mm2 regions of interest (ROI) on MWF map and MySIR images of the bilateral lateral/posterior funiculi. The ROIs on MWF map were copied onto the MySIR images. The mean signal intensity values of the MySIR images were divided by the mean signal intensity value of the CSF, and the normalized mean relative signal intensity value of MySIR (n MySIR) was calculated.For statistical analysis, Friedman test was used for the comparison of visualization of gray matter. The comparison of the MWF and n MySIR between lateral/posterior funiculi was conducted by using Wilcoxon test.
RESULTS and DISCUSSION
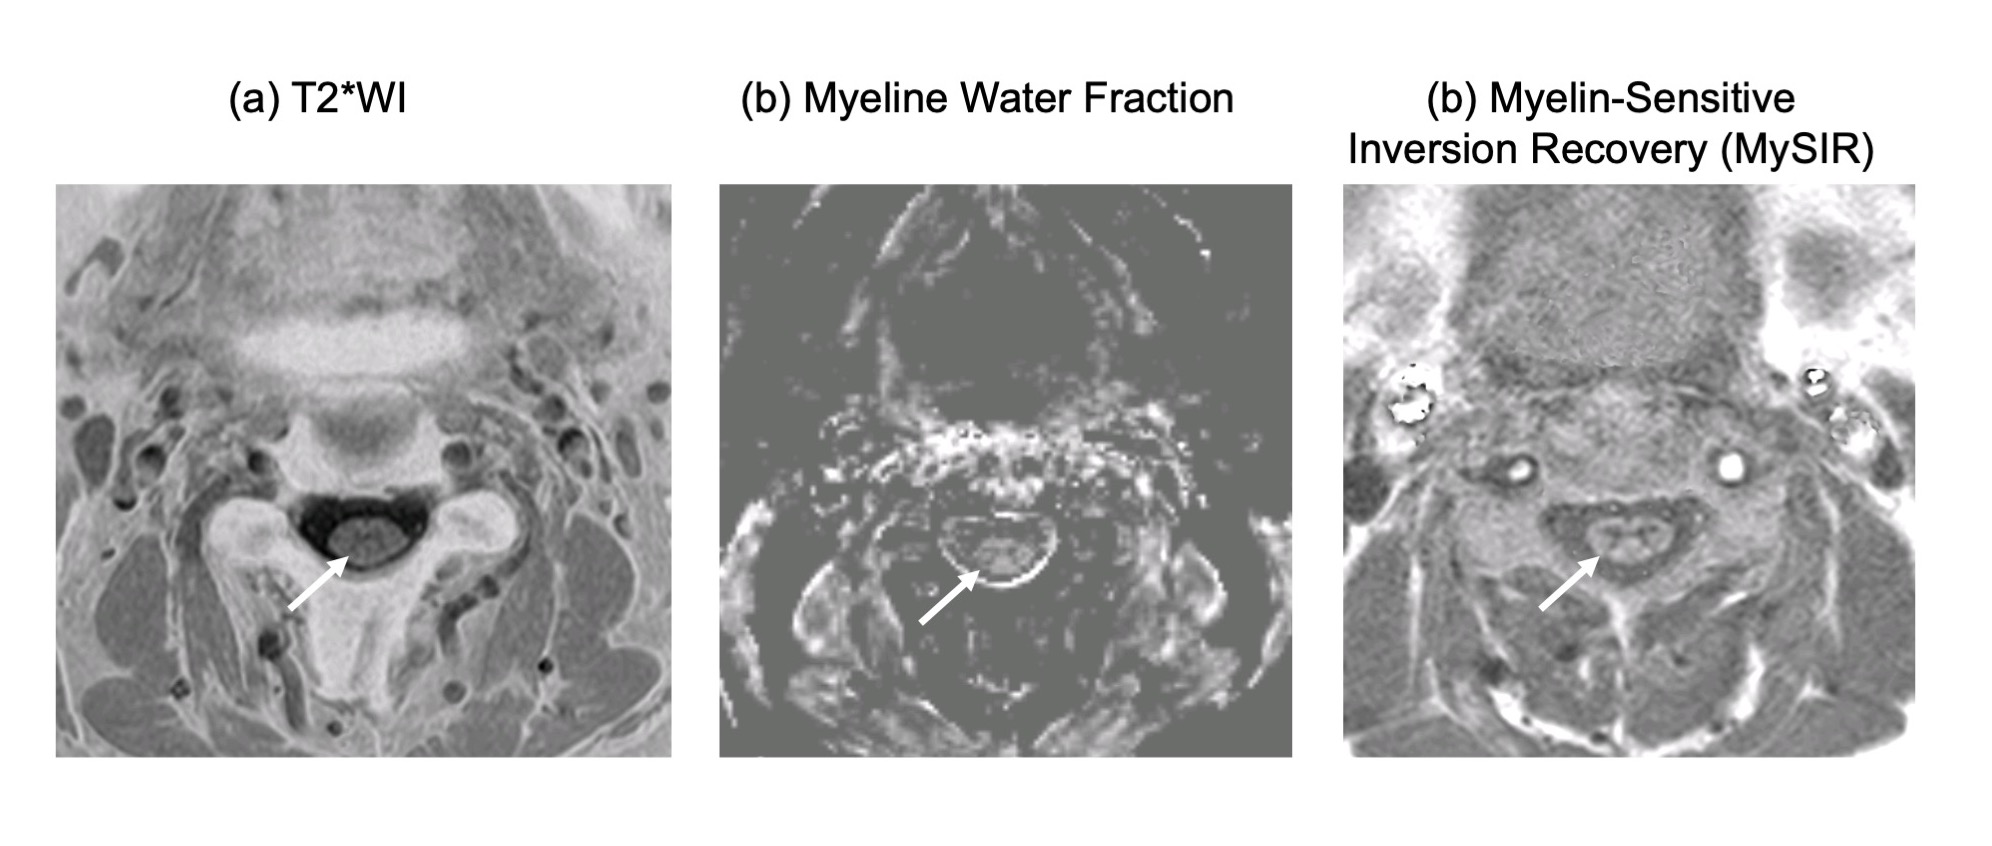
Representative images of T2*WI, MWF, and MySIR were shown in Figure 1. For qualitative analysis, the mean scores of T2*WI, MWF, and MySIR were 1.88, 1.19 and 2.93, respectively. For quantitative analysis, MWF and n MySIR showed similar tendencies associated with the comparison of lateral/posterior funiculi: MWF and n MySIR were significantly higher for the posterior funiculi (Figure 2). Previous studies have reported that the MWF of is higher than lateral funiculi, and our results are consistent with this11. In this study, MySIR showed a novel contrast between grey matter and white matter. Besides, MySIR could evaluate the distribution of myelin similar to MWF, and it may be useful for the clinical situation in the future.CONCLUSION
In our study, MySIR gave us a novel contrast between grey matter and white matter. Additionally, MySIR showed similar results to MWF in evaluating myelin. We demonstrated the feasibility of MySIR for evaluating the distribution of myelin in cervical spine.Acknowledgements
No acknowledgement found.References
1. Sandrone S, et al. Mapping myelin in white matter with T1-weighted/T2-weighted maps: discrepancy with histology and other myelin MRI measures. Brain Struct Funct. 2023 Mar;228(2):525-535. doi: 10.1007/s00429-022-02600-z.
2. Dvorak AV, et al. An atlas for human brain myelin content throughout the adult life span. Sci Rep. 2021 Jan 11;11(1):269. doi: 10.1038/s41598-020-79540-3.
3. Kellman P, et al. Phase-sensitive inversion recovery for detecting myocardial infarction using gadolinium-delayed hyperenhancement. Magn Reson Med. 2002 Feb;47(2):372-83. doi: 10.1002/mrm.10051.
4. Ma YJ, et al. Myelin water imaging using a short-TR adiabatic inversion-recovery (STAIR) sequence. Magn Reson Med. 2022 Sep;88(3):1156-1169. doi: 10.1002/mrm.29287.
5. Papinutto N, et al. 2D phase-sensitive inversion recovery imaging to measure in vivo spinal cord gray and white matter areas in clinically feasible acquisition times. J Magn Reson Imaging. 2015 Sep;42(3):698-708. doi: 10.1002/jmri.24819.
6. Olney NT, et al. Measurement of spinal cord atrophy using phase sensitive inversion recovery (PSIR) imaging in motor neuron disease. PLoS One. 2018 Nov 29;13(11):e0208255. doi: 10.1371/journal.pone.0208255.
7. Mirafzal S, et al. 3D PSIR MRI at 3 Tesla improves detection of spinal cord lesions in multiple sclerosis. J Neurol. 2020 Feb;267(2):406-414. doi: 10.1007/s00415-019-09591-8. Epub 2019 Oct 26.
8. Fechner A, et al. A 3T Phase-Sensitive Inversion Recovery MRI Sequence Improves Detection of Cervical Spinal Cord Lesions and Shows Active Lesions in Patients with Multiple Sclerosis. AJNR Am J Neuroradiol. 2019 Feb;40(2):370-375. doi: 10.3174/ajnr.A5941.
9. Morris SR, et al. Myelin biomarkers in the healthy adult brain: Correlation, reproducibility, and the effect of fiber orientation. Magn Reson Med 2023 May;89(5):1809-1824. doi: 10.1002/mrm.29552.
10. Nagtegaal M, et al. Myelin water imaging from multi-echo T2 MR relaxometry data using a joint sparsity constraint. Neuroimage 2020 Oct 1;219:117014. doi: 10.1016/j.neuroimage.2020.117014.
11. Dvorak AV,et al. Rapid myelin water imaging for the assessment of cervical spinal cord myelin damage. Neuroimage Clin. 2019:23:101896. doi: 10.1016/j.nicl.2019.101896. Epub 2019 Jun 17.
Figures