2526
Recognition of Delayed Hypoxic Leukoencephalopathy after a Severe Drug Overdose Using a Divided Subtracted Inversion Recovery (dSIR) Sequence1Mātai Medical Research Institute, Tairāwhiti Gisborne, New Zealand, 2Department of Anatomy and Medical Imaging, Faculty of Medical and Health Sciences & Centre for Brain Research, University of Auckland, Auckland, New Zealand, 3Insight Research Services Associated, Gold Coast, Australia, 4University of California, San Diego, San Diego, CA, United States
Synopsis
Keywords: White Matter, Drugs, tMRI, Delayed Hypoxic Leukoencephalopathy, Drug Overdose
Motivation: Divided Subtracted Inversion Recovery (dSIR) sequences can show subtle abnormalities due to small increases in T1 that are not seen with conventional sequences,
Goal(s): To use dSIR sequences to examine the brain in a patient nine months after severe drug overdose associated with prolonged hypoxia and compare the dSIR images with T2-FLAIR images.
Approach: MRI scans obtained on an 18-y/o male control and a 19-y/o male patient. 2D IR FSE sequences were performed with TIs chosen to null WM, and a longer TIi producing dSIR images.
Results: Widespread abnormalities seen on dSIR images in areas of WM that appeared normal on T2-FLAIR images.
Impact: In a patient imaged nine months after a severe drug overdose, dSIR images showed extensive abnormalities in white matter that appeared normal on T2-FLAIR images. Widespread white matter changes may be common unrecognised sequelae of severe drug overdoses.
Background
The acute sequelae seen in the brain with MRI after severe drug overdoses include territorial and border zone infarctions, and diffuse damage to gray matter (1). Chronic changes seen with MRI are usually sequelae to the acute changes, but rarely Delayed Hypoxic Leukoencephalopathy (DHL) is seen (2,3). Its clinical features include an initial recovery period followed by deterioration 2-4 weeks later. DHL is sufficiently unusual for individual case reports and small series to be published (4-8). The term Grinkers' myelinopathy is used to describe the condition which is named after Roy Richard Grinker Sr (1900-1993), an American neurologist and psychiatrist who described it in 1925/26.MRI diagnosis of DHL is usually made with T2-weighted fast spin echo (T2-wFSE) and/or T2-FLAIR sequences. Diffuse changes are seen in the central white matter of the cerebral hemispheres.
We report a case of severe drug overdose, examined with MRI nine months later. There was no abnormality on his T2-FLAIR images, but extensive changes were seen in the white matter of his cerebral and cerebellar hemispheres using divided Subtracted Inversion Recovery (dSIR) sequences.
We raise the possibility that diffuse white matter damage may be a relatively common late complication of severe drug overdoses, but be unrecognized with conventional MRI.
Theory
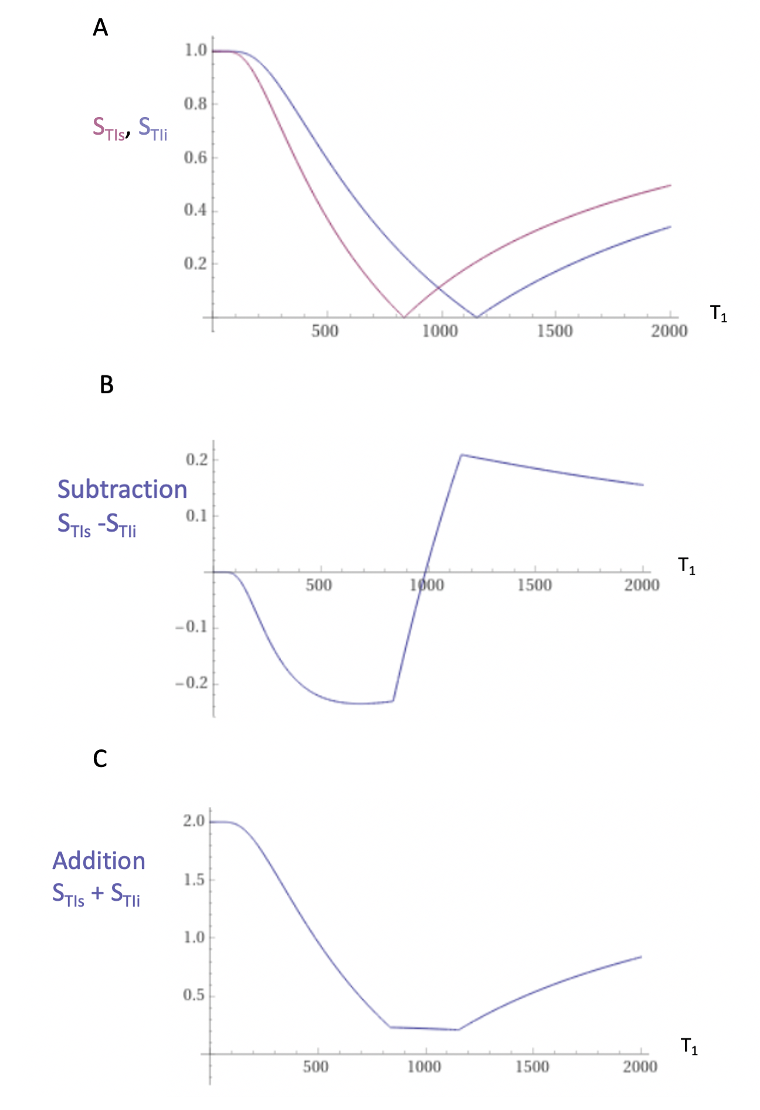
The mechanism underlying dSIR sequence contrast is shown in Figures 1 and 2.Two magnitude reconstructed IR T1-filters with different TIs: TIshort = TIs and TI intermediate = TIi are shown in Figure 1A. They are subtracted to give the Subtracted IR (SIR) T1-filter in Figure 1B and added to give the Added IR (AIR) T1-filter in Figure 1C.
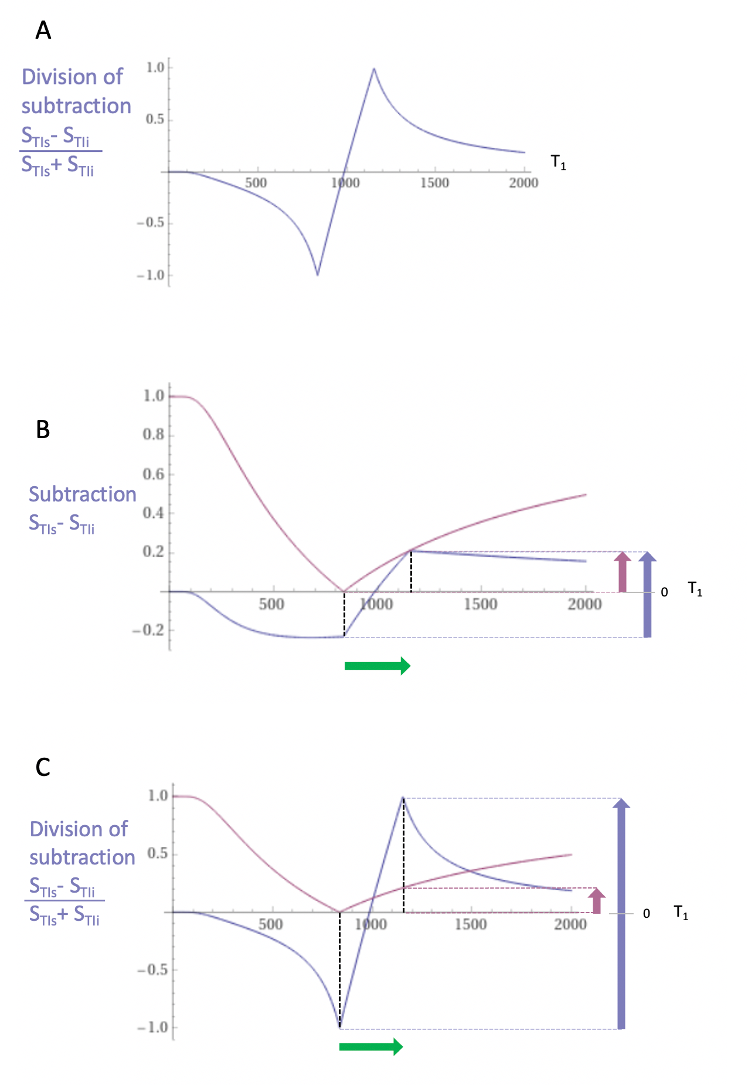
Figure 2A shows the dSIR T1-bipolar filter in which the SIR T1-filter in Figure 1B is divided by the AIR T1-filter in Figure 1C. It shows a highly positive nearly linear slope centrally in the middle Domain (mD).
Figure 2C compares the contrast produced by the STIs T1-filter (pink) to that from the dSIR T1-bipolar filter (blue) from the same increase in T1 (green arrow). The dSIR filter generates ten times more contrast (blue arrow, right) than the STIs T1-filter (pink arrow, right).
Methods
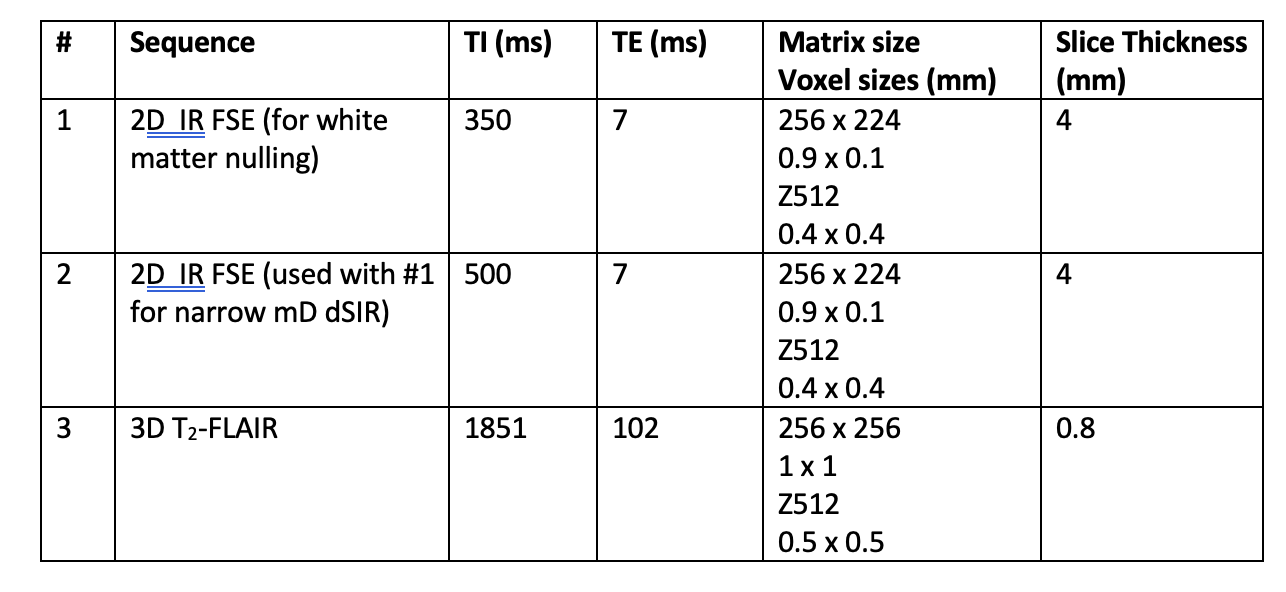
With approval from the Health and disabilities Ethics Committee (approval number 20/CEN/107), MRI scans were performed on an 18 y/o normal male control and a 19 y/o male patient nine months after a severe drug overdose. A 3T scanner (General Electric Healthcare) was used. 2D IR FSE sequences were performed with a TIs chosen to null normal white matter, and a longer TIi chosen to produce narrow mD dSIR images targeted at small increases in T1 (Figure 2C). Matched T2-FLAIR images were acquired (Table 1).Results
Case History:The 19 y/o male patient was the product of a pregnancy with a prolonged second stage of labor and required some resuscitation. Development proceeded within normal limits for physical activity but there were social cognition issues consistent with high functioning autism spectrum disorder. In his penultimate year of high school, there were attentional difficulties in an otherwise intelligent young man. At age 19 years, he took a life-threatening drug overdose. He consumed unknown, but large, amounts of amitriptyline, paracetamol, codeine phosphate, zopiclone, clonazepam and promethazine. The overdose was probably taken late evening, but he was not found until around 2 pm the following day when he was deeply unconscious. There were pressure sores on the left side of his body and he suffered compression injuries to the neural structures of his left arm. He probably survived because there had been clumping of drugs in his stomach with slow release and absorption. After emptying of his stomach contents, he slowly regained consciousness and improved functionally. He retains his prior intellect but does have some slowing of information processing as well as reduction in attentional capacity and overall function.
MRI:
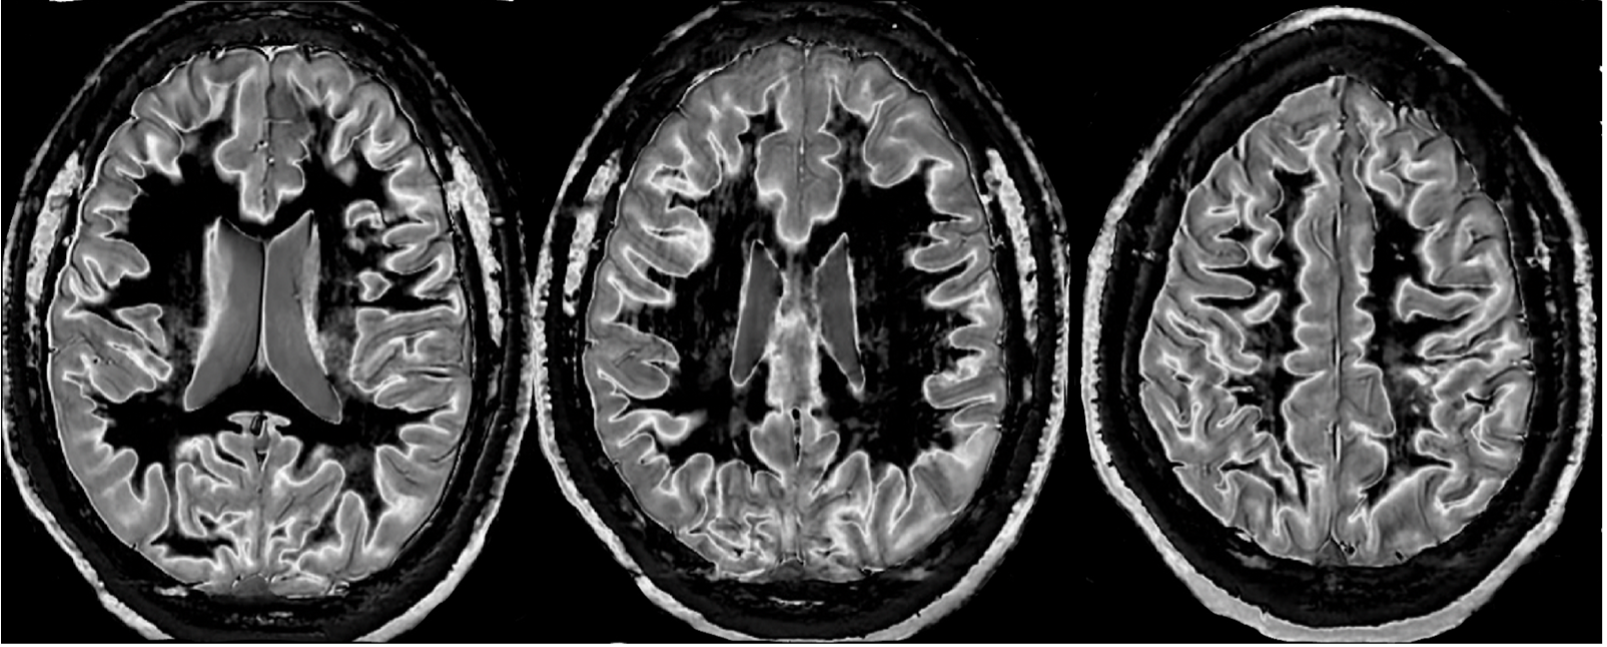
Figure 3 shows narrow mD dSIR images from the normal control. The white matter shows low signal (dark appearance).
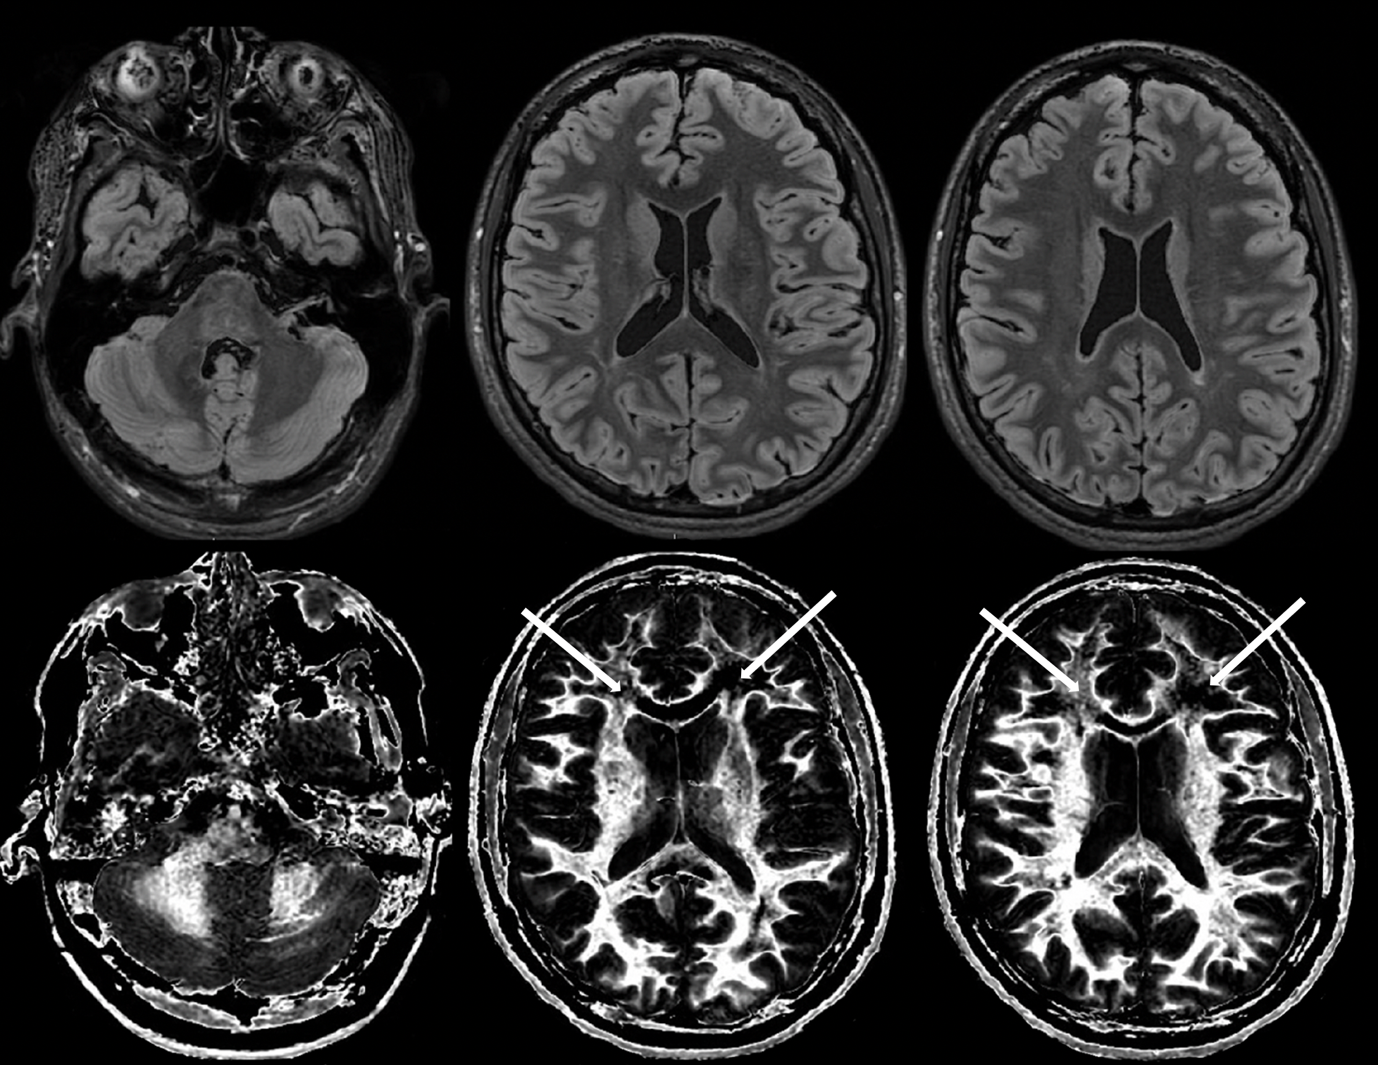
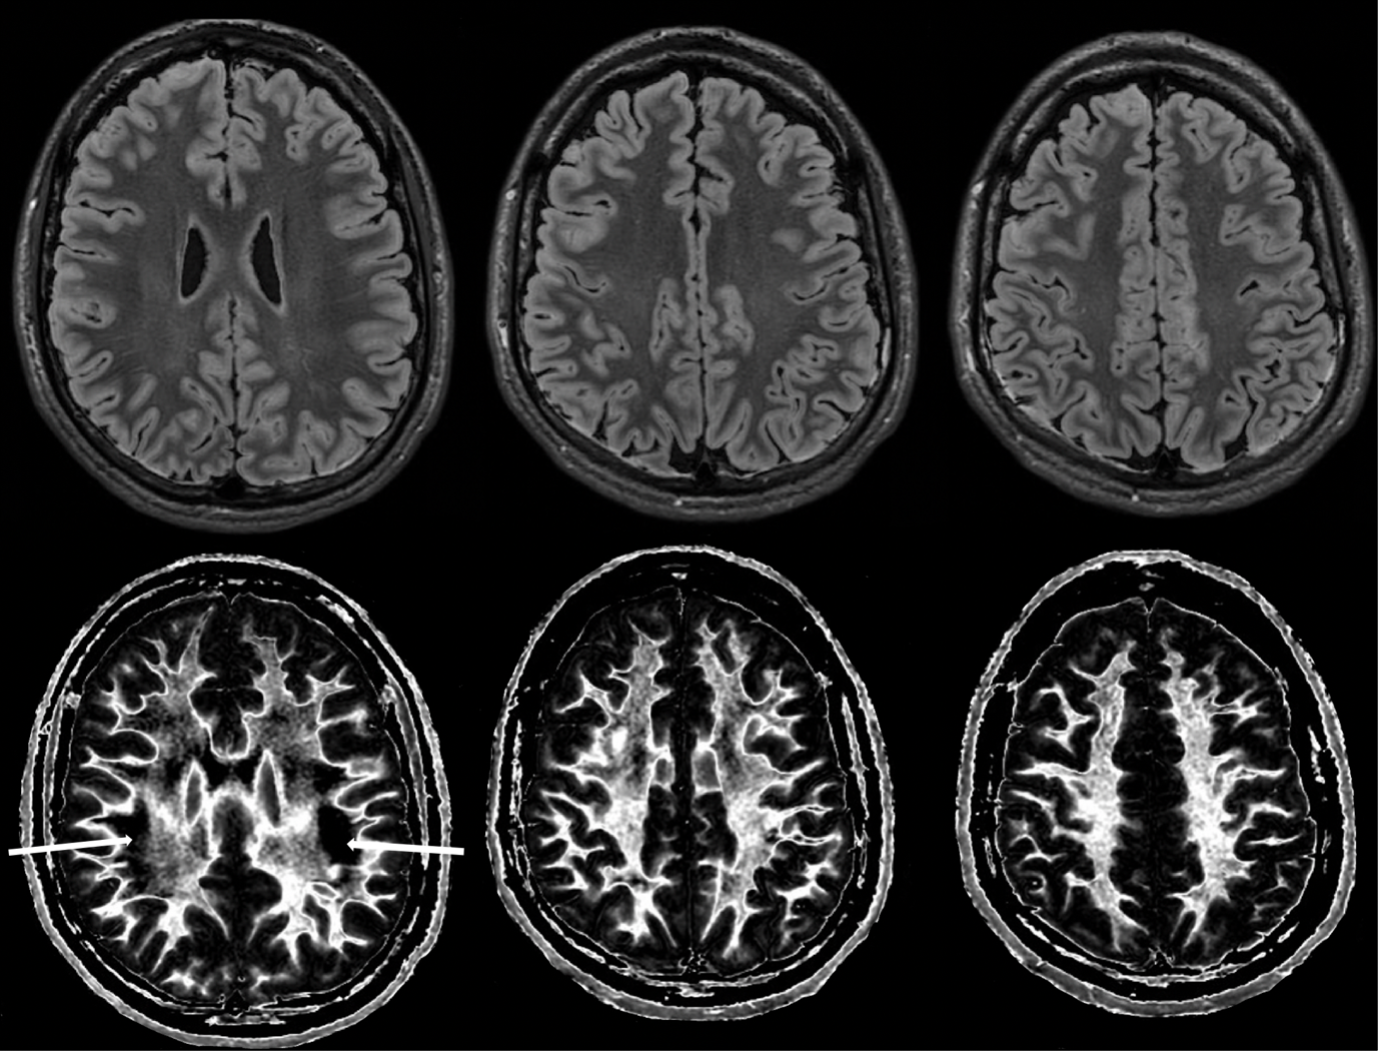
Figures 4 and 5 compare T2-FLAIR images (upper rows) with matched dSIR images (lower rows) in the patient. No abnormality is seen in white matter on the T2-FLAIR images but extensive high signal abnormalities are seen in white matter on the dSIR images.
Discussion
The patient showed no abnormality on conventional T2-FLAIR images but extensive abnormalities on his dSIR images. The underlying pathology is likely to be neuroinflammation and/or demyelination (10,11). Classical DHL may only represent the severe end of a spectrum of white matter sequelae following severe drug overdoses. Subtle white matter damage may be a more common late complication, but be unrecognized with conventional MRI.Acknowledgements
Funding: We would like to acknowledge support from the Hugh Green Foundation, Manaaki Moves Trust, the JN &HB Williams Foundation, Mangatawa Beale Williams Memorial Trust, and Kānoa New Zealand. We are also grateful for support from the people of Tairāwhiti, GE Healthcare and Mātai Ngā Māngai Māori.References
1. Winstanley EL, Mahoney III JJ, Castillo F, Comer SD. Neurocognitive impairments and brain abnormalities resulting from opioid-related overdoses: a systemic review. Drug Alcohol Depend 2021;226:108838. doi: 10.1016/j.drugalcdep.2021.108838.
2. Plum F. Delayed neurological deterioration after anoxia. Arch Int Med 1962;110(1):18-25.
3. Schprecher D, Mehta L. The syndrome of delayed post-hypoxic leukoencephalopathy. NeuroRehab 2010;26(1):65-72.
4. Schprecher D, Flanagan K, Smith GA, Smith S, Schenkenberg T, Steffens J. Clinical and diagnostic features of delayed hypoxid leukoencephalopathy. J Neuropsych Clin Neurosci 2008;20(4): 107-111.
5. Custodio CM, Beford JR. Delayed post anoxic encephalopathy: a case report and literature review. Arch Phy Med Rehab 2003;85(3):502-505.
6. Balan S, Gupta K, Balsundaram P, Jadon R. Reversible hyposic brain injury: the penumbra conundrum of Grinker. BMJ Case Rep 2019;12:e228670. doi: 10.1136/bcr-2018-228670.
7. Zamora CA, Nauen D, Hynecek R, Ilica AT, Izbudak I, Sair HI, Gujar SK, Pillai JJ. Delayed posthypoxic leukoencephalopathy: a case series and review of the literature. Brain and Behavior 2015;5(8):e00364. doi: 10.1002/brb3.364.
8. Malloy S, Soh C, Williams TL. Reversible delaled posthypoxic leukoencephalopathy. Case Report. AJNR Am J Neuroradiol 2006;27(8):1763-1765.
9. Ma YJ, Moazamian D, Cornfeld DM, Condron P, Holdsworth SJ, Bydder M, Du J, Bydder GM. Improving the understanding and performance of clinical MRI using tissue property filters and the central contrast theorem, MASDIR pulse sequences and synergistic contrast MRI. Quant Imaging Med Surg. 2022;12(9):4658-90.
10. Quarantelli M. MRI/MRS in neuroinflammation: methodology and applications. Clin Transl Imaging 2015;3:475–489
11. Laule C, Port JD (Eds). Imaging Neuroinflammation. Cambridge MA, Academic Press, 2023.
Figures