2524
Demonstration of TE-dependence of lateralization of structural connectomes1Nanjing University of Science and Technology, Nanjing, China, 2Union Hospital, Tongji Medical College, Huazhong University of Science and Technology, Wuhan, China, 3Hubei Province Key Laboratory of Molecular Imaging, Wuhan, China, 4Philips Healthcare, Wuhan, China
Synopsis
Keywords: Tractography, Tractography & Fibre Modelling
Motivation: Lateralization of structural connectomes has become a widespread measurement for investigating brain asymmetry alterations during brain development, maturation and aging in health and disease. However, it is still unclear whether the acquisition parameters affect the lateralization measurement of structural connectomes.
Goal(s): We aim to investigate the TE-dependence of lateralization of structural connectomes.
Approach: We compared the lateral indices of structural connectivity generated by diffusion MRI on five different TEs.
Results: Diverse TE values in MRI scans lead to apparent differences in connectome lateralization, with more than 30% of connections of the same subject likely to have different lateral indices.
Impact: This research reveals the unknown relationship between TE and connectome lateralization and discover the potential influence of TE in connectome’s anatomy analysis, helping improve the acquisition protocol of future neuroimaging studies, especially in brain asymmetry during development, maturation and aging.
Introduction
The lateralization of structural connectomes has become a widely used measurement to investigate brain asymmetry during brain development, maturation, and aging in both healthy and diseased individuals. Connectome asymmetry refers to the specialization of certain neural functions to one side of the brain. This feature is a well-known aspect of the human brain and has been used in various brain-related research to study specific cognitive functions 1. Structural connectomes are typically constructed using fiber orientation distribution (FOD) based tractography. However, FOD does not explicitly account for compartment-specific T2 relaxation, and its model parameters are usually estimated from data acquired with a single echo time (TE). Thus, the tractography-derived measures, such as the structural connectivity, could be TE-dependent. However, the potential impact of different TE values on the analysis of brain connectome structures remains unclear. In this research, we compared the lateralization index of structural connectomes with different TE values to determine the underlying relationship between them.Methods
Dataset: A high-quality rdMRI dataset from a cohort of 2 healthy volunteers was acquired using a Philips 3T MRI scanner. The rdMRI data is scanned using a multi-shell, multi-echo dMRI sequence with fixed diffusion time, [4, 4, 8, 8, 16] non-collinear diffusion-encoding directions at each of b=[0, 400, 800, 1600, 3200] s/mm2 respectively, TE=[75, 85, 95, 105, 115] ms, TR=4000 ms, 1.5 mm isotropic voxel size. Each rdMRI scan is well-processed for artifact and distortion corrections using a well-designed rdMRI-specific processing pipeline. In addition, T1-weighted and T2-FLAIR three-dimensional (3D) images were also acquired.Tracking algorithms: We applied two popular probabilistic tractography algorithms (iFOD1, iFOD2) 2,3 and a deterministic tractography algorithm (DET) 2 implemented by MRtrix3 4 separately to generate the original tractography for each subject.
Biological features for study: We studied seven different biological microstructural characteristics and calculated their lateral indices before and after filtering. These features include connectivity(connection numbers divided by the volume of the two brain regions), total length of all streamlines between two brain regions, AD (Axial Diffusivity), FA (Fractional Anisotropy), RD (Radial Diffusivity), FW (Free Water) and MD (Mean Diffusion).
Structural connectome: A structural connectome was generated based on dMRI tractography. We used the sum of streamline weights to compute edge weights. Weighting edges by diffusion metric in this manner is thought to provide an index of the microstructural integrity of the underlying white matter connections. Meanwhile, we used SIFT2 5 to calculate the per-streamline weights and used the weights file for better connectome reconstruction.
Calculation of brain asymmetry: Brain laterality is displayed where connections between two specific brain regions from the left and right cerebral hemispheres are asymmetrical. We calculated the lateral index using the expression (L1L2-R1R2)/(L1L2+R1R2) as L1L2 refers to the connection between regions one and two from the left hemisphere, and R1R2 refers to the connection between the same two regions from the right hemisphere 6–8.
Data analysis: We compared these lateral values for seven biological features as well as different tracking algorithms for tractography based on different TE values and practiced a paired T-test (p<0.05) to find a difference between these lateralization indices.
Results and discussion
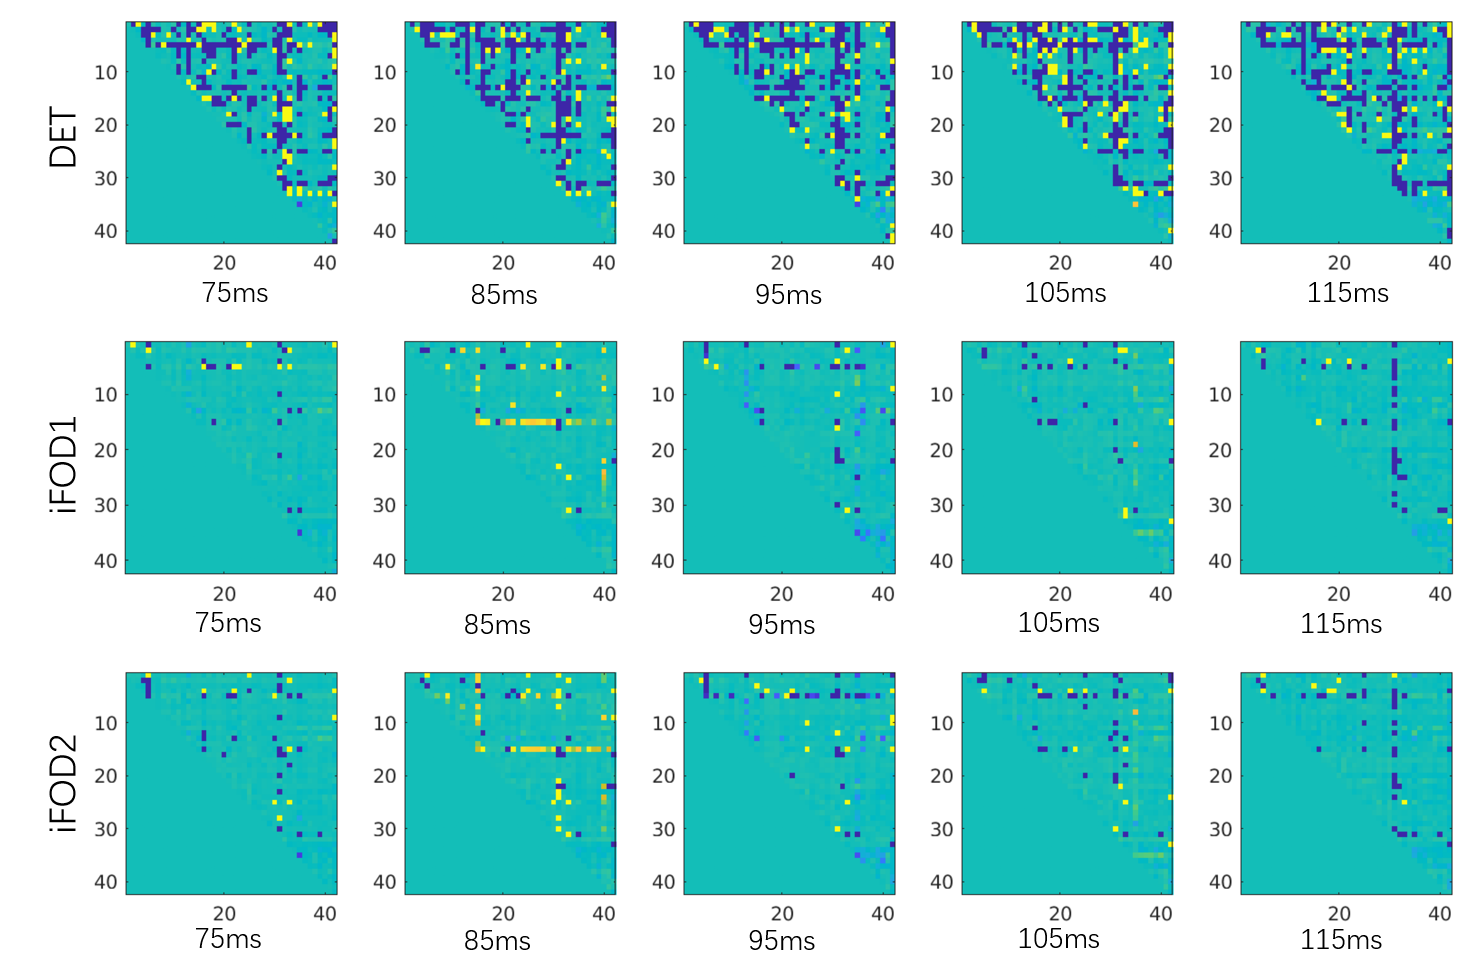
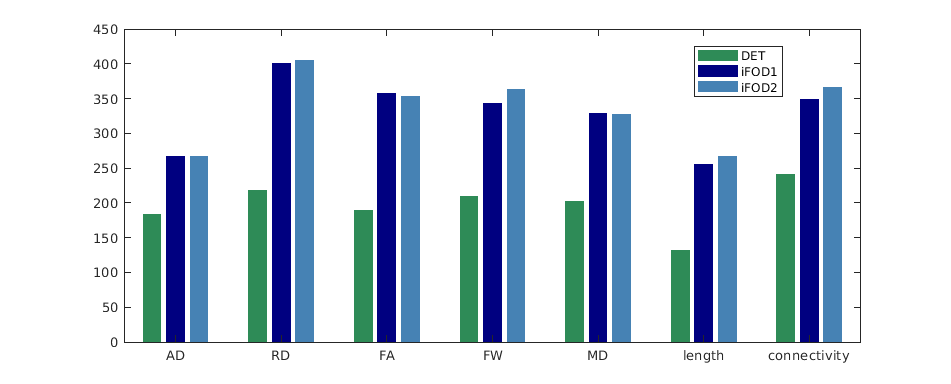
It has been observed that the connectome lateralization index varies significantly when calculated using different TE values. This discrepancy is evident in various microstructural biological features, where there is a difference of around 29% (267 connections for total connection length) to 44% (405 connections for RD) in all 903 region connections (Fig.1). Among the three tracking algorithms, the deterministic algorithm shows fewer lateral differences than the other two probabilistic algorithms but still highlights more than 14% of connections (Fig.2). Researchers are concerned about the susceptibility of connectome lateralization indices to the MRI parameters of TE. This raises the possibility that the connectome lateralization could be affected not only by TE but also by many other acquisition parameters. Therefore, future research should focus on the robustness of lateralization measurement across different acquisition protocols.Acknowledgements
This work was supported by the National Natural Science Foundation of China (Nos. 62201265, 62101365, 62172228) and the Natural Science Foundation of Hubei Province of China (No. 2021CFB442).References
1. Hugdahl K. Lateralization of cognitive processes in the brain. Acta Psychol (Amst). 2000;105(2):211-235. doi:10.1016/S0001-6918(00)00062-7
2. Tournier JD, Calamante F, Connelly A. MRtrix: Diffusion tractography in crossing fiber regions. Int J Imaging Syst Technol. 2012;22(1):53-66. doi:10.1002/ima.22005
3. (ISMRM 2010) Improved Probabilistic Streamlines Tractography by 2nd Order Integration Over Fibre Orientation Distributions. Accessed November 6, 2023. https://archive.ismrm.org/2010/1670.html
4. Tournier JD, Smith R, Raffelt D, et al. MRtrix3: A fast, flexible and open software framework for medical image processing and visualisation. NeuroImage. 2019;202:116137. doi:10.1016/j.neuroimage.2019.116137
5. Smith RE, Tournier JD, Calamante F, Connelly A. SIFT2: Enabling dense quantitative assessment of brain white matter connectivity using streamlines tractography. NeuroImage. 2015;119:338-351. doi:10.1016/j.neuroimage.2015.06.092
6. O’Donnell LJ, Westin CF, Norton I, et al. The Fiber Laterality Histogram: A New Way to Measure White Matter Asymmetry. In: Jiang T, Navab N, Pluim JPW, Viergever MA, eds. Medical Image Computing and Computer-Assisted Intervention – MICCAI 2010. Lecture Notes in Computer Science. Springer; 2010:225-232. doi:10.1007/978-3-642-15745-5_28
7. Propper RE, O’Donnell LJ, Whalen S, et al. A combined fMRI and DTI examination of functional language lateralization and arcuate fasciculus structure: Effects of degree versus direction of hand preference. Brain Cogn. 2010;73(2):85-92. doi:10.1016/j.bandc.2010.03.004
8. Thiebaut de Schotten M, ffytche DH, Bizzi A, et al. Atlasing location, asymmetry and inter-subject variability of white matter tracts in the human brain with MR diffusion tractography. NeuroImage. 2011;54(1):49-59. doi:10.1016/j.neuroimage.2010.07.055
Figures