2515
Fast Single-Point Macromolecular Proton Fraction Mapping using a 0.3 T MRI System1Department of Medical Image Sciences, Faculty of Life Sciences, Kumamoto University, Kumamoto, Japan, 2Department of Radiology, Hospital of the University of Occupational and Environmental Health, Fukuoka, Japan, 3Department of Neurology, National Hospital Organization Omuta National Hospital, Fukuoka, Japan, 4Department of Radiology, National Hospital Organization Kumamoto Saishun Medical Center, Kumamoto, Japan, 5Department of Radiology, National Hospital Organization Omuta National Hospital, Fukuoka, Japan
Synopsis
Keywords: Other Neurodegeneration, CEST & MT
Motivation: Quantifying myelin content in 0.3 T low-field MRI presents a challenge owing to prolonged imaging times and a low signal-to-noise ratio.
Goal(s): The study aimed to validate the practical feasibility of macromolecular proton fraction (MPF) mapping in the brain using a 0.3 T MRI system.
Approach: A phantom study with protein samples and an in vivo investigation were conducted.
Results: The study findings indicate a robust correlation between 0.3 T MPF in brain tissue, MPF at 3.0 T, and previously reported MPF at 0.5 T.
Impact: The fast single-point MPF mapping using a 0.3 T MRI exhibited the capacity to accurately measure brain MPF in a clinically feasible timeframe, providing a valuable tool for assessing myelin content.
INTRODUCTION
Accurate demyelination and myelin regeneration assessments are crucial for diagnosing neurodegenerative conditions, such as multiple sclerosis, and for applications in neuro-regenerative medicine. Macromolecular proton fraction (MPF) mapping offers a reliable means to assess demyelination because of its minimal susceptibility to physiological confounders. MPF can be quantified through a two-pool MT model analysis and remains independent of static magnetic field strength, ranging from 0.5 T to 11.7 T. A recently proposed single-point method enables the generation of accurate MPF maps from a single set of MT-weighted images captured under uniform conditions. Low-field MRI systems of 0.3 T permanent magnets are widely adopted in developing nations and small facilities due to their cost-effectiveness. If MPF mapping can be successfully implemented on 0.3 T permanent magnet MRI systems, it holds the potential to significantly enhance their utility in myelin content assessment. Therefore, this study aims to evaluate the feasibility of MPF mapping on a 0.3 T permanent-magnet MRI scanner.MATERIALS AND METHODS
The study used a 0.3 T MRI system—AIRIS Vento—with a quadrature head coil (MR-QHC-101R) (Fujifilm Healthcare, Tokyo, Japan). Additionally, a 3.0 T MRI system—Ingenia—with a phased array coil (Philips Healthcare, Best, The Netherlands) was employed in this study.Phantom study
A phantom study assessed MPF linearity against protein density. BODYWING protein powder (Aswell, Kanagawa, Japan) was mixed with distilled water to create six varying protein solutions. [A1] The MPF protocol utilized a standard 3D fast-spoiled gradient-echo sequence based on a single-point reference method. PD-, T1-, and MT-weighted phantom images were obtained at 0.3 T and 3.0 T. Imaging times were 33 and 16 minutes at 0.3 T and 3.0 T, respectively. MPF maps were generated using C++ software with a single-point synthetic reference algorithm. The two-pool model parameters for 0.3 T and 3.0 T adhered to established configurations for 0.5 T and 3.0 T systems. MPF values were measured for each phantom section from the maps produced at both magnetic field strengths.
In vivo study
This study included 16 healthy volunteers (average age: 24.6 years) to assess MPF at 0.3 T. Among these, eight (average age: 25.8 years) also underwent 3.0 T imaging. T1-, PD-, and MT-weighted images were acquired at both field strengths using parameters from the phantom study. MPF maps were then normalized to MNI space. Nine bilateral brain tissue ROIs were established, and MPF values were quantified. The study further compared the MPF discrepancies at 0.3 T, 3.0 T, and existing data at 0.5 T.
RESULTS
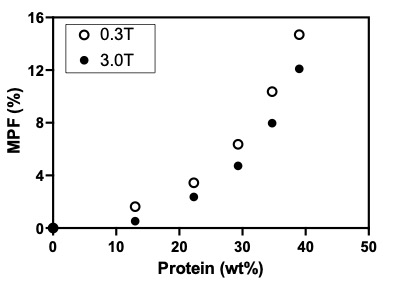
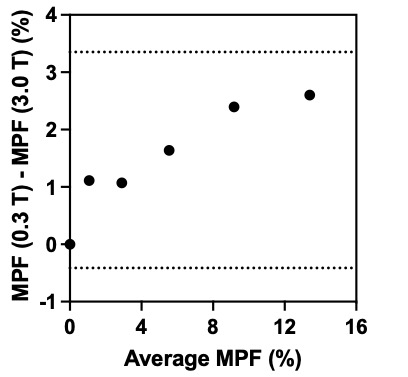
Phantom studyThe Pearson’s correlation coefficient between protein concentration and MPF at 0.3 T and 3.0 T was 0.92 and 0.90, respectively (p = 0.0088 and 0.014) (Fig. 1). Figure 2 presents a Bland–Altman plot illustrating MPF agreement across six phantoms at 0.3 T and 3.0 T. The analysis yielded a mean bias of 1.47% and a standard deviation (SD) of 0.96% for MPF differences between the two field strengths.
In vivo study
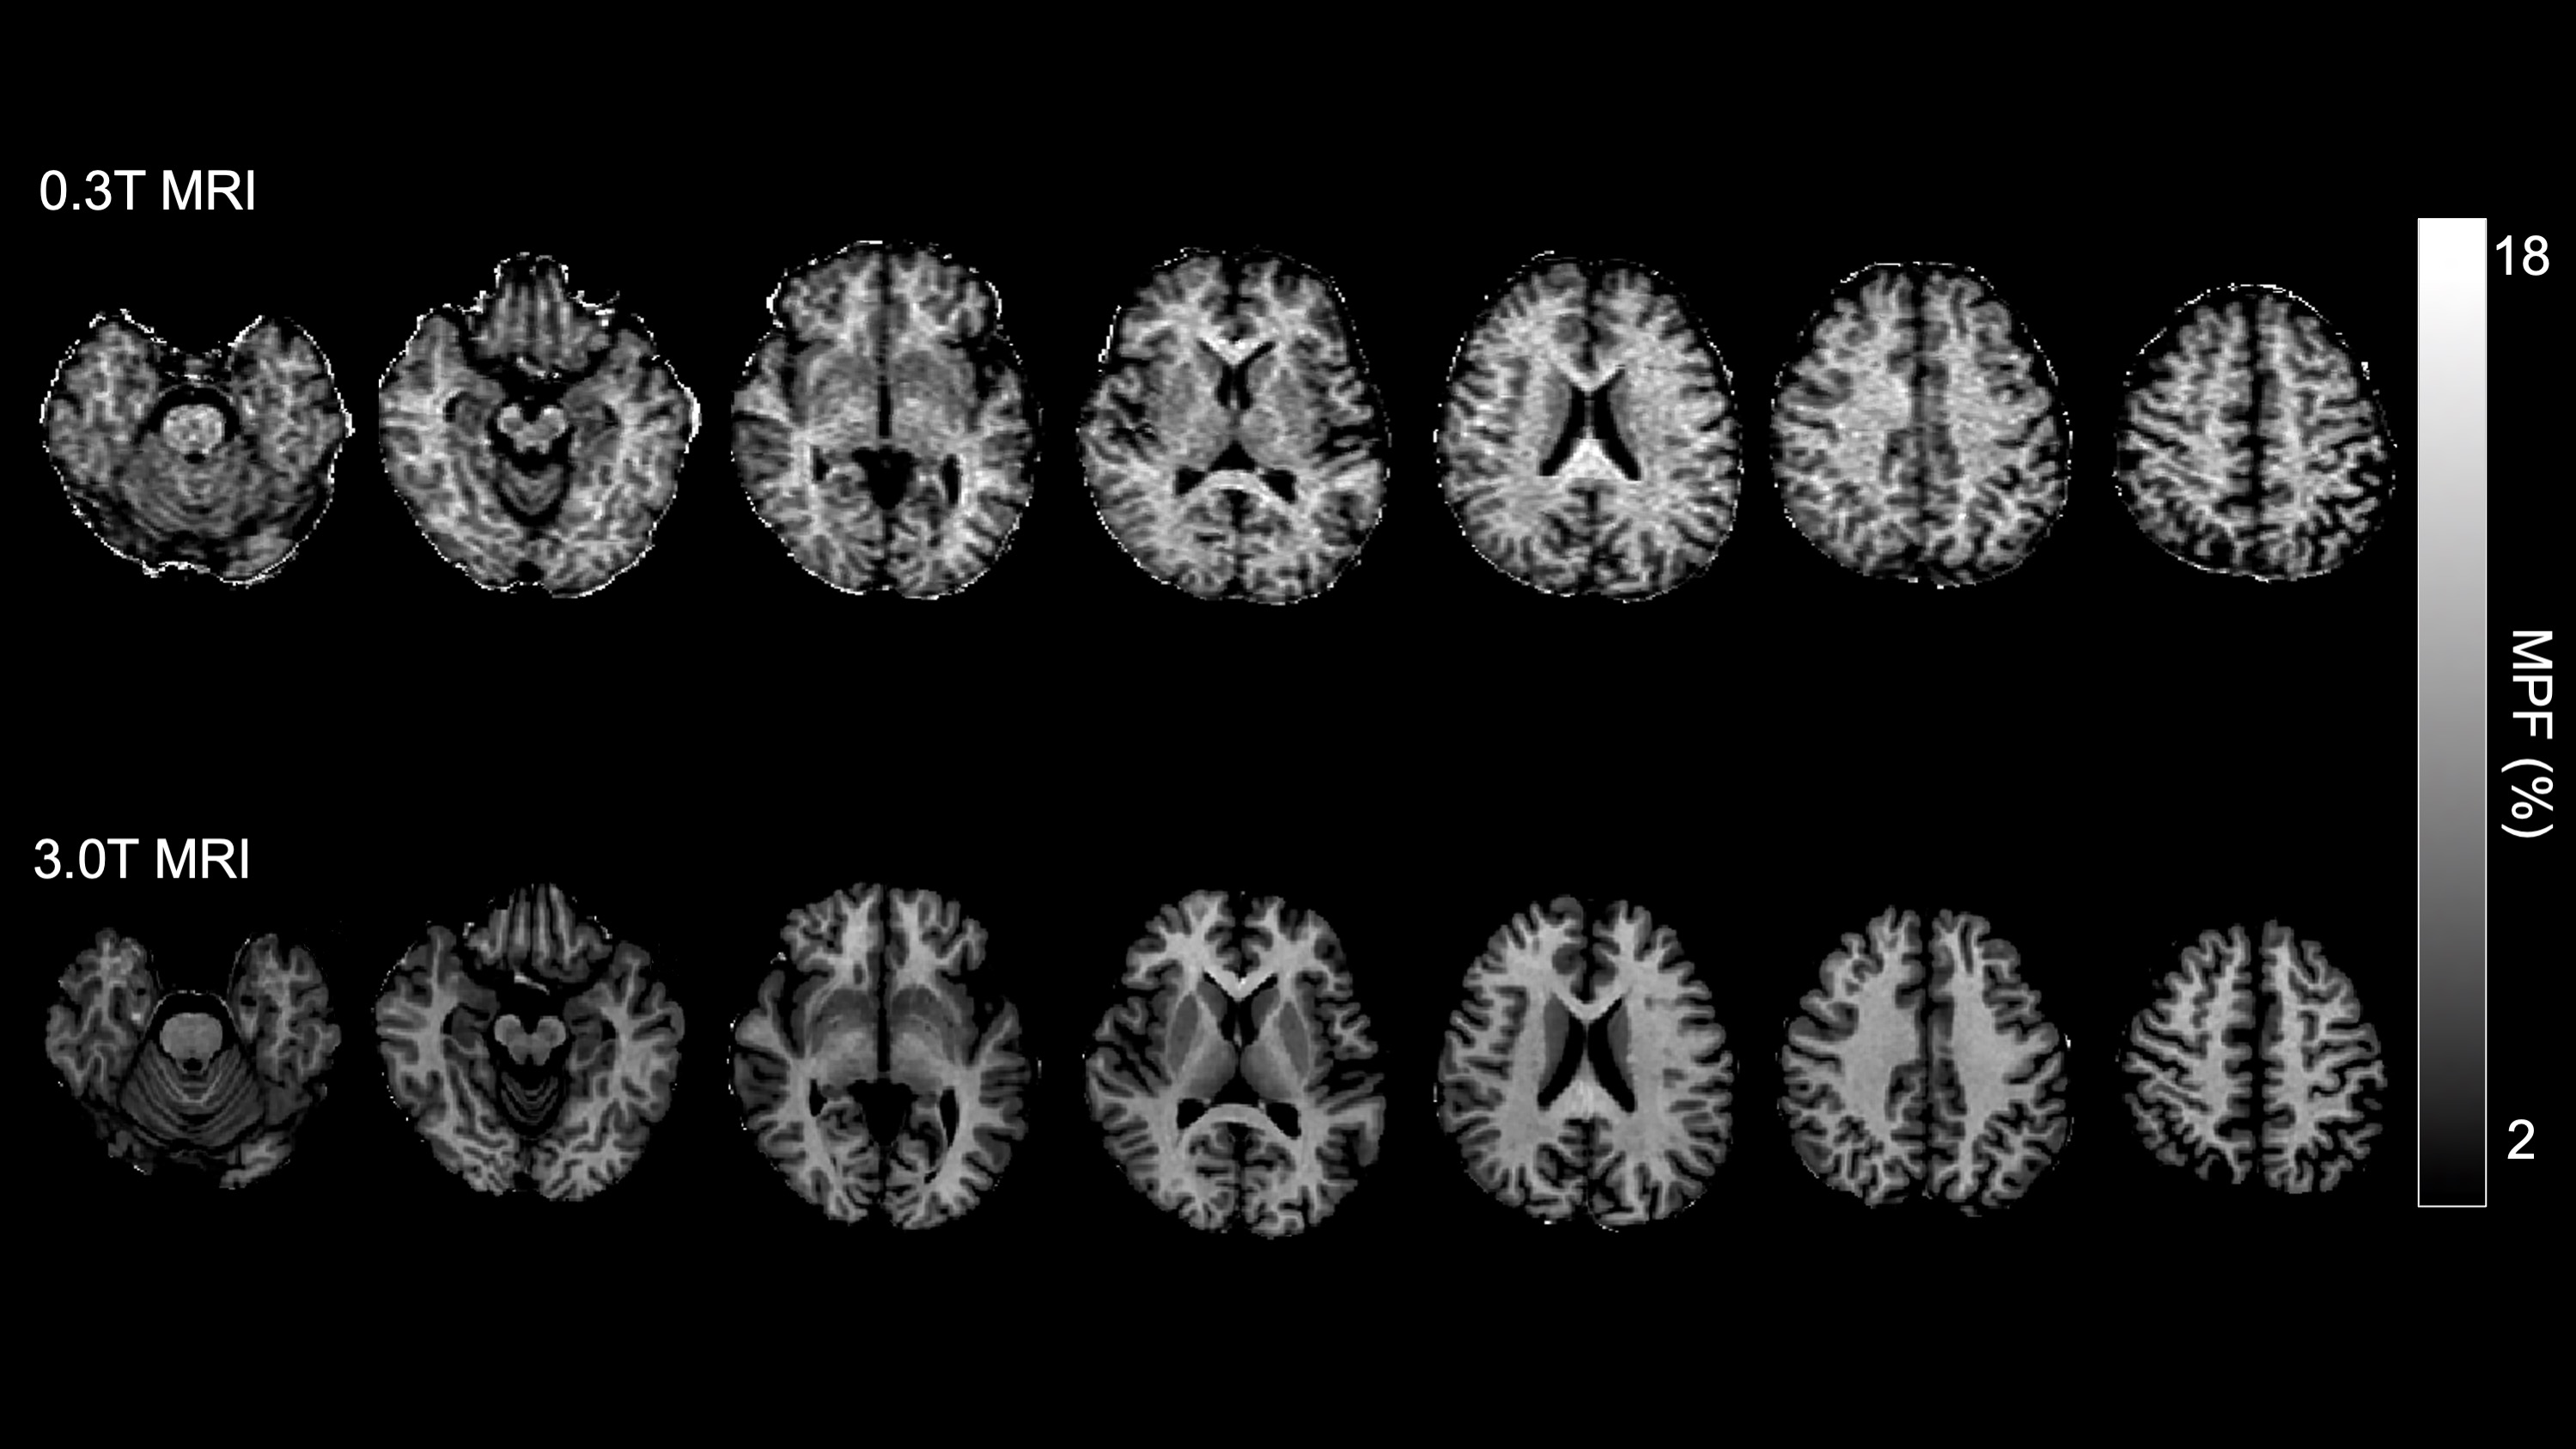
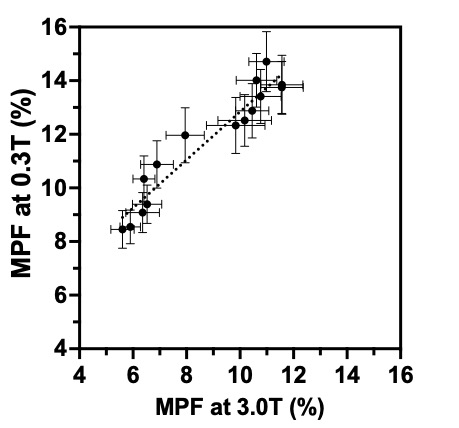
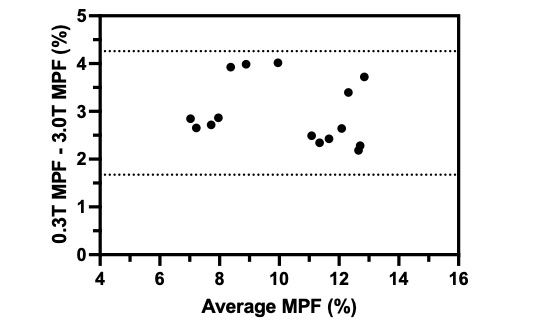
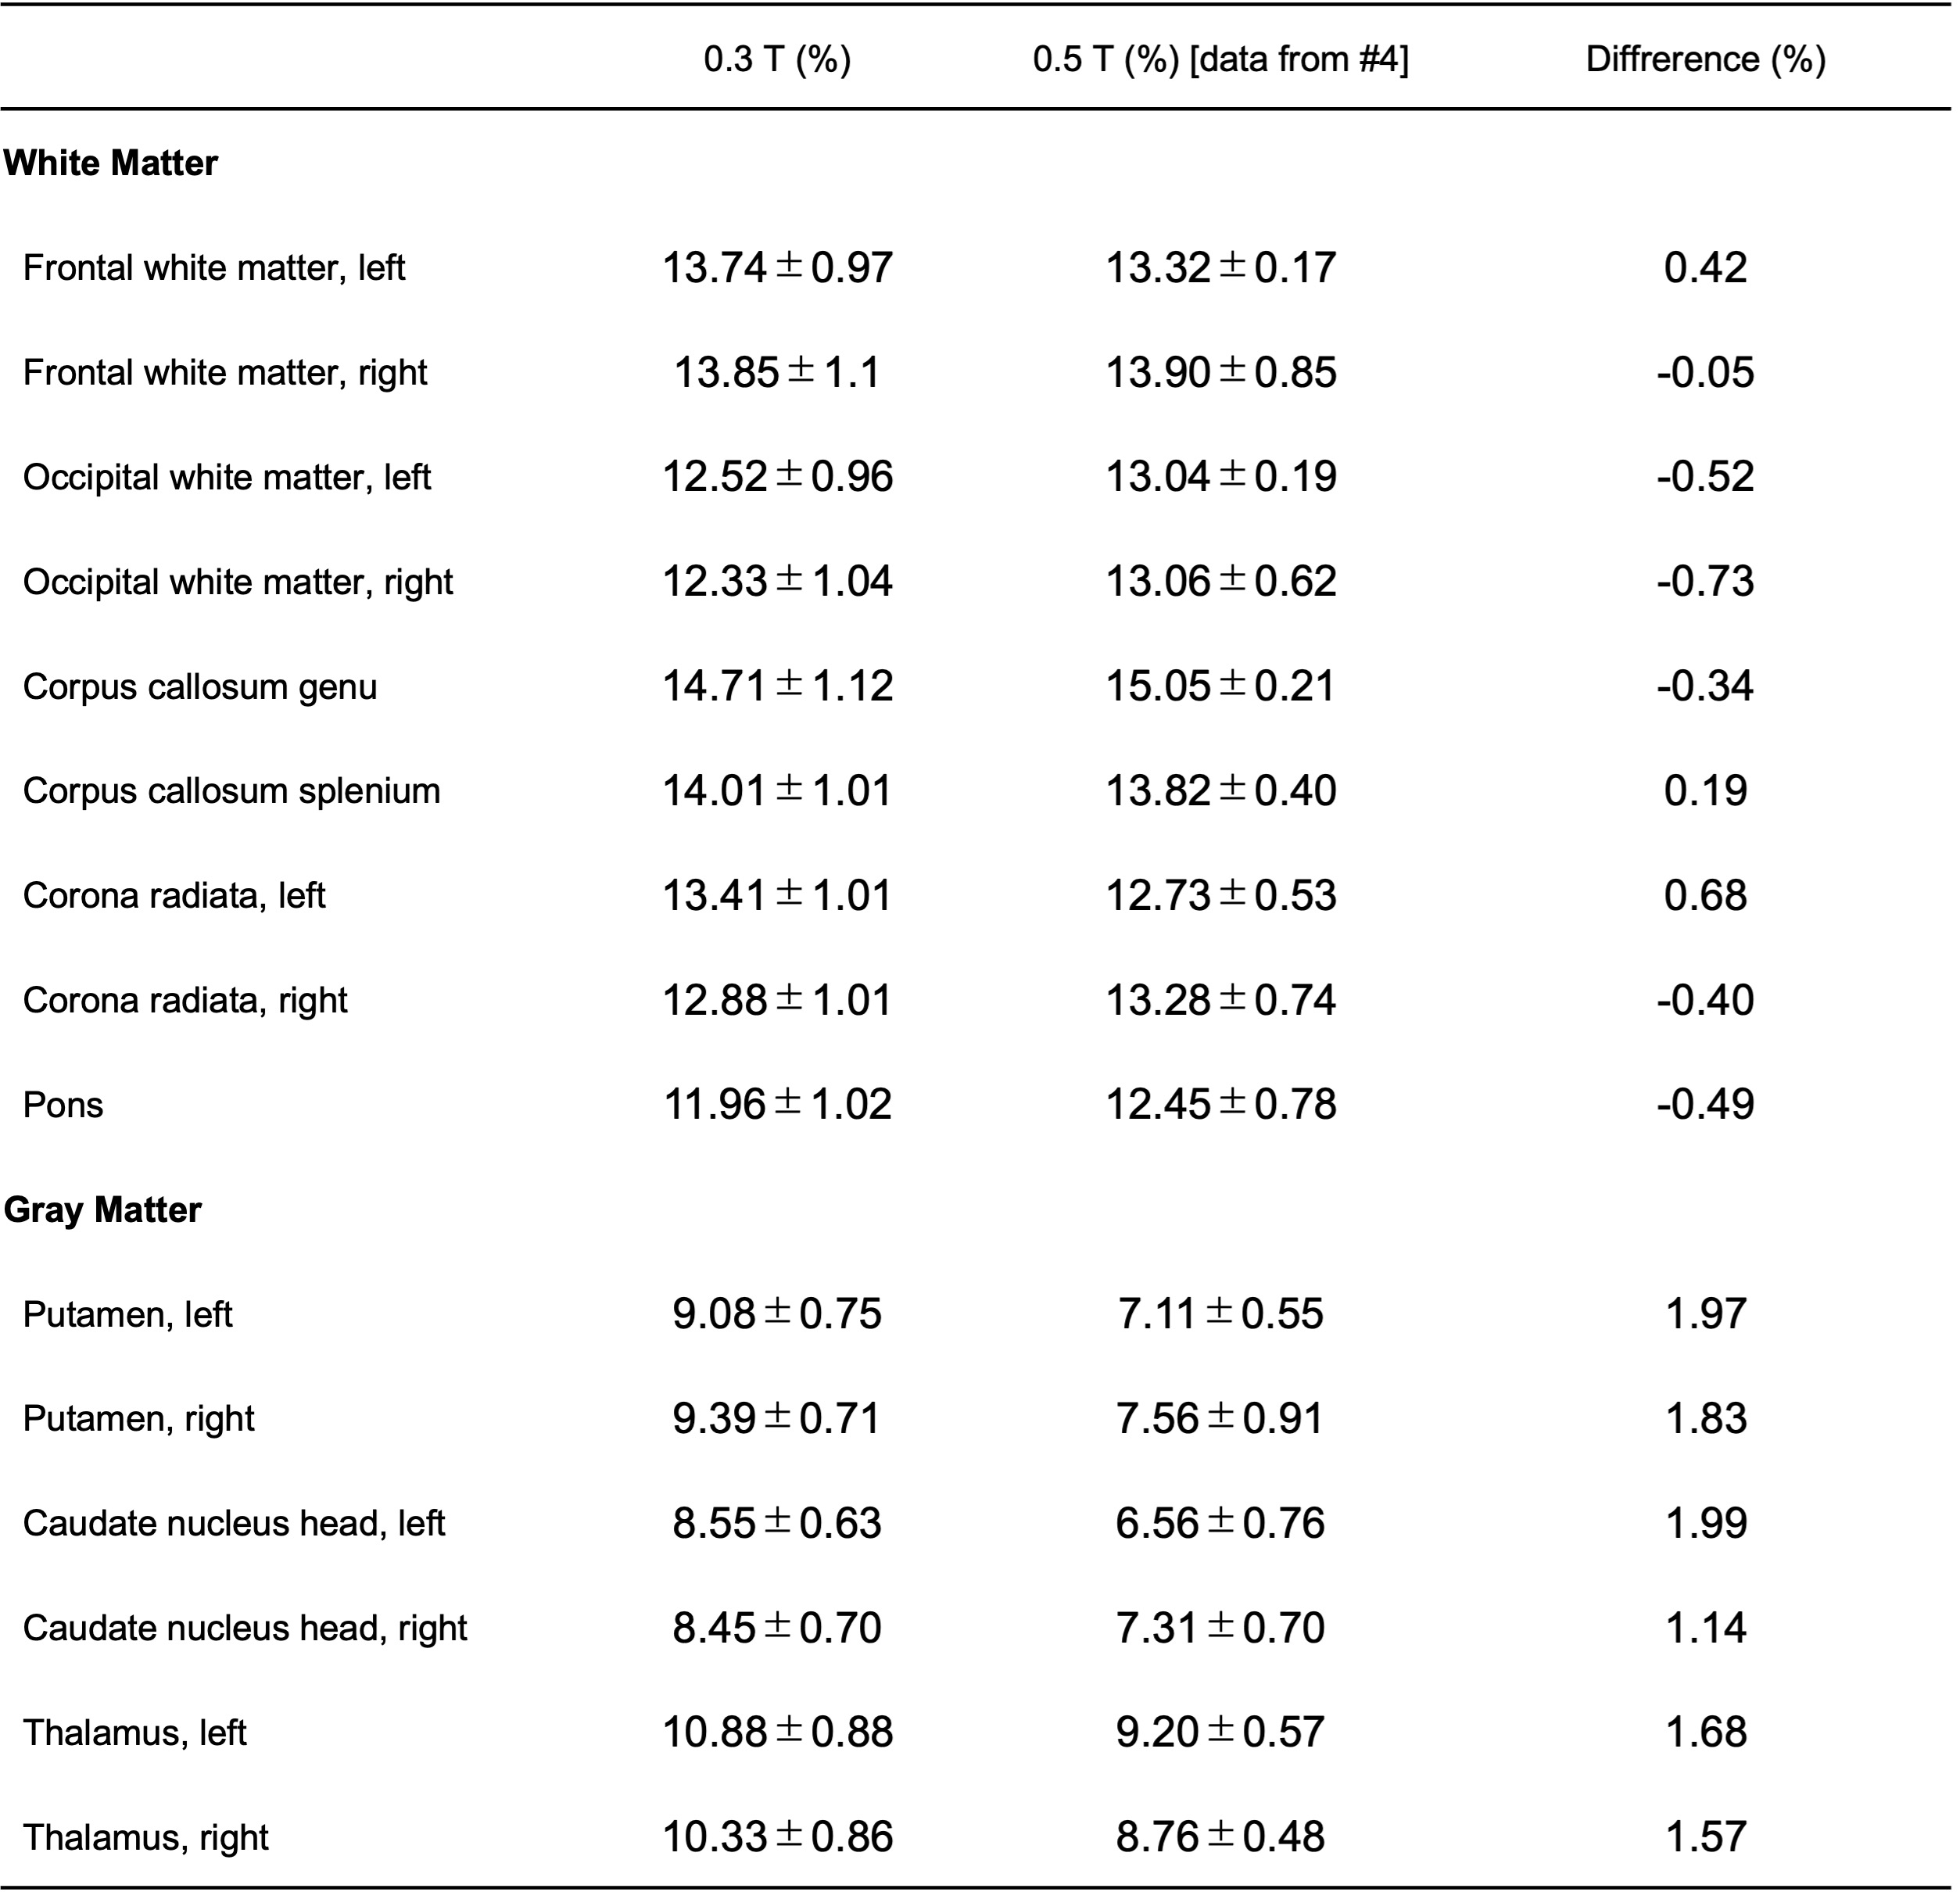
Figure 3 shows representative brain MPF maps at 0.3 T and 3.0 T. Figure 4 shows the relationships between MPF at 0.3 T and 3.0 T, revealing a strong correlation (r = 0.96, p < 0.0001). Figure 5 displays a Bland–Altman plot comparing brain MPF values at 0.3 T and 3.0 T, indicating a mean bias of 2.97% and a standard deviation (SD) of 0.66%. Table 1 lists the MPF measurements for white and gray matter at 0.3 T and 0.5 T. Notably, 0.3 T MPF was strongly correlated with the literature values measured at 0.5 T (r = 0.98, p < 0.0001). The average differences in MPF were -0.59% and 1.70% in white and gray matter, respectively.
DISCUSSION
The findings decisively show that MPF mapping at 0.3 T can accurately quantify protein concentrations, affirming its utility for myelin content evaluation. The phantom study's high precision suggests that the single-point MPF mapping withstands image noise. Moreover, the in vivo study's robust correlations between MPF values at 0.3 T and those at 0.5 T and 3.0 T support the viability of fast single-point MPF mapping on 0.3 T MRI systems. This technique offers accurate brain MPF quantification in a timeframe suitable for clinical practice, facilitating myelin content assessment.Acknowledgements
This work was supported in part by the Grants-in-Aid for Scientific Research (C) 21K07616 and 22K07698 from the Japan Society for the Promotion of Science.References
- Yarnykh, V. L. Fast macromolecular proton fraction mapping from a single off-resonance magnetization transfer measurement. Magn. Reson. Med. 68, 166–178 (2012).
- Piredda, G. F., Hilbert, T., Thiran, J.-P. & Kober, T. Probing myelin content of the human brain with MRI: A review. Magn. Reson. Med. 85, 627–652 (2021).
- Kisel, A. A., Naumova, A. V. & Yarnykh, V. L. Macromolecular proton fraction as a myelin biomarker: Principles, validation, and applications. Front. Neurosci. 16, 819912 (2022).
- Anisimov, N. V., Pavlova, O. S., Pirogov, Y. A. & Yarnykh, V. L. Three-dimensional fast single-point macromolecular proton fraction mapping of the human brain at 0.5 Tesla. Quant. Imaging Med. Surg. 10, 1441–1449 (2020).
Figures