2513
Exploring the Efficacy of Different Combinations of B-Values and B-Tensor Shapes in Assessing Spinal Cord in MS and NMOSD Using Micro-FA1Toho University, Tokyo, Japan, 2Radiology, Faculty of Medicine, Juntendo University, Tokyo, Japan, 3Neurology, Faculty of Medicine, Juntendo University, Tokyo, Japan, 4Radiological Technology, Faculty of Health Science, Juntendo University, Tokyo, Japan, 5Siemens Japan K.K., Tokyo, Japan, 6Faculty of Health Data Science, Juntendo University, Chiba, Japan, 7NeuroPoly Lab, Polytechnique Montreal, Montréal, QC, Canada
Synopsis
Keywords: Spinal Cord, Spinal Cord
Motivation: The necessity to accurately delineate microstructural changes in the spinal cords of MS and NMOSD patients in vivo.
Goal(s): Assess if multiple b-tensor diffusion MRI data enhances the clinical utility of Micro Fractional Anisotropy (μFA) in distinguishing pathological variances in MS and NMOSD.
Approach: Comparative analysis of μFA values derived from planar tensor encoding data (DDE) and a combination of DDE with linear tensor encoding data was conducted.
Results: No significant μFA difference between MS and NMOSD was found, and additional linear tensor encoding data did not improve the results, highlighting the need for optimized imaging protocols.
Impact: This study elucidates the criticality of optimizing imaging protocols over merely aggregating data for precise diagnostic outcomes in MS and NMOSD. It prompts further investigation into refining imaging methodologies to uncover microstructural changes, enhancing diagnostic accuracy and subsequent patient management.
Introduction:
Both Multiple Sclerosis (MS) and Neuromyelitis Optica Spectrum Disorder (NMOSD) exhibit similar imaging findings on routine MRI, albeit stemming from distinct pathological changes. The need for imaging methods that accurately delineate the status of each condition is paramount. The limitations of routine MRI, such as in discerning normal appearing white matter (NAWM)1 and gray matter (NAGM), have been historically highlighted through advanced MRI imaging or analysis methods like diffusion MRI. For instance, the quantitative metric μFA2, 3, derived from double diffusion encoding (DDE) data, has been insightful. Recent advances utilizing multiple b-tensor diffusion MRI data have shown promise in better understanding tissue microstructure4, 5. This study explores the premise that augmenting data through multiple encoding methods enhances evaluation accuracy. We compared μFA values calculated solely from DDE data to those including both DDE and linear tensor encoding data (2-shell single diffusion encoding, SDE), to detect microstructural alterations in the spinal cords of MS and NMOSD patients in vivo.Methods:
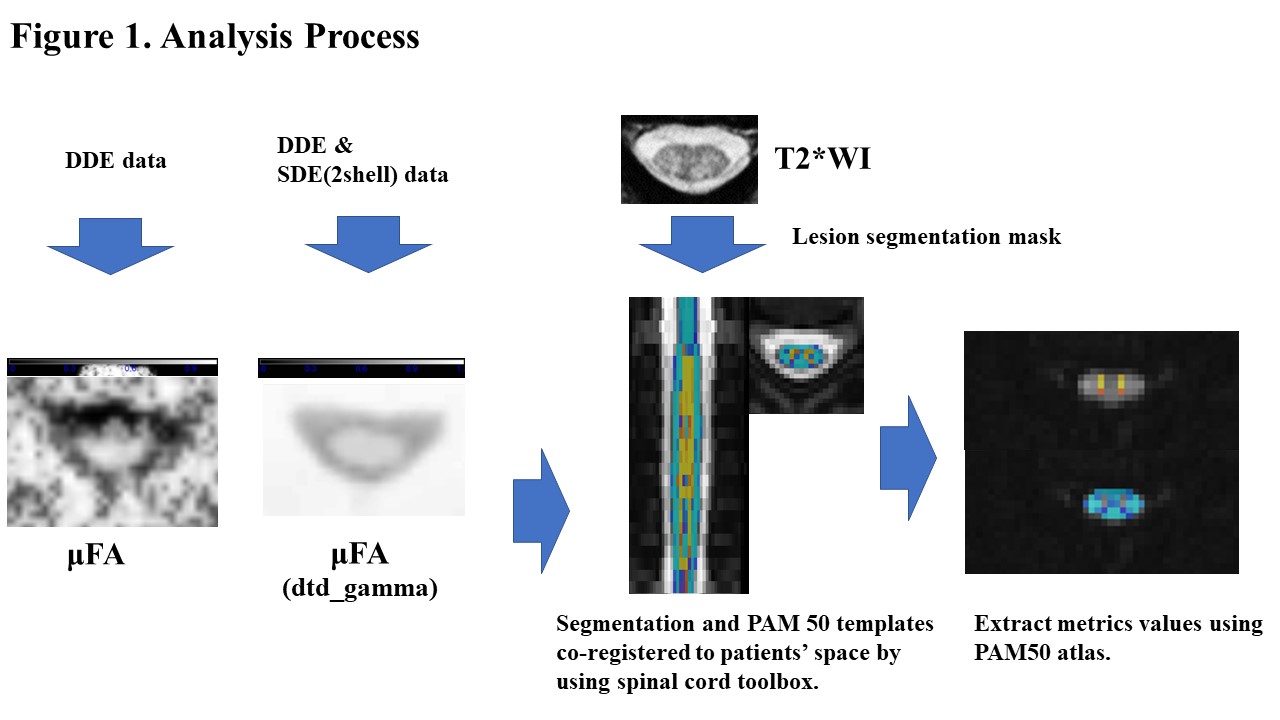
A total of 8 MS (age 51±11 years, 5 females; 7 RRMS, 1 SPMS, median EDSS score 1.25, disease duration range 9-30y) and 6 NMOSD patients (age 62±16 years, all females) were prospectively enrolled. Post conventional cervical spine MR imaging, DDE data was acquired, followed by 2-shell SDE imaging data on a Siemens Prisma 3T scanner. DDE data were acquired with the imaging parameters as follows: TR/echo time, 5200/84 (ms/ms); number of signals acquired, one; section thickness, 5 mm; 32 slices; in-plane pixel size, 1.23 x 1.23 mm; SMS factor, 2; imaging time, approximately 4 min; 2 b-values (500 and 500 s/mm2 for the first and second trains of MPG) with one b=0 image and diffusion encoding in 36 directions, based on a modified Jespersen’s protocol2. Imaging parameters for 2-shell SDE dMRI were as follows: repetition time (TR)/echo time: 2200/76 (ms/ms); section thickness: 5 mm; 39 slices; in-plane pixel size: 0.9x0.9 mm; SMS factor: 2; imaging time: approximately 12 min; 2 b values (1000 and 2000 s/mm2) with two b=0 images and diffusion encoding in 30 direction for every b value. All diffusion MRI data were transferred to an offline workstation, denoised6, and processed using Matlab (R2022a, Math Works, Inc, Natick, MA) to derive μFA parametric maps. The FA map from DDE data only was calculated using the theory presented in Ref 3. The μFA maps of combined DDE and SDE were also obtained7,8. Semi-automated analysis employing the Spinal Cord Toolbox9 was conducted for cord and lesion segmentation10, motion correction, NAWM and NAGM maps generation, registration to WM and GM atlas, and metrics extraction (Figure 1). Quantitative metrics in NAWM and NAGM at C2, C3, C4 and C5 were compared between MS and NMOSD. Statistical evaluations were carried out using in-house Python scripts that utilized NumPy, Pandas and Scipy, with P value <0.05 deemed statistically significant.Results:
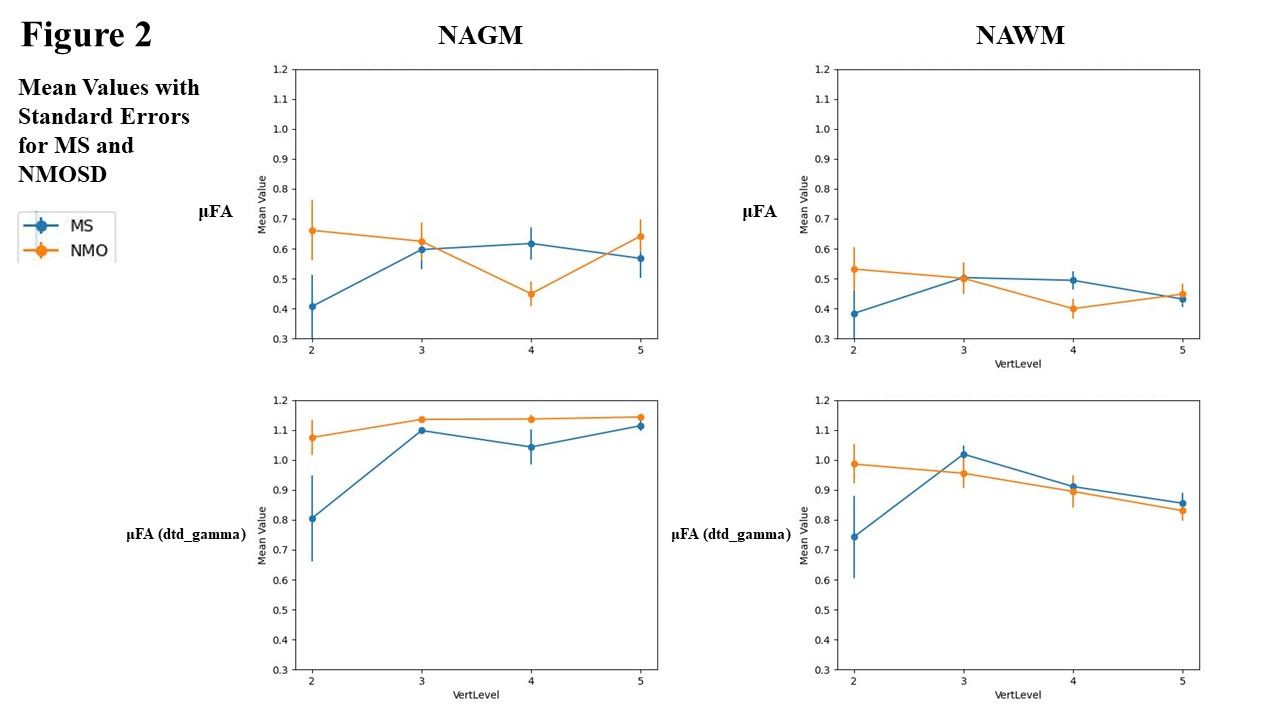
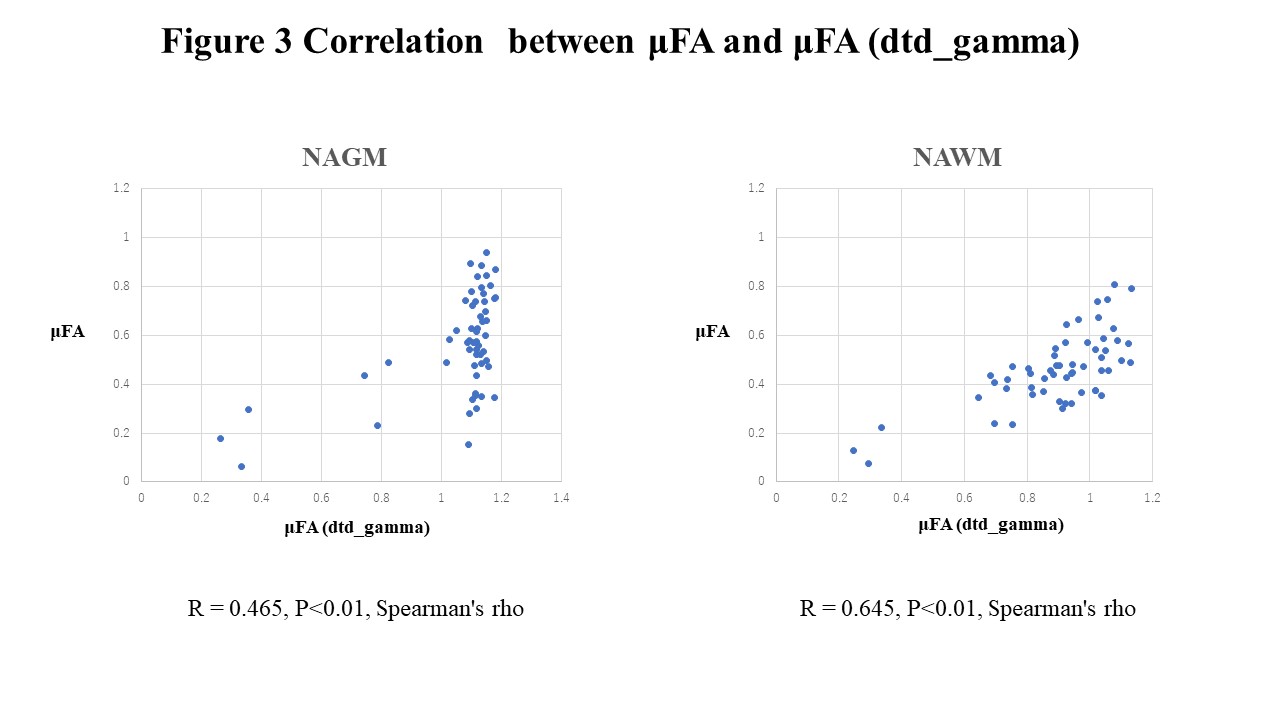
No significant differences in μFA were observed between MS and NMOSD. The addition of 2-shell SDE revealed areas where μFA exceeded 1, questioning the validity of these quantitative values. A strong correlation between μFA with and without SDE data in NAWM (r=0.645, P<0.01, Spearman's rho) and a moderate correlation in NAGM (r=0.465, P<0.01, Spearman's rho) were found (Figure 3).Discussion:
Previous research suggested that b-values of 1500-2000 s/mm² are needed in DDE to capture information unavailable in SDE11. However, b=1500 s/mm2 is challenging to achieve in DDE of the spinal cord due to scanner limitations. As a clinically viable alternative, we attempted to combine the SDE data with maximum b of 2000 s/mm2 data and the relative low b DDE for analysis. In our settings, including multi-b values SDE data did not improve the discrimination between MS and NMOSD but resulted in the increased voxels with spurious large uFA values. This study emphasizes the need for the optimization of b-tensor encoding protocol for the spinal cord, including methods such as Q-space trajectory imaging12, to ensure the validity of diffusion quantification values, taking into account both the scan technical limitation and characteristics of the spinal cord (relatively well-aligned, larger fiber bundles compared to the brain). The risk of clinically incorrect interpretation when plausible values are shown accentuates the importance of establishing appropriate and effective imaging protocols within the constraints of clinical imaging time.Acknowledgements
This work was supported by JSPS KAKENHI Grant Number 19K08161, the Canada Research Chair in Quantitative Magnetic Resonance Imaging [950-230815], the Canadian Institute of Health Research [CIHR FDN-143263], the Canada Foundation for Innovation [32454, 34824], the Fonds de Recherche du Québec - Santé [28826], the Fonds de Recherche du Québec - Nature et Technologies [2015-PR-182754], the Natural Sciences and Engineering Research Council of Canada [435897-2013], the Canada First Research Excellence Fund (IVADO and TransMedTech) and the Quebec BioImaging Network [5886].References
- Miki Y, et al.Relapsing-remitting multiple sclerosis: longitudinal analysis of MR images--lack of correlation between changes in T2 lesion volume and clinical findings. Radiology. 1999;213(2):395-9.
- Jespersen, Sune Nørhøj, et al. "Orientationally invariant metrics of apparent compartment eccentricity from double pulsed field gradient diffusion experiments." NMR in Biomedicine 26.12 (2013): 1647-1662.
- Yang, Grant, et al. "Double diffusion encoding MRI for the clinic." Magnetic resonance in medicine 80.2 (2018): 507-520.
- Szczepankiewicz F, et al. The link between diffusion MRI and tumor heterogeneity:Mapping cell eccentricity and density by diffusional variance decomposition (DIVIDE). Neuroimage. 2016 Nov 15;142:522-532.
- Nilsson M, et al. Tensor-valued diffusion MRI in under 3 minutes: an initial survey of microscopic anisotropy and tissue heterogeneity in intracranial tumors. Magn Reson Med. 2020 Feb;83(2):608-620.
- https://dipy.org/documentation/1.5.0/examples_built/denoise_mppca/#example-denoise-mppca
- https://github.com/daniel-topgaard/md-dmri
- S. Lasič, et al. Microanisotropy imaging: quantification of microscopic diffusion anisotropy and orientational order parameter by diffusion MRI with magic-angle spinning of the q-vector. Front. Physics 2014;2, 11.
- De Leener B,et al. SCT: Spinal Cord Toolbox, an open-source software for processing spinal cord MRI data. Neuroimage. 2017 Jan 15;145(Pt A):24-43.
- Gros C, et al. Automatic segmentation of the spinal cord and intramedullary multiple sclerosis lesions with convolutional neural networks. Neuroimage. 2019;184:901-915.
- Jespersen SN. Equivalence of double and single wave vector diffusion contrast at low diffusion weighting. NMR Biomed. 2012 Jun;25(6):813-8.
- Westin CF, et al. Q-space trajectory imaging for multidimensional diffusion MRI of the human brain. Neuroimage. 2016 Jul 15;135:345-62.
Figures