2511
Multi-parametric investigation of thalamic iron and neurotransmitter dyshomeostasis in multiple sclerosis patients with high disability1Buffalo Neuroimaging Analysis Center, Department of Neurology, Jacobs School of Medicine and Biomedical Sciences, University at Buffalo, The State University of New York, Buffalo, NY, United States, 2The Murdoch Institute for Advanced Spectronomics, Cleveland, OH, United States, 3Center for Biomedical Imaging, Clinical and Translational Science Institute, University at Buffalo, The State University of New York, Buffalo, NY, United States
Synopsis
Keywords: Multiple Sclerosis, Multiple Sclerosis, Advanced MS, QSM, HERMES, EDSS, Atrophy, Iron content, GABA, Thalamus
Motivation: Several studies found lower susceptibility in the thalamus of MS patients. Few of these studies have focused on an advanced MS disease stage.
Goal(s): To determine if iron and metabolite levels reflect inflammation-induced iron loss in the deep gray matter of patients with advanced MS.
Approach: 14 MS patients (EDSS scores >4.0, aged >40 years) and age- and sex-matched controls. We employed multi-echo GRE, Magnetization Transfer Ratio, and a HERMES sequence for edited GABA and glutathione (GSH) assessment in the thalamus.
Results: Reduced iron metrics and NAA findings were in line with our hypothesis of iron loss in the thalamus concomitant to neurodegeneration.
Impact: Using a combination of edited spectroscopy and MT, R2* and QSM, this study provides support for inflammation-related iron loss in the thalamus of patients with MS.
Introduction
Several imaging studies have indicated alterations in iron concentrations within the deep gray matter of individuals with multiple sclerosis (MS). Recent cross-sectional studies utilizing Quantitative Susceptibility Mapping (QSM) have reported reduced thalamus susceptibility in patients with longer disease duration1 and higher locomotive disability.2 The most likely explanation for these findings is a decrease in paramagnetic iron content in patients.In this prospective study, we hypothesized, based on these prior investigations, that advanced disease stages of MS are associated with simultaneous reductions in susceptibility and R2*, indicating decreased iron levels. Additionally, we anticipated that metabolite profiles would reflect neuronal loss and excitotoxicity resulting from iron release from cells.
Methods
Participants: This prospective study recruited 28 individuals, comprising 14 patients and age- and sex-matched controls. Patients met the McDonald criteria, had EDSS scores >4.0, and were aged >40 years. Exclusion criteria included recent steroid or immunomodulatory therapy within 30 days of MRI, alcohol consumption within 48 hours of MRI, immunosuppressant use within 6 months of MRI, participation in investigational drug trials or experimental procedures within 30 days of MRI, and valium/diazepam intake within 24 hours of MRI.Data acquisition: A 3T MRI (Canon Vantage Titan) was utilized, employing multi-echo GRE (matrix=328x256x70, 0.7x0.9x1.8 mm3, flip=14°; TR/TE1/DTE/nTE=30ms/4ms/2.5ms/10), Magnetization Transfer Ratio, and a HERMES4 sequence for edited GABA and glutathione (GSH) assessment in thalamus and somatosensory cortex (SMC) (TE/TR=80/1800ms; NEX=288; voxel size=27μl in thalamus).
Analysis: Magnetic susceptibility maps were reconstructed using best-path unwrapping5, LBV6-8, and HEIDI.9 A custom bimodal magnitude-QSM template10 with subcortical atlas labels was generated. QSM and MTR data were labeled using bimodal warp field computations (Python 3.0; ANTs) and referenced to the lateral ventricles. Iron content (mFe) was computed as previously described.11 HERMES time-domain data were frequency- and phase-aligned, and metabolite ratios were determined using LCModel.12 Basis sets were generated using actual pulse profiles and incorporated a macromolecule peak at 3.0 ppm (MM30) for GABA analysis.
Statistical analysis: We assessed sample distributions for normality and utilized inter-hemispheric means in the absence of inter-hemispheric differences. Group differences were analyzed through univariate ANCOVA, with sex and age as covariates. Interaction effects between disease, sex, and age were examined. The primary analysis centered on the thalamus, with additional analyses conducted in other subcortical regions.
Results
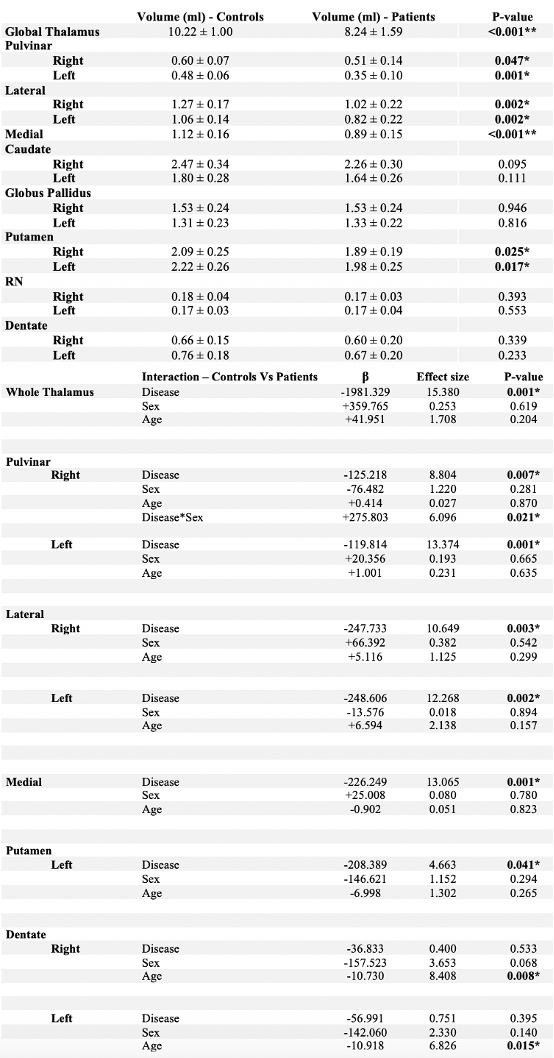
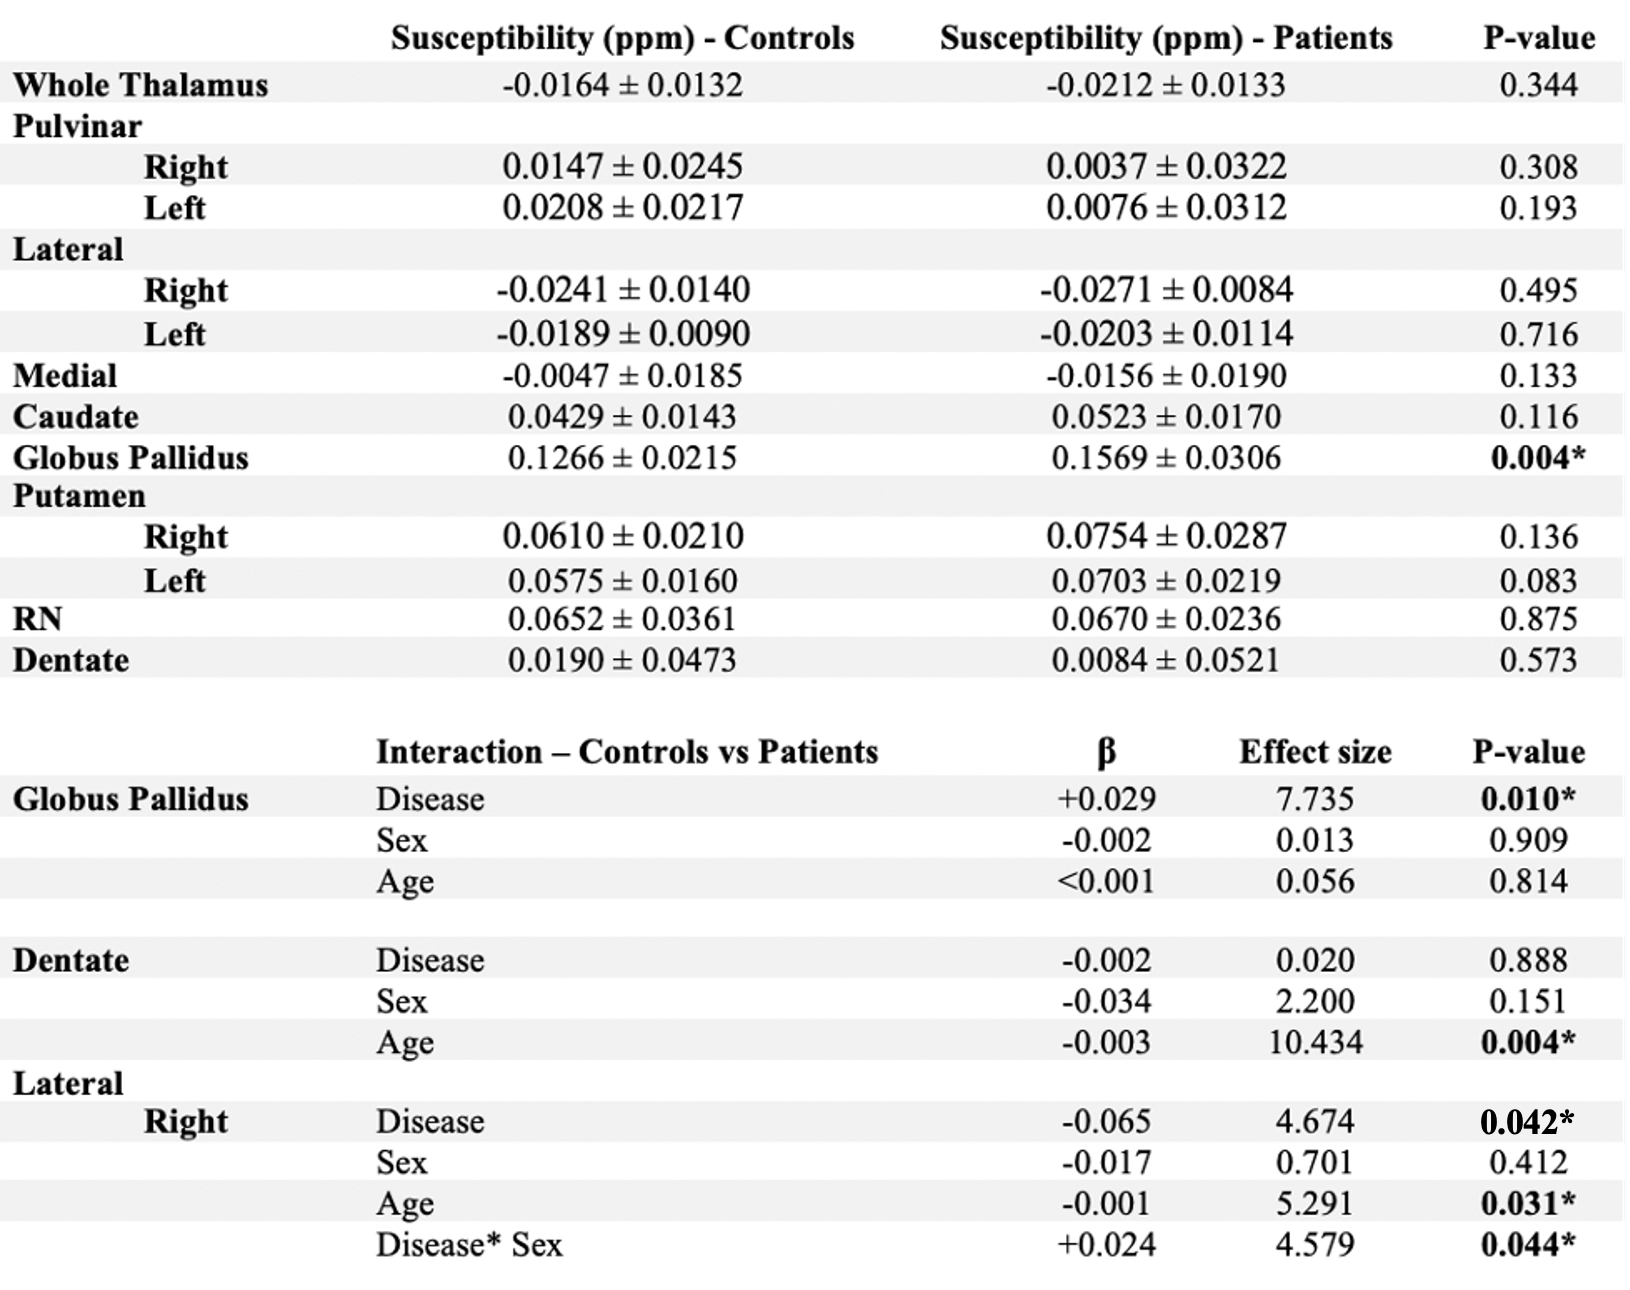
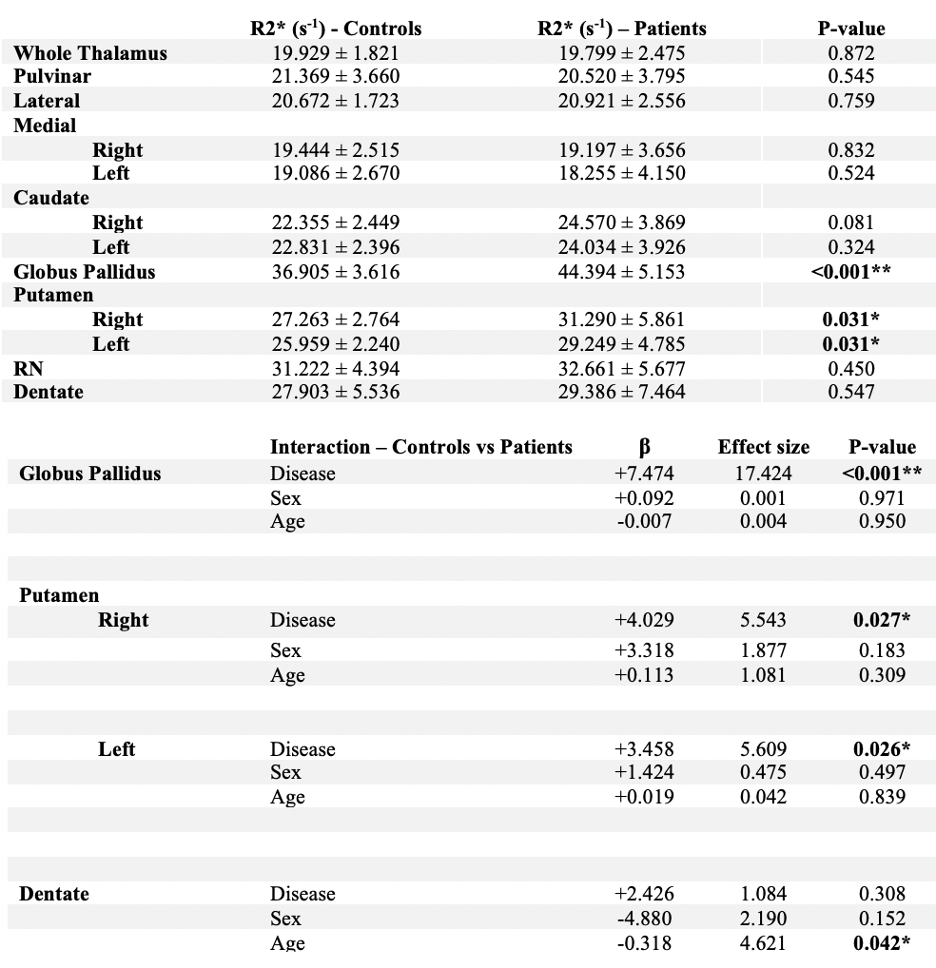
Patients (controls) had a mean age of 60.6±8.2 (58.4±8.0) years, and the female:male ratio was 24:4. As anticipated, patients exhibited significantly atrophied brain regions compared to controls (Table 1), including thalamic sub-regions (p≤0.007). This effect was influenced by sex, only in the right pulvinar (p=0.021).QSM and R2* revealed comparable changes (Tables 2, 3). Patients exhibited decreased susceptibility and R2* in most thalamic regions, although not statistically significant. In the right lateral region, susceptibility was reduced (p=0.042), and R2* was increased (non-significant). In contrast, both QSM and R2* were significantly higher in the GP of patients (p≤0.01), and R2* was higher in the putamen (p≤0.027).
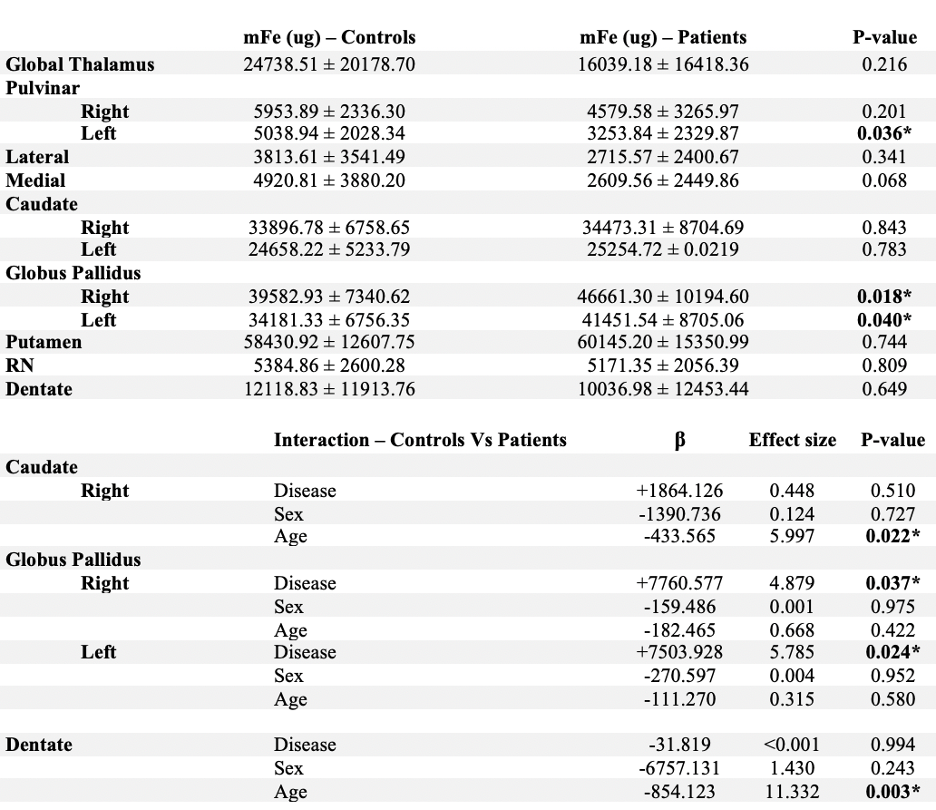
Iron content (mFe, Table 4) was reduced in all patient regions except GP, caudate, and putamen, reaching significance only for the higher GP value (p≤0.037).
Patients exhibited reduced thalamic tNAA/tCr (p=0.02) and co-edited MM30 signals (p=0.01), and increased GABA/tNAA (p=0.03; GABA/tCr p=0.098). Differences in the SMC did not reach significance, nor did any GSH levels.
Discussion
Findings of reduced iron metrics and NAA were in line with our hypothesis of iron loss in the thalamus concomitant to neurodegeneration. Additionally, increased iron metrics in other DGM regions were in line with the previous RRMS findings.2However, iron metrics did not reach significance in many regions, likely due to a higher variation in our data compared to previous studies.1 The reason for the increased variations remains unclear but may be related to differences in acquisition techniques and advanced disease progression.
Increased GABA had previously been found in cortical regions13, and our study is the first report of increased thalamic GABA in MS. The finding is in line with increased immune response in this region, which has previously been speculated to be related to iron loss.14,15 MM30 corresponds to lysine residues16, changes in which may reflect myelin pathology.15
Conclusion
This study provides further support for inflammation-related iron loss in the thalamus of patients with MS.Acknowledgements
Research reported in this publication was funded by The Dana Foundation and by an equipment grant from Canon Medical Systems Corporation and Canon Medical Research USA, Inc. It was partially supported by the National Institute of Neurological Disorders and Stroke of the National Institutes of Health under Award Number R01NS114227 and by the National Center for Advancing Translational Sciences of the National Institutes of Health under Award Number UL1TR001412. The content is solely the responsibility of the authors and does not necessarily represent the official views of the National Institutes of Health or any of the funding agencies.References
[1] Schweser, Ferdinand, et al. “Mapping of thalamic magnetic susceptibility in multiple sclerosis indicates decreasing iron with disease duration: A proposed mechanistic relationship between inflammation and oligodendrocyte vitality.” Neuroimage, Vol. 167, 15 February 2018, pp. 438-452., 10.1016/j.neuroimage.2017.10.063
[2] Zivadinov, Robert, et al. “Brain Iron at Quantitative MRI Is Associated with Disability in Multiple Sclerosis.” Radiology, vol. 289, no. 2, 17 July 2018, pp. 487–496., 10.1148/radiol.2018180136.
[3] Hernández‐Torres, E. et al. Increased mean R2* in the deep gray matter of multiple sclerosis patients: Have we been measuring atrophy? J. Magn. Reson. Imaging 50, 201–208 (2019).
[4] Saleh, Muhammad G, et al. “Simultaneous editing of GABA and glutathione at 7T using semi-LASER localization.” Magn Reson Med . 2018 Aug; pp. 474-479., 10.1002/mrm.27044.
[5] H. S. Abdul-Rahman, M. A. Gdeisat, D. R. Burton, M. J. Lalor, F. Lilley, and C. J. Moore, “Fast and robust three-dimensional best path phase unwrapping algorithm.” Appl Opt, 46(26):6623–35, 2007.
[6] F. Schweser, A. Deistung, B. W. Lehr, and J. R. Reichenbach, “Quantitative imaging of intrinsic magnetic tissue properties using MRI signal phase: An approach to in vivo brain iron metabolism?” NeuroImage, 54(4):2789–2807, 2011.
[7] P. S. Özbay, A. Deistung, X. Feng, D. Nanz, J. R. Reichenbach, and F. Schweser, “A comprehensive numerical analysis of background phase correction with V- SHARP,” NMR Biomed (epub)
[8] B. Wu, W. Li, A. Guidon, and C. Liu, “Whole brain susceptibility mapping using compressed sensing.” Magn Reson Med, 24:1129–36, 2011.
[9] F. Schweser, K. Sommer, A. Deistung, and J. R. Reichenbach, “Quantitative susceptibility mapping for investigating subtle susceptibility variations in the human brain.” NeuroImage, 62(3):2083–2100, 2012.
[10] J. Hanspach, M. G Dwyer, N. P Bergsland, X. Feng, J. Hagemeier , N. Bertolino, P. Polak , J. R Reichenbach, R. Zivadinov and F. Schweser “Methods for the computation of templates from quantitative magnetic susceptibility maps (QSM): Toward improved atlas- and voxel-based analyses (VBA)”, J Magn Reson Imaging 2017 Nov; 46(5):1474-1484., 10.1002/jmri.25671. Epub 2017 Mar 6.
[11] Schweser, F. et al. Decreasing Brain Iron in Multiple Sclerosis: The Difference between Concentration and Content in Iron MRI. Hum Brain Mapp (in press).
[12] Provencher, S.W., “Estimation of Metabolite Concentrations from Localized in Vivo Proton NMR Spectra.” Magn Reson Med, 30:672-679, 1993.
[13] Nantes, Julia C, Sébastien Proulx, Jidan Zhong, Scott A Holmes, Sridar Narayanan, A Robert, Richard D Hoge, and Lisa Koski. “GABA and Glutamate Levels Correlate with MTR and Clinical Disability: Insights from Multiple Sclerosis.” NeuroImage, 2017., 10.1016/j.neuroimage.2017.01.033.
[14] Schweser, F. et al. Mapping of thalamic magnetic susceptibility in multiple sclerosis indicates decreasing iron with disease duration: A proposed mechanistic relationship between inflammation and oligodendrocyte vitality. NeuroImage 167, 438–452 (2018).
[15] Bhat, R., Axtell, R., Mitra, A., Miranda, M., Lock, C., Tsien, R.W., Steinman, L., 2010. Inhibitory role for GABA in autoimmune inflammation. Proc. Natl. Acad. Sci. USA 107, 2580–2585.
[16] Cudalbu, C. et al, “Contribution of macromolecules to brain 1H MR spectra: Experts' consensus recommendations.” NMR Biomed. 2021;34:e4393.
[17] Lillico, Ryan, Ting Zhou, Tina Khorshid Ahmad, Nicholas Stesco, Kiana Gozda, Jessica Truong, Jiming Kong, Ted M. Lakowski, and Michael Namaka. “Increased Post-Translational Lysine Acetylation of Myelin Basic Protein Is Associated with Peak Neurological Disability in a Mouse Experimental Autoimmune Encephalomyelitis Model of Multiple Sclerosis.” Journal of Proteome Research 17, no. 1 2018 Jan: 55–62., 10.1021/acs.jproteome.7b00270.
Figures