2506
Rim Lesion Segmentation on 1MM QSM Positive Source : a Comparison between Deep Learning and Conventional Methods.
Ha Manh Luu1, Susan Gauthier1, Ilhami Kovanlikaya1, Yi Wang1, Pascal Spincemaille1, Mert Sisman1, and Thanh Nguyen1
1Weill Cornell Medicine, New York, NY, United States
1Weill Cornell Medicine, New York, NY, United States
Synopsis
Keywords: Neuroinflammation, Segmentation
Motivation: To automate rim lesion segmentation in multiple sclerosis
Goal(s): To compare deep learning and conventional methods for rim lesion segmentation in multiple sclerosis
Approach: We compare Unet with chan-vese and Grabcut segmention of MR rim positive lesions.
Results: Deep learning achieve the highest Dice score among the compared methods.
Impact: Automate rim lesion segmentation in Multiple Sclerosis may allow determine those patient with persistent inflammation.
Introduction
Rim lesions in multiple sclerosis (MS) are formed by iron-laden activated microglia and macrophage1,2, and characterized by hyperintense rim appearance on quantitative susceptibility mapping (QSM)1.These lesions associate to larger tissue damage compared to those without rim3 and worse clinical outcomes4,5. Currently, quantitative susceptibility source separation method6, which can separate positive (iron) and negative (myelin) sources QSM, has yielded an improvement of Rim contrast7. Manual rim segmentation is tedious and infeasible in clinical practice. Computer-aided methods may have great potential for this purpose. However, the low-varying contrast and complex morphology of rim lesions lead the segmentation to remain challenging.Material and Methods
The patient cohort was composed of nine teen multiple sclerosis patients. Each subject was scanned on a clinical 3T MRI platform (Magnetom Skyra, Siemens, Erlangen, Germany) using a 20-channel head/neck coil. The imaging protocol included two 3D mGRE acquisitions and 1mm T2FLAIR (FLAIR). 1mm QSMp was reconstructed from complex GRE images using morphology-enabled dipole inversion method with global CSF referencing (MEDI+0)7. R2*-based susceptibility source separation 9 was used in QSMp reconstruction. 1MM QSMp has resolution of 0.375x0.375x1 mm3. A reader with more than 25 years of experience (IK) identifies rim 1MM QSMp with the following criteria: 1) An axial slice presents with more than 50% of a circle of rim lesion; and 2) at least 2 slices containing rims which can be observer on either Sagittal plain or Coronal plain. Among the MS lesions, eighty-five rims were identified. MS lesion masks were first automatically segmented on FLAIR image using AllNet10. Subsequently, confluent lesions on FLAIR image were manually separated by a technician (HL). The lesion masks were further utilized as ROI of the rim lesion on QSMp. Rim segmentation ground truth were manually segmented by the technician and then verified/corrected by the clinical expert. FLAIR and its corresponding label was registered to QSMp space using FSL rigid registration method []. To reduce the image redundancy, each MS lesion on 1MM QSMp image was clipped into an image patch of 64x64x24. We implemented the rim lesion segmentation using three well-known frameworks: nnUNet-3D [ref], Grabcut [ref], and Chan-and-Vese - levelset. Both Grabcut and Chan-and-Vese levelset used the FLAIR lesion mask as ROI for computing the energy functions.Results
The nnUNet-3D was configured in 3D full resolution mode, 1000 epoch for training. All the hyperparameters and other setting were used as default. Grabcut was initialized with the ford ground seed of higher 50% of the maximum intensity of 1MM QSMp in the ROI while the background seed was set by thresholding of 15% of the maximum intensity. The level set was initialized with the threshold of the 50% to ensure the inner region cover the rim part. The level set stop when its energy was convergenced or at 150 iterations. We used 52 rim lesions from 11 subjects were used to train the network. All of the three methods were tested using 33 rim lesions form 8 subjects. nnUnet-3D obtained a mean Dice score of 0.666 while Grabcut and Chan-and-Vese levelset achieved a mean Dice score of 0.247 and 0.39. (Figure 3) The p-values (paired t-Test of the dice scores of nnUnet-3D vs Grabcut and Chan-and-Vese level set) of smaller than 10-5 suggests that the performance of nnUNet is statistically significant different to that of the other methods. A example of Rim segmentation by the methods is illustrated on Figure 2.Conclusion
We found that nnUnet performs the best among the three methods for Rim segmentation on QSMp images. Our results support further investigation and use deep learning to segment the rim on QSMp in MS patients.Acknowledgements
No acknowledgement found.References
- Gillen KM, Mubarak M, Park C, et al. QSM is an imaging biomarker for chronic glial activation in multiple sclerosis lesions. Ann Clin Transl Neurol 2021;8:877-86.
- Hametner S, Wimmer I, Haider L, Pfeifenbring S, Bruck W, Lassmann H. Iron and neurodegeneration in the multiple sclerosis brain. Ann Neurol 2013;74:848-61. 3.
- Yao Y, Nguyen TD, Pandya S, et al. Combining quantitative susceptibility mapping with automatic zero reference (QSM0) and myelin water fraction imaging to quantify iron-related myelin damage in chronic active MS lesions. AJNR Am J Neuroradiol 2018;39:303-10. 4.
- Absinta M, Sati P, Masuzzo F, et al. Association of chronic active multiple sclerosis lesions with disability in vivo. JAMA Neurol 2019;76:1474-83. 5. Huang W, Sweeney EM, Kaunzner UW, Wang Y, Gauthier SA, Nguyen TD. Quantitative susceptibility mapping versus phase imaging to identify multiple sclerosis iron rim lesions with demyelination. J Neuroimaging. 2022 Jul;32(4):667-675. 6.
- Dimov, A. V., T. D. Nguyen, P. Spincemaille, E. M. Sweeney, N. Zinger, I. Kovanlikaya, B. H. Kopell, S. A. Gauthier, and Y. Wang. "Global Cerebrospinal Fluid as a Zero-Reference Regularization for Brain Quantitative Susceptibility Mapping." J Neuroimaging (2021).
- 7. 8.
- Luu H, Gauthier S, Kovanlikaya I, Wang Y, Spincemaille P, Sisman M and Nguyen T. “Quantitative susceptibility source separation improves the performance in the identification of chronic active multiple sclerosis lesions using deep learning-based method”. Whatever (2023). 9.
- Dimov, A. V., T. D. Nguyen, K. M. Gillen, M. Marcille, P. Spincemaille, D. Pitt, S. A. Gauthier, and Y. Wang. "Susceptibility Source Separation from Gradient Echo Data Using Magnitude Decay Modeling." J Neuroimaging (2022). 10.
- Zhang H, Zhang J, Li C, Sweeney EM, Spincemaille P, Nguyen TD, Gauthier SA, Wang Y, Marcille M. ALL-Net: Anatomical information lesion-wise loss function integrated into neural network for multiple sclerosis lesion segmentation. Neuroimage Clin. 2021;32:102854
- Isensee F, Jaeger PF, Kohl SAA, Petersen J, Maier-Hein KH. nnU-Net: a self-configuring method for deep learning-based biomedical image segmentation. Nat Methods. 2021 Feb;18(2):203-211.
- Chan TF, Vese LA. Active contours without edges. IEEE Trans Image Process. 2001;10(2):266-77. doi: 10.1109/83.902291. PMID: 18249617.
Figures
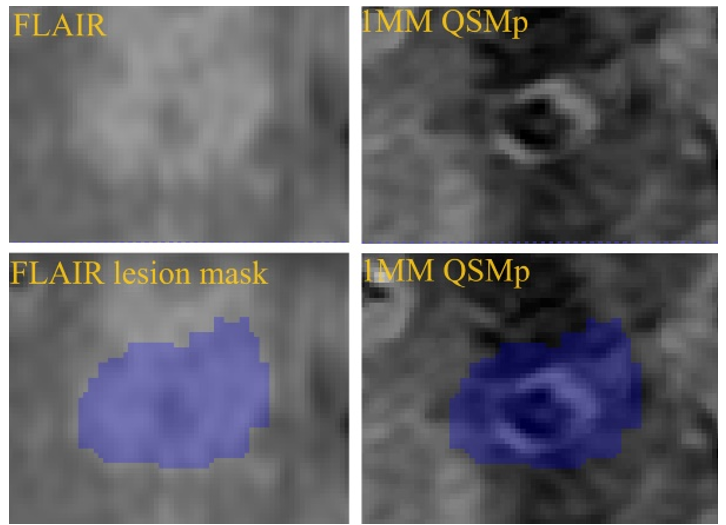
Example
of Rim lesion on 1MM QSMp with the corresponding FLAIR lesion. Also shown are
the lesion mask required for Grabcut and Chan-and-Vese levelset method.
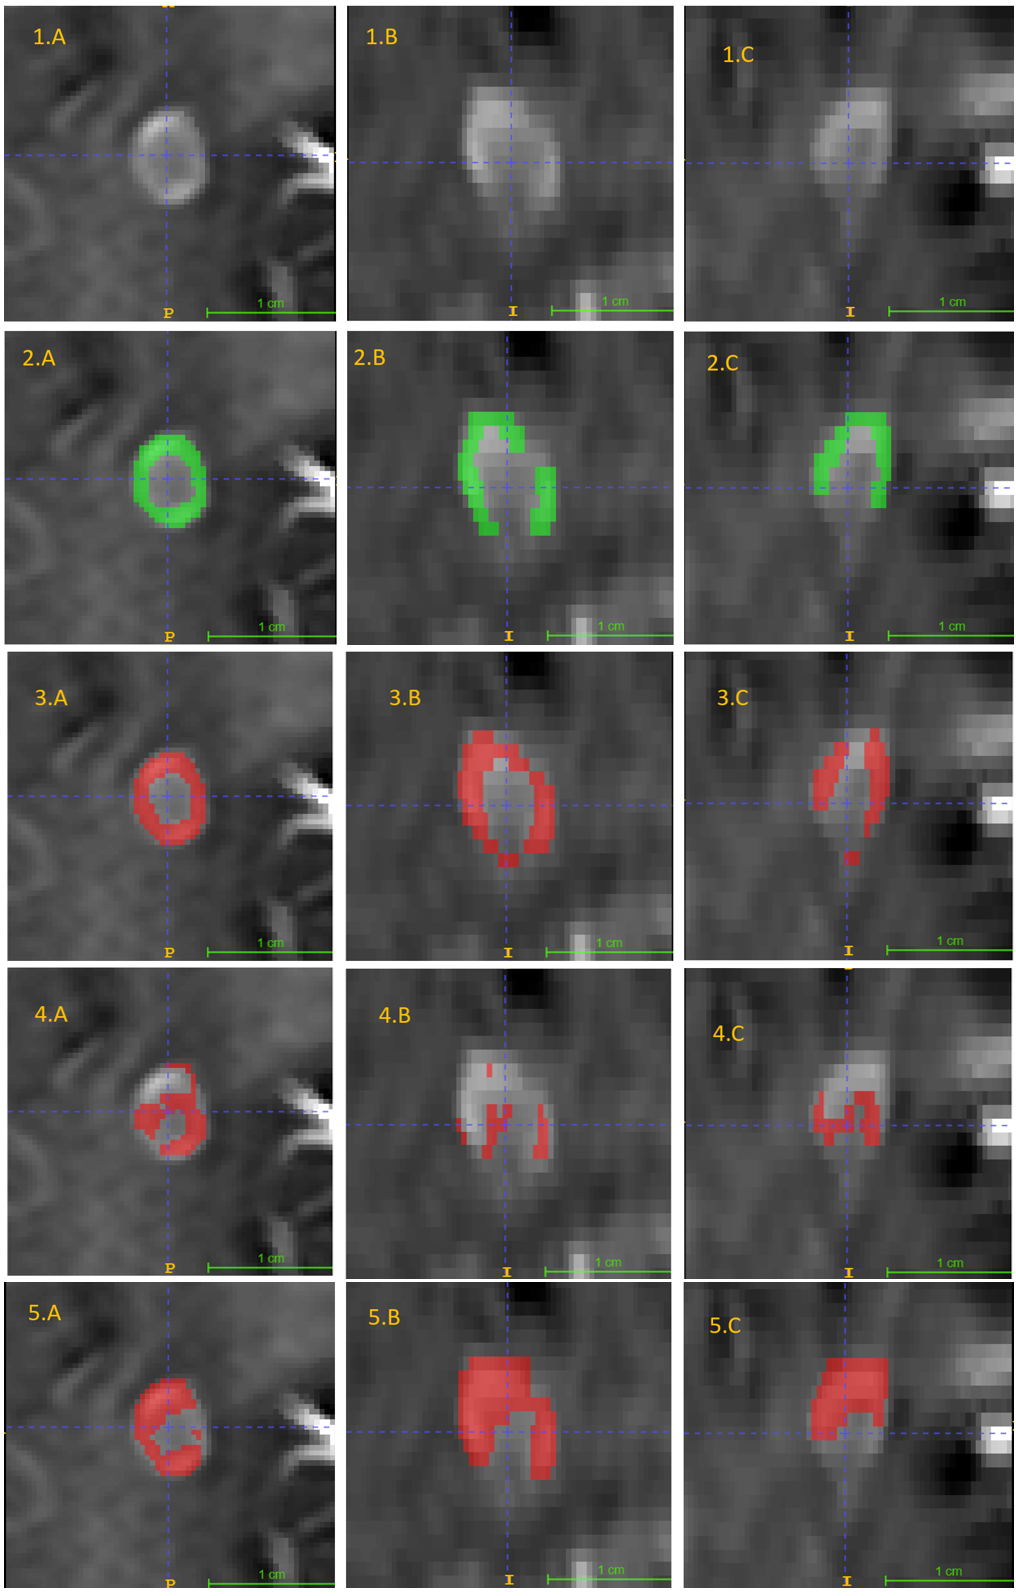
Example
of Rim lesion segmentation on QSMp; The first row is QSMp image, the 2nd row is manual segmentation; the 3rd
row is segmentation by nnUNet-3D; The 4th row is segmentation by
Grabcut and the last row is segmentation by Chan-and-Vese levelset. The 1st column is axial view, the 2nd
column is Sagittal view and the 3rd round is Coronal view.
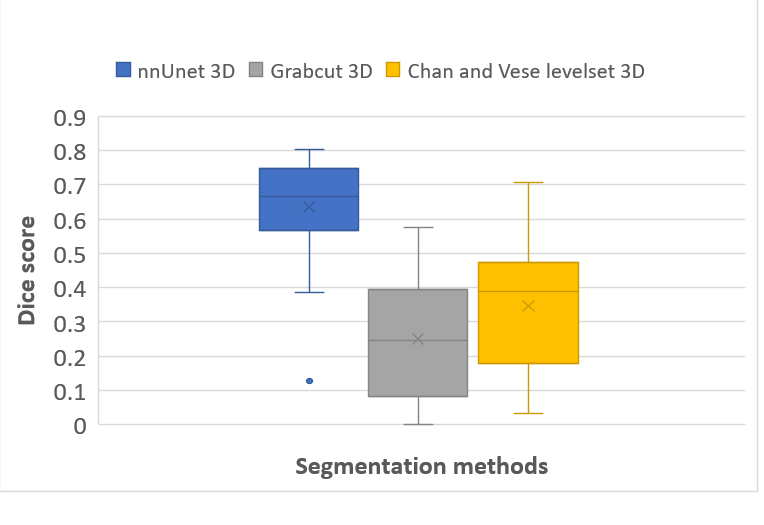
Rim segmentation performance of nnUnet-3D, Grabcut-3D and
Chan-and-Vese level set-3D.
DOI: https://doi.org/10.58530/2024/2506