2505
Targeted MRI (tMRI) of Small Changes in the T1 of White Matter of the Brain in Methamphetamine Dependency Before and After Abstinence.1Mātai Medical Research Institute, Gisborne, New Zealand, 2The University of Auckland, Auckland, New Zealand, 3Auckland Bioengineering Institute, Auckland, New Zealand, 4Manaaki Moves, Gisborne, New Zealand, 5University of California San Diego, San Diego, CA, United States
Synopsis
Keywords: Neuroinflammation, Drugs, tMRI, Methamphetamine recovery, WM recovery
Motivation: Targeted MRI (tMRI) of small changes in T1 in lesions in normal appearing white matter using divided Subtracted Inversion Recovery (dSIR) sequences can show high contrast and abnormalities that are not seen with conventional IR sequences.
Goal(s): To depict subtle changes in T1 in otherwise normal appearing white matter with dSIR images.
Approach: Applying tMRI in a patient with methamphetamine dependency before and eight months after abstinence.
Results: Widespread abnormalities on dSIR images in areas of normal appearing WM n T2-FLAIR images. There was striking remission of the changes after eight months' abstinence. The changes may be due to neuroinflammation regression with abstinence.
Impact: In a patient with methamphetamine dependency, tMRI using dSIR sequences showed striking abnormalities in white matter that appeared normal with T2-FLAIR sequences of the brain. These changes showed marked regression after eight months' abstinence.
Background
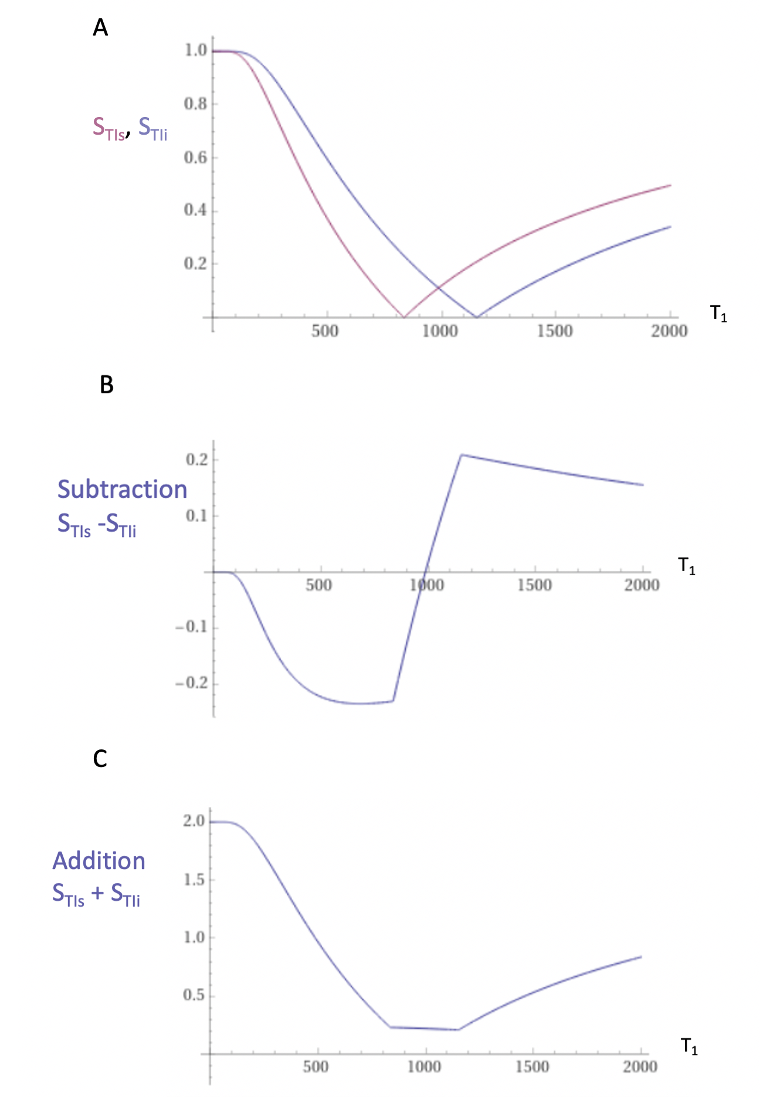
The commonest finding with clinical MRI of the brain in methamphetamine addiction is white matter hyperintensities which are non-specific and only present in a minority of patients1-3. There is pathological evidence of neuroinflammation in the brain of methamphetamine addicts4. This may cause small increases in T1 and/or T2 in white matter of the brain but conventional sequences may not be sensitive enough to produce recognizable contrast from them. To address this, a divided Subtracted Inversion Recovery (dSIR) sequence was implemented since this sequence can increase the contrast produced by small changes in T1 by ten times5,6 and could therefore reveal abnormalities not apparent with conventional sequences. The mechanism underlying dSIR sequence contrast is shown in Figures 1 and 2.Two magnitude reconstructed inversion (IR) T1-filters with different TIs (TIshort = TIs and TI intermediate = TIi) are shown in Figure 1A. They are subtracted to give the Subtracted IR (SIR) T1-filter in Figure 1B. This T1-filter is steep in the X axis region between the two nulling TIs of the T1-filters (i.e. TIs and TIi) shown in Figure 1A, i.e., in the middle Domain (mD). The two T1-filters in Figure 1A can also be added as an Added AIR T1-filter which is shown in Figure 1C.Within the mD of the AIR T1-filter there is a low signal.
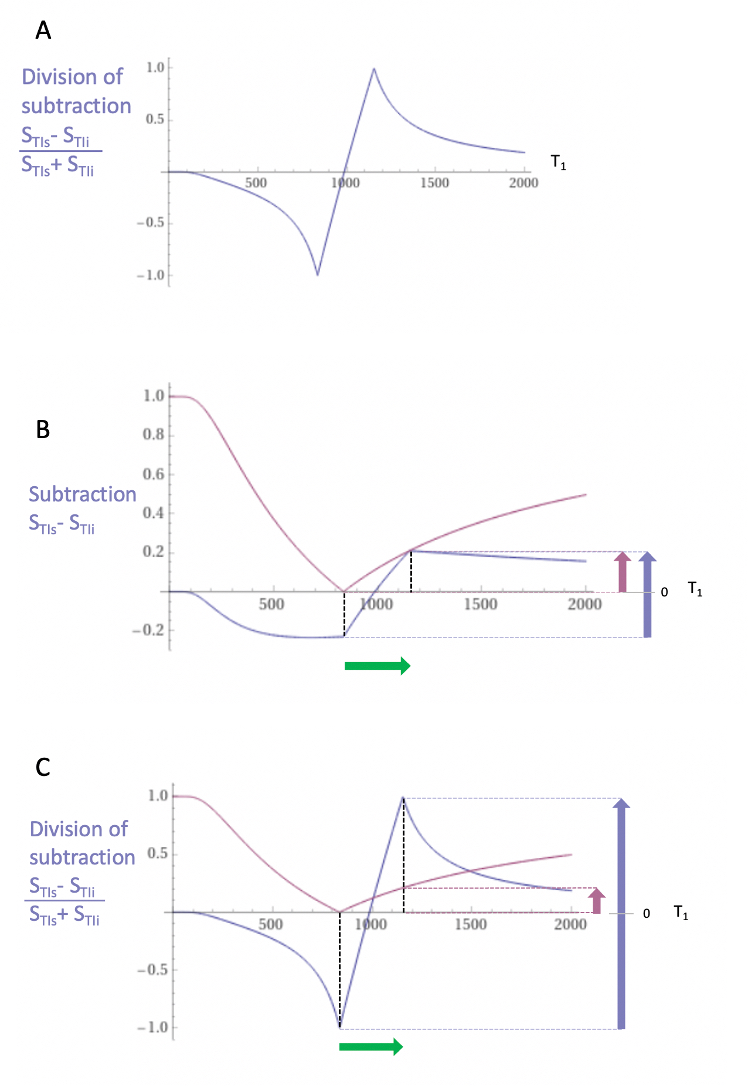
Figure 2A shows the divided subtracted IR (dSIR) T1-bipolar filter in which the SIR T1-filter in Figure 2B is divided by the AIR T1-filter in Figure 2C. It shows a highly positive nearly linear slope in its mD.
Figure 2B compares the contrast (difference in signal) produced by the STIs T1-filter (pink) which is that of a conventional IR sequence such as MP-RAGE, to the contrast produced by a SIR T1-filter (blue) from the same increase in T1 (horizontal green arrow). The vertical arrows on the right show that the contrast produced by the SIR T1-filter (blue) is double that produced by the STIs T1-filter (pink).
Figure 2C compares the contrast produced by the STIs T1-filter, (pink) to that from the dSIR T1-bipolar filter (blue) from the same increase in T1 (horizontal green arrow). The dSIR T1-bipolar filter generates ten times more contrast (blue arrow on the right) than the STIs T1-filter (pink arrow on right).
Methods
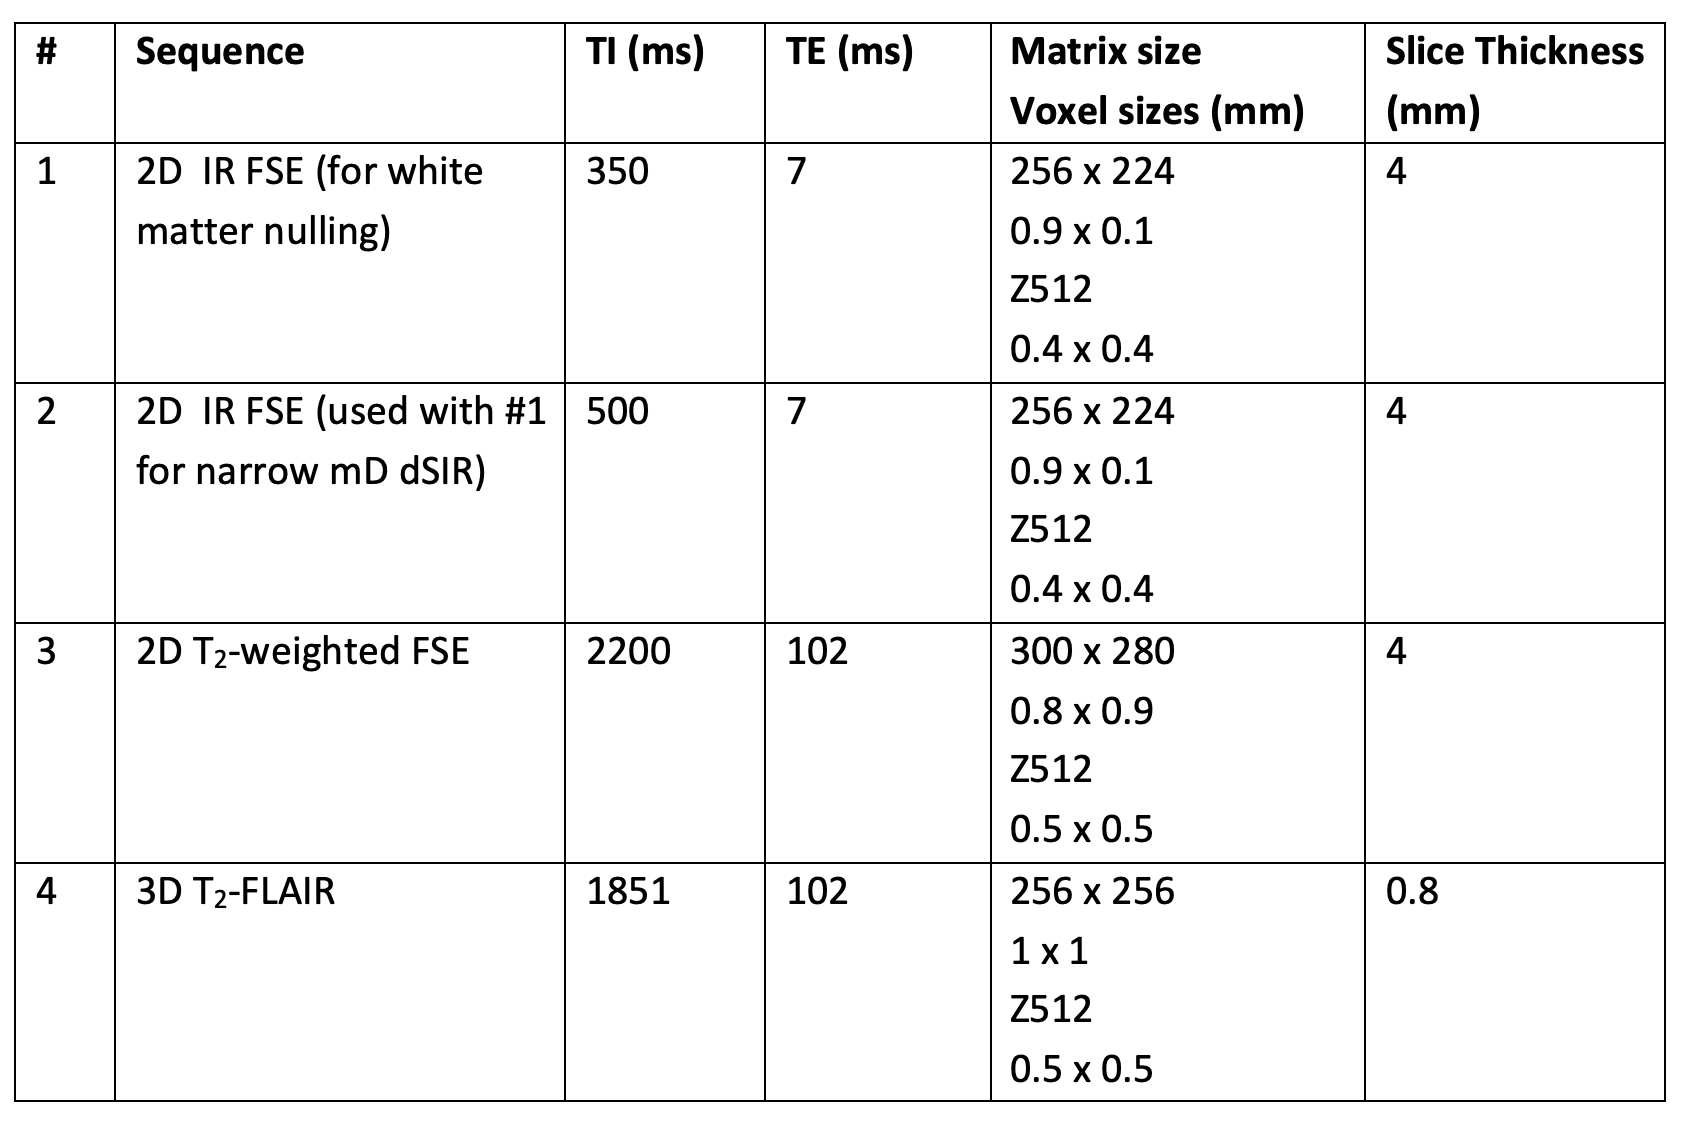
With approval from the New Zealand Health and Disability Ethics Committee (2022 EXP 11360), a 49 y/o male normal control matched for age, gender, ethnicity and socioeconomic status, and a 51 y/o male patient with a long history of methamphetamine dependency were scanned on a 3T scanner (SIGNA Premier; General Electric Healthcare, Milwaukee, WI). 2D dSIR-Fast Spin Echo sequences were performed with a TIs chosen to null normal white matter and a longer TIi chosen to produce narrow mD dSIR images targeted at small increases in T1 from normal in white matter, as illustrated in Figure 2C. Positionally matched T2-wFSE and T2-FLAIR images were acquired for comparison (Table 1). The patient was examined before abstinence and after eight months' abstinence.Results
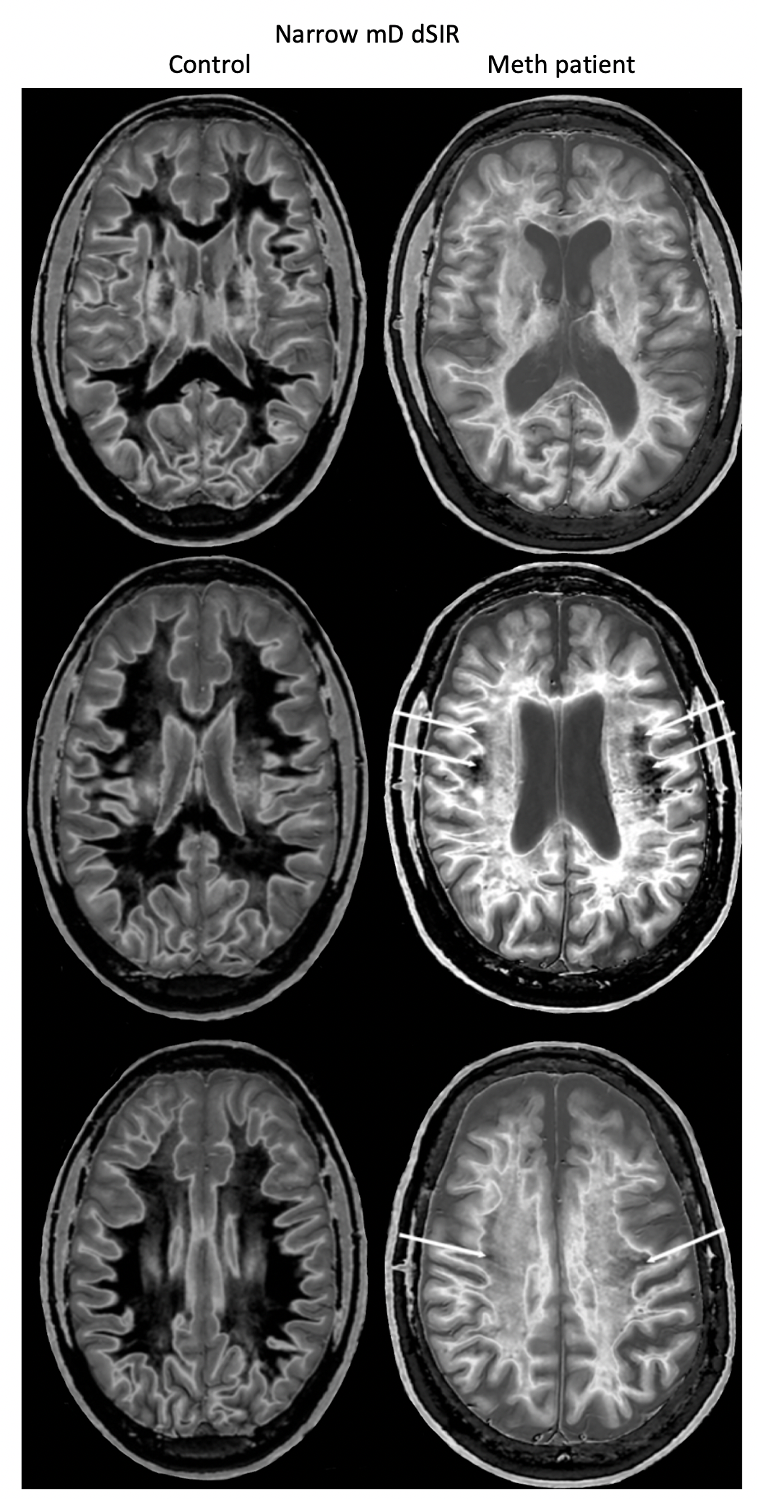
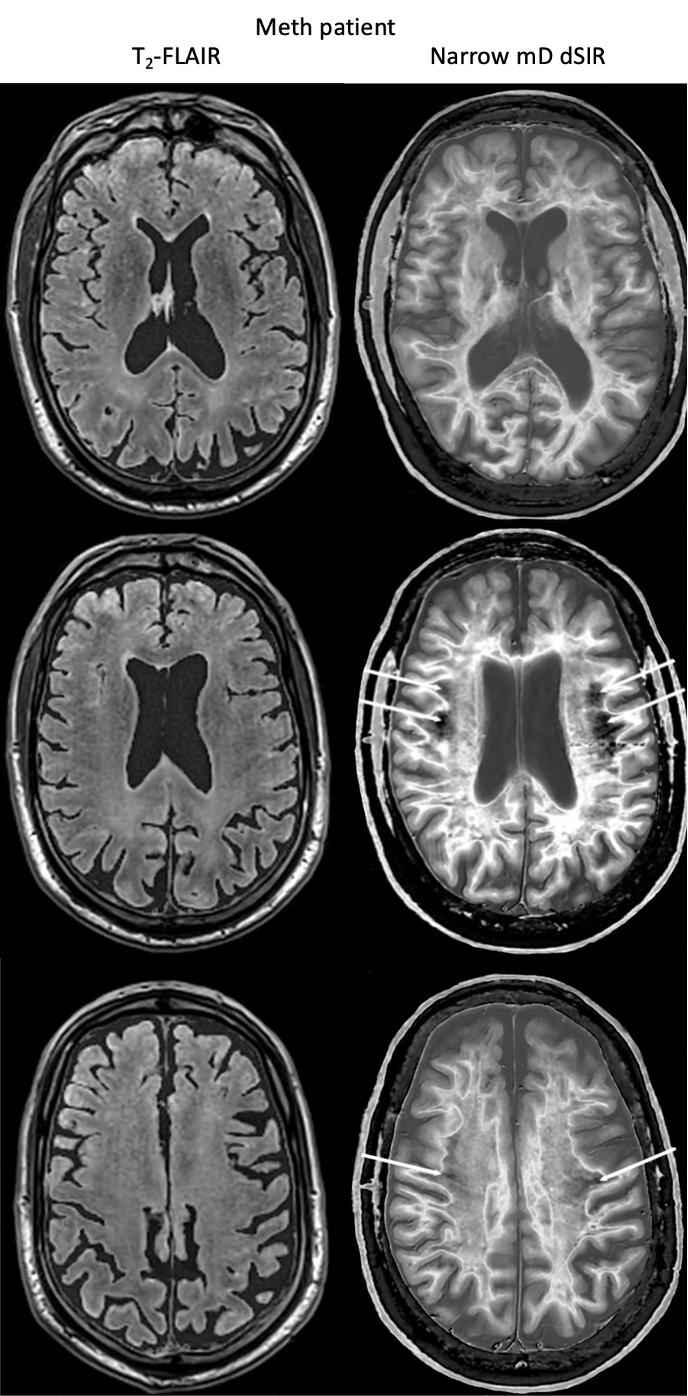
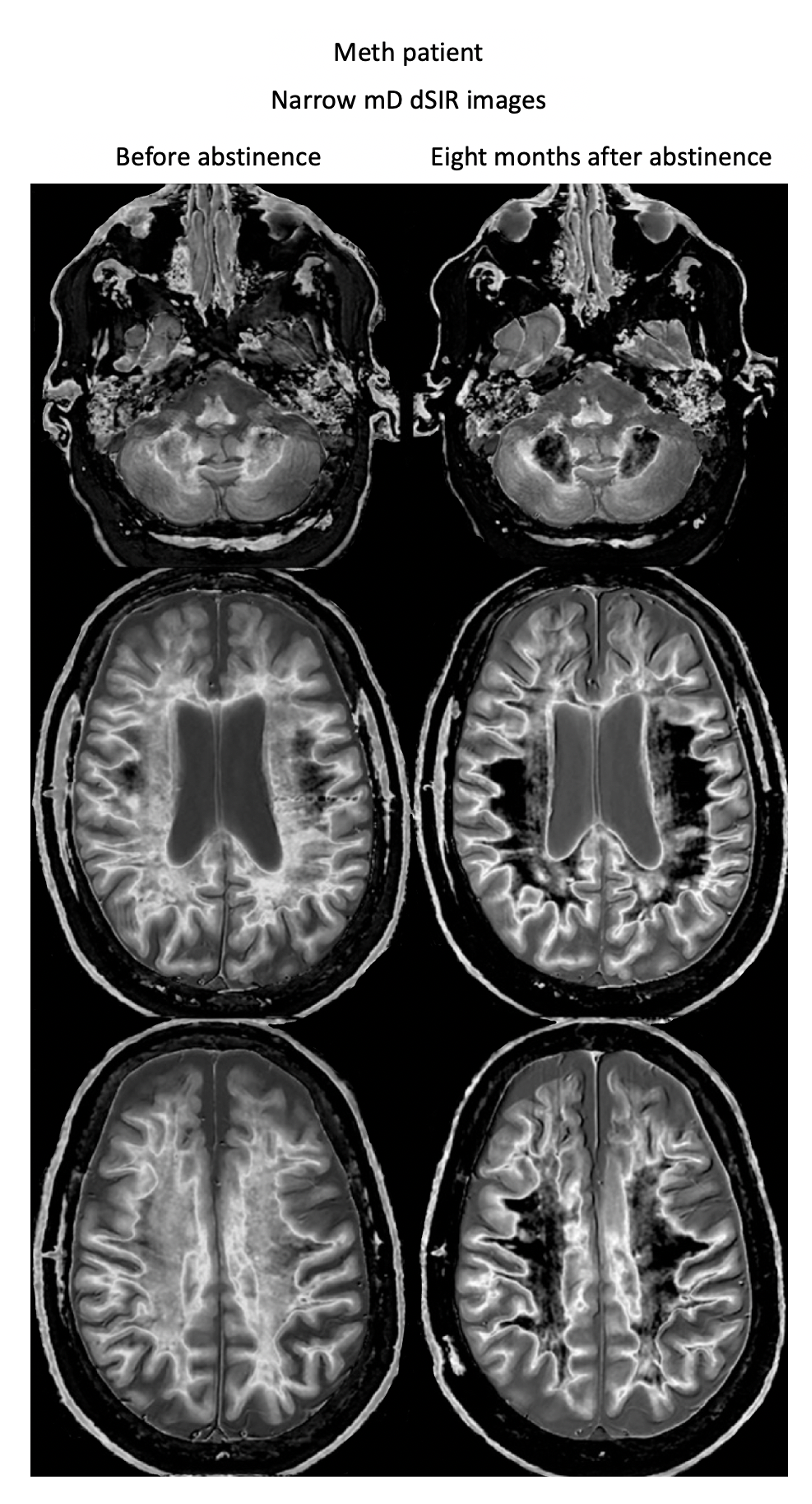
Figure 3 (left column) shows narrow mD dSIR images in the normal control. More peripheral normal white matter appears dark and the more central normal white matter of the superior longitudinal fasciculi appears mid-gray with an antero-posterior gradation of increased signal. Figure 3 (right column) shows narrow mD dSIR images from the patient. There are extensive areas of high signal with white matter with only small areas of normal dark white matter (white arrows). Figure 4 compares T2-FLAIR images (left column) with matched narrow mD dSIR images (right column) in the patient. No abnormality is seen in the white matter on the T2-FLAIR images (left column) but extensive high signal abnormalities are seen in white matter on the narrow mD dSIR images. Small areas of normal white matter with a dark appearance are shown by the white arrows (right column). Figure 5 shows narrow mD dSIR images in the patient before abstinence (left column) and after eight months' abstinence (right column). There is extensive reduction in the extent of the high signal abnormalities in white matter on the dSIR images at all three levels consistent with marked disease regression (right column).Discussion
The most likely cause of the changes in white matter is neuroinflammation induced by methamphetamine and possibly other chemicals associated with its illicit preparation7,8. The regression after abstinence supports neuroinflammation as the dominant pathological process, rather than gliosis or neurodegeneration which may not be reversible. tMRI using dSIR sequences could revolutionize the diagnosis of brain changes in methamphetamine dependency.Acknowledgements
We would like to acknowledge support from the Fred Lewis Enterprise Foundation, Manaaki Moves Trust, and Kānoa New Zealand. We are also grateful for support from the people of Tairāwhite, GE Healthcare and Mātai Ngā Māngai Māori.References
1. Bae SC, Lyoo IK, Sung YH, Yoo J, Chung A, Yoon S-J, et al. Increased white matter hyperintensities in male methamphetamine abusers. Drug and Alcohol Dependence 2006;81(1):83-88.
2. Alaee A, Zarghami M, Farnia S, Khodemloo M, Khoddad T. Comparison of brain white matter hyperintensities in methamphetamine and methadone dependent patients and healthy controls. Iran J Radiol 2014;11(2):e14275.
3. Huang S, Yang W, Yan C, Liu J. White matter abnormalities based on TBSS and its correlation with impulsivity behavior of methamphetamine addicts. Front Psychiatry 2020;11:452. doi: 10.3389/fpsyt.2020.00452.
4. Ghavidel N, Khodagholi F, Ahmadiani A, Khosrowabadi R, Asadi S, Shams J. Inflammation but not programmed cell death is activated in methamphetamine-dependent patients: relevance to the brain function. Int J Psycholophysiol 2020;157:42-50.
5. Ma YJ, Moazamian D, Cornfeld DM, Condron P, Holdsworth SJ, Bydder M, Du J, Bydder GM. Improving the understanding and performance of clinical MRI using tissue property filters and the central contrast theorem, MASDIR pulse sequences and synergistic contrast MRI. Quant Imaging Med Surg. 2022;12(9):4658-90.
6. Ma YJ, Moazamian D, Port JD, Edjlali M, Pruvo JP, Hacein-Bey L, et al. Targeted magnetic resonance imaging (tMRI) of small changes in the T1 and spatial properties of normal or near normal appearing white and gray matter in disease of the brain using divided subtracted inversion recovery (dSIR) and divided reverse subtracted inversion recovery (drSIR) sequences. Quant Imaging Med Surg 2023;13(10):7304-7337.
7. Quarantelli M. MRI/MRS in neuroinflammation: methodology and applications. Clin Transl Imaging 2015;3:475–489 8. Laule C, Port JD (Eds). Imaging Neuroinflammation. Cambridge MA, Academic Press, 2023.
Figures