2503
Microstructure Informed Susceptibility Source Separation (MI-SSS) Improves Correlation with Translocator Protein PET in Multiple Sclerosis1Electrical and Computer Engineering, Cornell University, Ithaca, NY, United States, 2Department of Radiology, Weill Cornell Medicine, New York, NY, United States, 3Department of Neurology, Weill Cornell Medicine, New York, NY, United States, 4Biomedical Engineering, Cornell University, Ithaca, NY, United States
Synopsis
Keywords: Neuroinflammation, PET/MR, Multiple Sclerosis
Motivation: Noninvasive detection of immune activity of chronic active MS lesions is of great interest. Specific biomarkers of immune activity such as quantitative susceptibility mapping (QSM) was proposed for this purpose. However, QSM suffers from the contamination of diamagnetic myelin.
Goal(s): The aim of this study is to show that paramagnetic susceptibility component derived from susceptibility source separation is more specific to immune activity than QSM.
Approach: The correlation of QSM and paramagnetic susceptibility against TSPO PET in 34 chronic lesions from 7 MS patients are obtained.
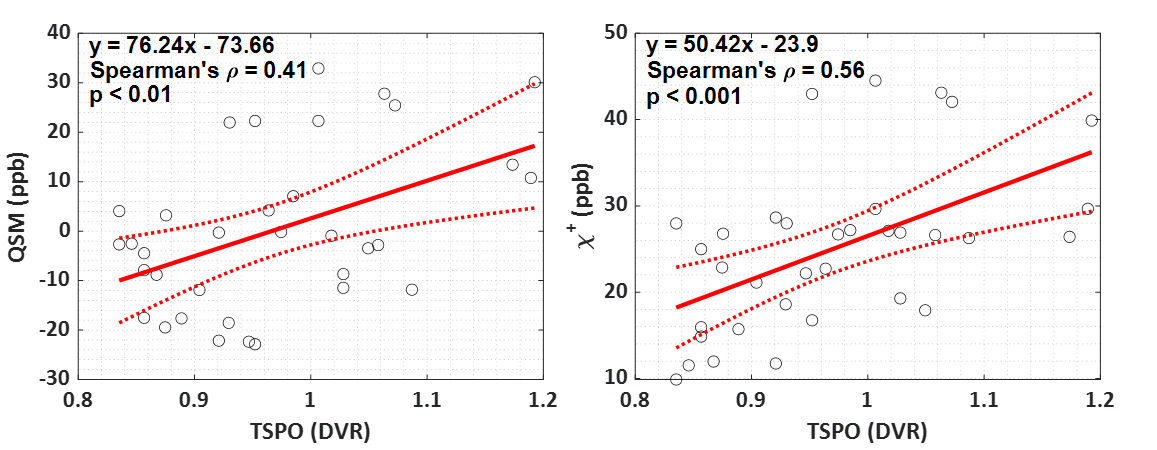
Results: Higher correlation of paramagnetic susceptibility shows its higher specificity to immune activity than QSM.
Impact: Chronic active MS lesions with immune activity are of great importance as they demonstrate ongoing demyelination. Susceptibility source separation provides an improved noninvasive biomarker for the in vivo quantification of immune activity.
Introduction
Chronic active multiple sclerosis (MS) lesions may demonstrate characteristic paramagnetic rims that are composed of activated microglia and macrophages. These lesions (also called smoldering lesions) are responsible for ongoing demyelination1. Detection and identification of paramagnetic rim lesions (PRLs) are critically important for the evaluation of disease progression and treatment effectiveness.Quantitative susceptibility mapping (QSM) is a noninvasive MRI modality based on multi gradient-echo (mGRE) imaging capable of estimating the distribution of magnetic susceptibility inside the body, including that of diamagnetic myelin and paramagnetic iron. Therefore, QSM is an ideal tool to detect demyelination and PRL formation in vivo1-3.
However, when diamagnetic and paramagnetic susceptibility co-occur in a voxel, their contributions cancel on QSM. To estimate the paramagnetic ($$$\chi^+$$$) and diamagnetic ($$$\chi^-$$$) susceptibility distributions separately, QSM and R2* are processed jointly, in a method called susceptibility source separation4-6. However, this method is confounded by fiber orientation and altered tissue water5,7. To this end, we have developed microstructure-informed susceptibility source separation (MI-SSS) based on the biophysical modeling of the multi-compartment structure of brain tissues. MI-SSS employs stochastic matching pursuit for the inverse mapping of $$$\chi^+$$$ and $$$\chi^-$$$ within a pre-computed dictionary8.
$$$\chi^+$$$ is hypothesized to be a more specific biomarker of increased microglial and macrophage activity in chronic active lesions than QSM. In this study, QSM and $$$\chi^+$$$ are correlated against Translocator Protein (TSPO) PET measurements within chronic MS lesions. TSPO is expressed on the outer mitochondria membrane of activated microglia/macrophages and therefore considered to be the biomarker for the microglial and macrophage activity here9.
Methods
MI-SSS models brain tissue as a complex with three water pools (myelin water, intra-extracellular water, and free water) with distinct T2 values; and two susceptibility compartments: diamagnetic hollow cylindrical myelin sheaths wrapped around highly organized white matter fibers and isotropic paramagnetic iron point sources randomly distributed in the extracellular region. Based on this model, a dictionary of possible signal evolutions is generated, and at inference time, QSM, mGRE magnitude, and diffusion tensor imaging (DTI)-based fiber orientation values of each voxel are utilized for the matching pursuit within the dictionary. Further details can be found in8.7 MS patients were scanned using 3D mGRE (voxel size=0.75 × 0.75 × 3 mm3, TE1=6.3 ms, ΔTE=4.1 ms, TR=48 ms, FA=15°, and rBW=260 Hz/pixel), DTI SE-EPI, (30 diffusion encoding directions, b=1000 s/mm2, TR=10000 ms, TE=84 ms, voxel size=1.9×1.9×2.5 mm3), Structural T1w, T2w and T2FLAIR images data also collected.
The same patients also underwent TSPO PET with a second-generation TSPO ligand ([11C]DPA713)10. The 90 min list mode data was binned into 30 frames (four 15s, four 30s, three 1min, two 2min, five 4min, and twelve 5min frames) and the data was reconstructed in a 400×400 matrix with a voxel size of 1.1×1.1×2 mm3. For TSPO ligand quantification, an image-derived input function (IDIF) technique was employed.
34 chronic MS lesions (26 non-PRL and 8 PRLs) from these 7 MS patients (Median interval between MRI and PET, 10 days; age 38 ± 10 years; 4 females; disease duration = 5.4 ± 6.9 years) were segmented on T2FLAIR and the mean values of QSM, $$$\chi^+$$$, and TSPO of each lesion were extracted.
Results and Discussion
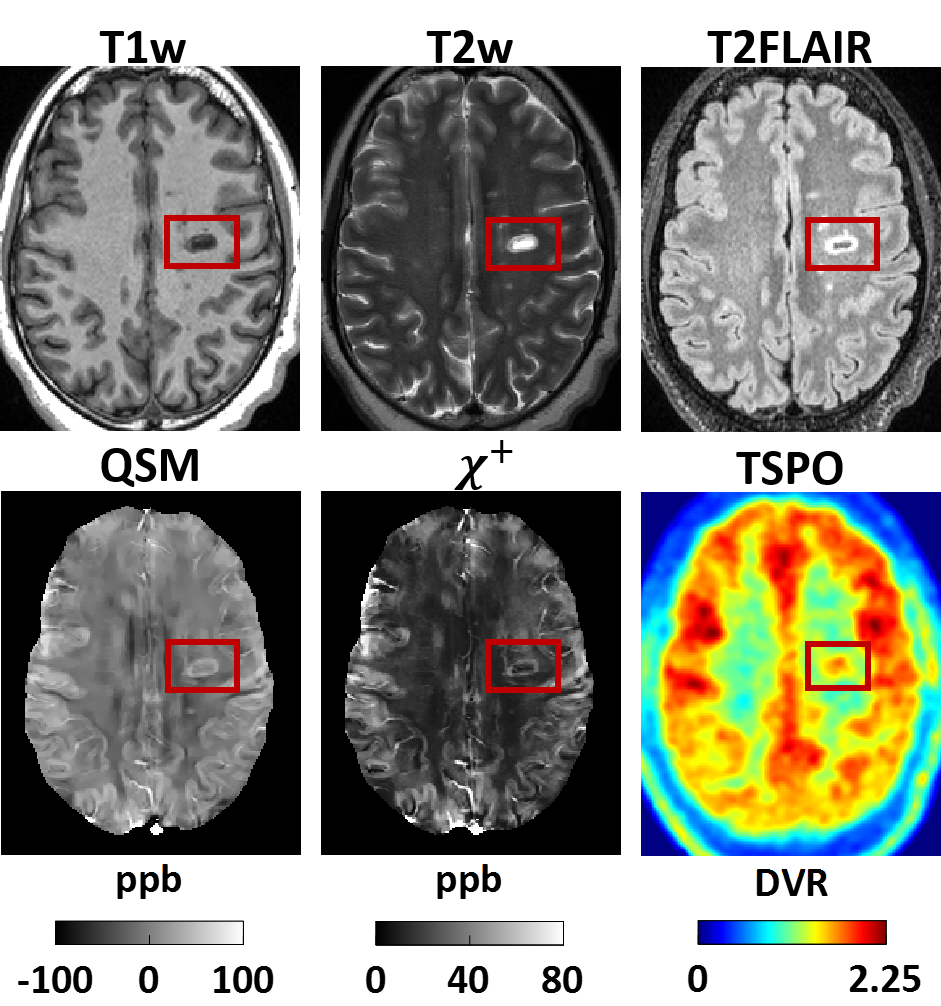
Figure 1 demonstrates T1w, T2w, and T2FLAIR structural images with a PRL in addition to the quantitative QSM, MI-SSS derived $$$\chi^+$$$, and TSPO maps. Structural images show the chronic lesion with a demyelinated core and a partially demyelinated periphery. QSM and $$$\chi^+$$$ maps on the other hand depict the paramagnetic rim and signal the active demyelination. TSPO map, on the other hand, shows the microglial and macrophage activation.In Figure 2, Spearman correlation analysis results between QSM vs. TSPO, and $$$\chi^+$$$ vs. TSPO. Both QSM and $$$\chi^+$$$ present significant correlation, however, $$$\chi^+$$$ has a higher correlation with TSPO. QSM is likely to suffer from the confounding effect of diamagnetic myelin.
Conclusion
$$$\chi^+$$$ has higher specificity to immune activity in chronic MS lesions than QSM and may be used as a noninvasive biomarker in clinical applications.Acknowledgements
This work was supported in part by research grants from the NIH: R01NS105144, R01NS090464, R01NS095562, S10OD021782, R01HL151686, and National MS Society: RG-1602-07671.References
1. Kaunzner UW, Kang Y, Zhang S, Morris E, Yao Y, Pandya S, Hurtado Rua SM, Park C, Gillen KM, Nguyen TD, Wang Y, Pitt D, Gauthier SA. Quantitative susceptibility mapping identifies inflammation in a subset of chronic multiple sclerosis lesions. Brain 2019;142(1):133-145.
2. Gillen KM, Mubarak M, Park C, Ponath G, Zhang S, Dimov A, Levine-Ritterman M, Toro S, Huang W, Amici S, Kaunzner UW, Gauthier SA, Guerau-de-Arellano M, Wang Y, Nguyen TD, Pitt D. QSM is an imaging biomarker for chronic glial activation in multiple sclerosis lesions. Ann Clin Transl Neurol 2021;8(4):877-886.
3. Marcille M, Hurtado Rúa S, Tyshkov C, Jaywant A, Comunale J, Kaunzner UW, Nealon N, Perumal JS, Zexter L, Zinger N, Bruvik O. Disease correlates of rim lesions on quantitative susceptibility mapping in multiple sclerosis. Scientific Reports 2022;12(1):4411.
4. Dimov AV, Nguyen TD, Gillen KM, Marcille M, Spincemaille P, Pitt D, Gauthier SA, Wang Y. Susceptibility source separation from gradient echo data using magnitude decay modeling. J Neuroimaging 2022;32(5):852-859.
5. Shin HG, Lee J, Yun YH, Yoo SH, Jang J, Oh SH, Nam Y, Jung S, Kim S, Fukunaga M, Kim W, Choi HJ. χ-separation: Magnetic susceptibility source separation toward iron and myelin mapping in the brain. Neuroimage 2021;240:118371.
6. Chen J, Gong NJ, Chaim KT, Otaduy MCG, Liu C. Decompose quantitative susceptibility mapping (QSM) to sub-voxel diamagnetic and paramagnetic components based on gradient-echo MRI data. Neuroimage 2021;242:118477.
7. Wharton S, Bowtell R. Fiber orientation-dependent white matter contrast in gradient echo MRI. Proc Natl Acad Sci U S A 2012;109(45):18559-18564.
8. Sisman M, Nguyen TD, Roberts AG, Romano DJ, Dimov AV, Kovanlikaya I, Spincemaille P, Wang Y. Microstructure-Informed Myelin Mapping (MIMM) from Gradient Echo MRI using Stochastic Matching Pursuit. medRxiv 2023.
9. Oh U, Fujita M, Ikonomidou VN, Evangelou IE, Matsuura E, Harberts E, Fujimura Y, Richert ND, Ohayon J, Pike VW, Zhang Y, Zoghbi SS, Innis RB, Jacobson S. Translocator protein PET imaging for glial activation in multiple sclerosis. J Neuroimmune Pharmacol 2011;6(3):354-361.
10. Endres CJ, Pomper MG, James M, Uzuner O, Hammoud DA, Watkins CC, Reynolds A, Hilton J, Dannals RF, Kassiou M. Initial evaluation of 11C-DPA-713, a novel TSPO PET ligand, in humans. J Nucl Med 2009;50(8):1276-1282.
Figures