2501
MRI T2* Hypointensity at the Glia Limitans in the Olfactory Bulb is due to High Iron in the Olfactory Ensheathing Cells in Young Adult Mouse1Laboratory of Functional and Molecular Imaging, National Institute of Neurological Disorders and Stroke, Bethesda, MD, United States, 2Electron Microscopy Facility, National Institute of Neurological Disorders and Stroke, Bethesda, MD, United States
Synopsis
Keywords: Neuroinflammation, Neuroinflammation, Brain iron, olfactory ensheathing cells, glia limitans, olfactory sensory neuron, lipofuscin
Motivation: Brain iron overload is a hallmark of neuroinflammatory diseases. Here, T2*-weighted MRI detected an increase of hypointensity at the olfactory nerve layer (ONL) in young mice from 3 to 12 weeks.
Goal(s): Find out the cellular origins of T2*-hypointensity.
Approach: MRI guided immunohistochemistry and electron-microscopy study.
Results: We found that the T2*-hypointensity is due to high iron in olfactory ensheathing cells (OECs). OECs form glia limitans, ensheath bundles of olfactory axons, and are the main phagocytic cells in olfactory system to aid regeneration of olfactory neurons. Near high-iron region, lipofuscin, a neuroinflammation marker was found in activated microglia as early as 6 weeks.
Impact: Guided by MRI, we found that there is an extraordinarily high level of intrinsic iron in the olfactory ensheathing cells in olfactory nerve layer in young mice, which indicates their phagocytic and neuroprotection functions during rapid olfactory sensory neuron turnover.
INTRODUCTION
The olfactory nervous system glia limitans is unique as it consists of olfactory ensheathing cells (OECs), olfactory sensory neuron (OSN) axon bundles, and astrocytes1,2. In contrast, the glia limitans in the rest of nervous system consists only of astrocytes and oligodendrocytes or Schwann cells. OSNs at the nasal epithelium have a unique ability to continuously regenerate from progenitor cells throughout life3,4. OECs at the olfactory nerve layer (ONL) wrap bundles of OSN axons, support axonal regeneration of OSNs, and show inflammatory responses making them a unique cell type5. Here, T2*-weighted MRI detected a rapid increase of hypointensity at ONL in normal mouse from 3 to 12 weeks. We aim to find out the origins of MRI hypointensity.METHODS
MRI and quantification. MRI experiments were carried out on an 11.7-T animal MRI with a Bruker CryoProbe. T2*-weighted 3D-gradient-recalled-echo (GRE) sequences were used for acquisitions. For in-vivo imaging, parameters were: isotropic-resolution=75 µm, TE/TR=10/30 ms, FA=10°, NA=3, scan-time=36m. For multi-gradient-echo (MGE) imaging: TE=5 ms, TR=60 ms, Echo Spacing=5 ms, Echo Images=4, FA=40°, NA=10, scan time=17h4m. For ex-vivo MRI: isotropic-resolution=50 µm, TE/TR=20/40 ms, FA=15°, NA=12, scan-time=15h8m. A line voxel-of-interest (MIPAV) was drawn from external plexiform layer (EPL) through glomerular layer (GL) and ONL. The % decreased intensity was calculated by: % (IntensityONL – IntensityEPL)/ IntensityEPL.Immunohistochemistry (IHC). Brain sections were stained using standard procedures for free-floating slice immunohistochemistry.
Preembedding immunogold labeling and electron microscopy (EM). Tissue slides were incubated with goat-anti-mouse-Sox10 to identify OECs for 1 hr, followed by incubation with donkey-anti-goat-Nanogold. The size and appearance of iron-containing ferritin molecules were determined as previous report6.
RESULTS
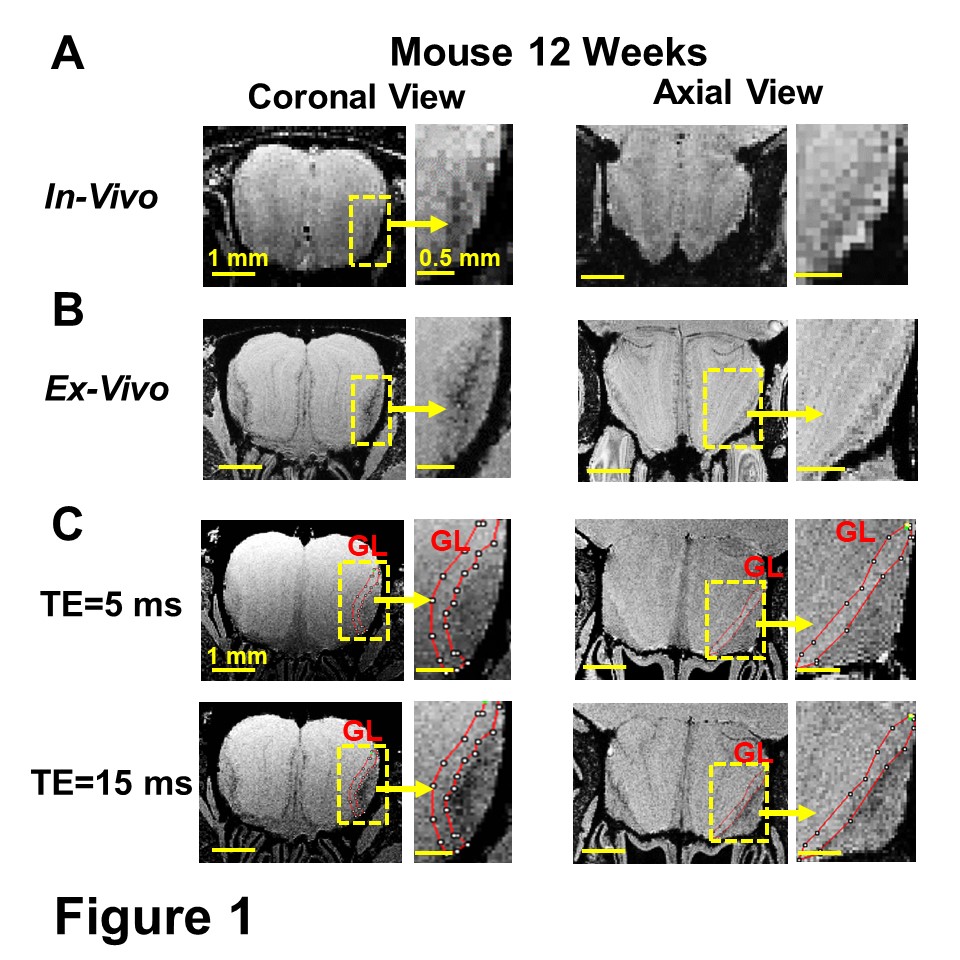
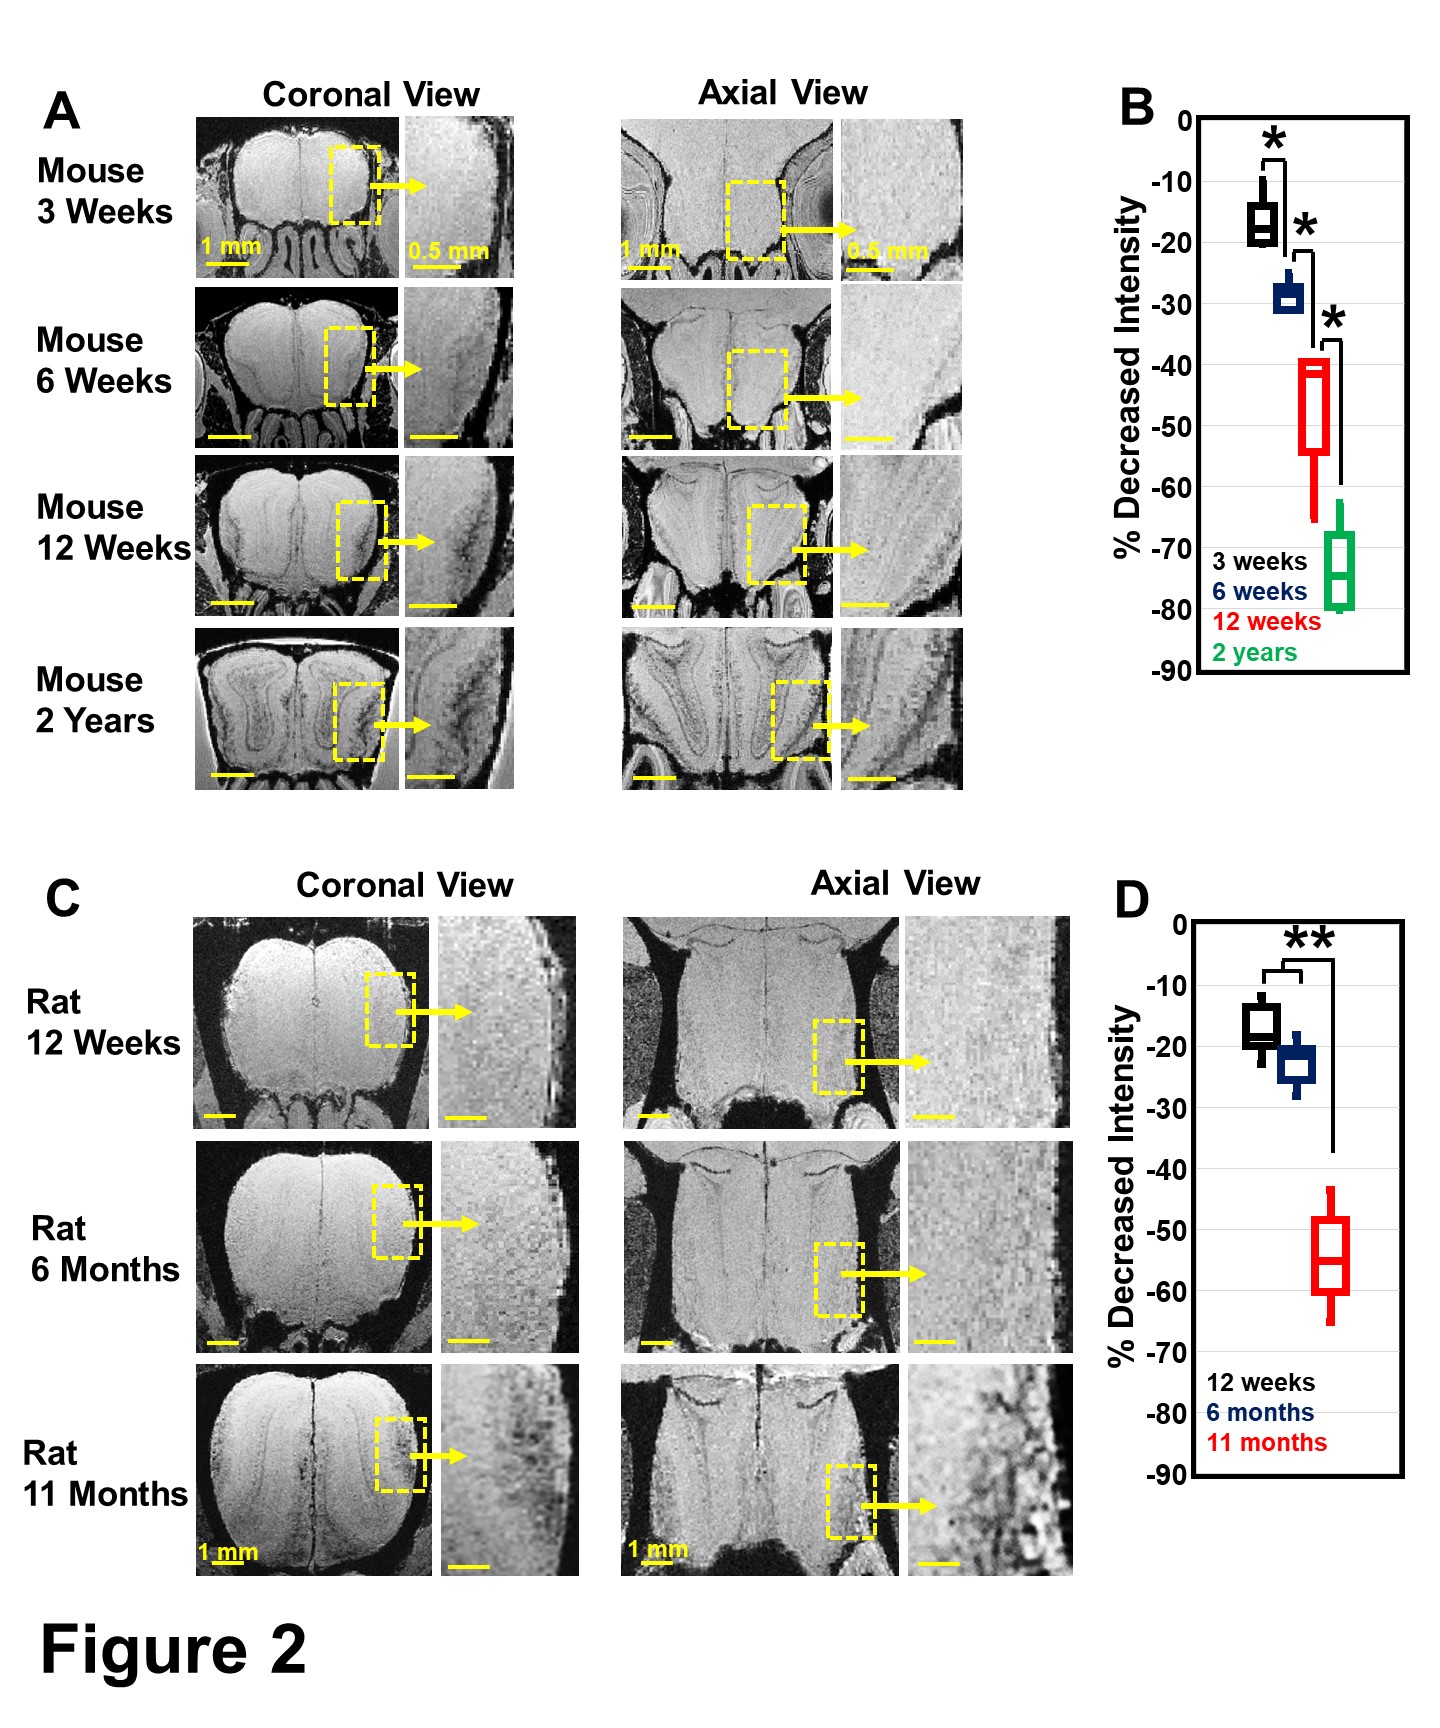
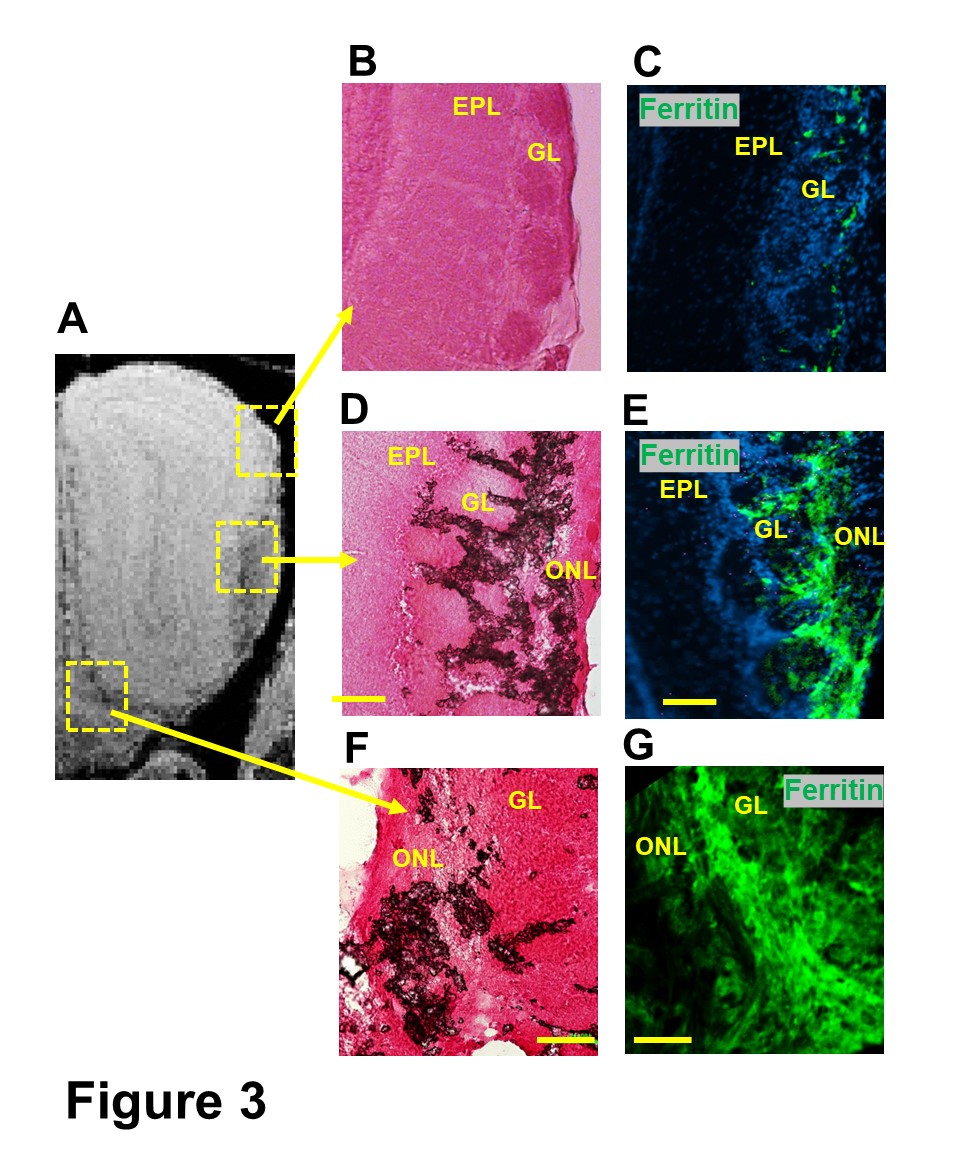
In normal 12-week-old mice, T2*-weighted MRI detected a significant hypointensity region from the edge of the GL into the ONL (Fig 1A-B). This hypointensity was identified at the ONL as shown by MGE MRI, in which GL can be identified as hyperintense due to shorter T1 of this layer at a short TE (TE=5 ms, Fig 1C). The change in the hypointense region was studied as a function of age in mice and rats (Fig 2A,C). The decrease of intensity from EPL to ONL was quantified (Fig 2B,D). In mice, the decrease of intensity at 3 weeks, 6 weeks, 12 weeks, and 2 years were 16.5±4.9%, 30±5.5%, 48.2±11.5% and 73.1±8.4%, respectively. This rapid increase of hypointensity in the ONL was not observed in young rats. 17.3±4.6% decrease of intensity was detected in 12-week rats, comparing with 48.2±11.5% in mice. Only at 11 months was there a large decrease of intensity (Fig 2D).This hypointensity at the ONL was due to iron accumulation, as shown by Prussian Blue iron staining and IHC staining of ferritin in 12-week mice (Fig 3).
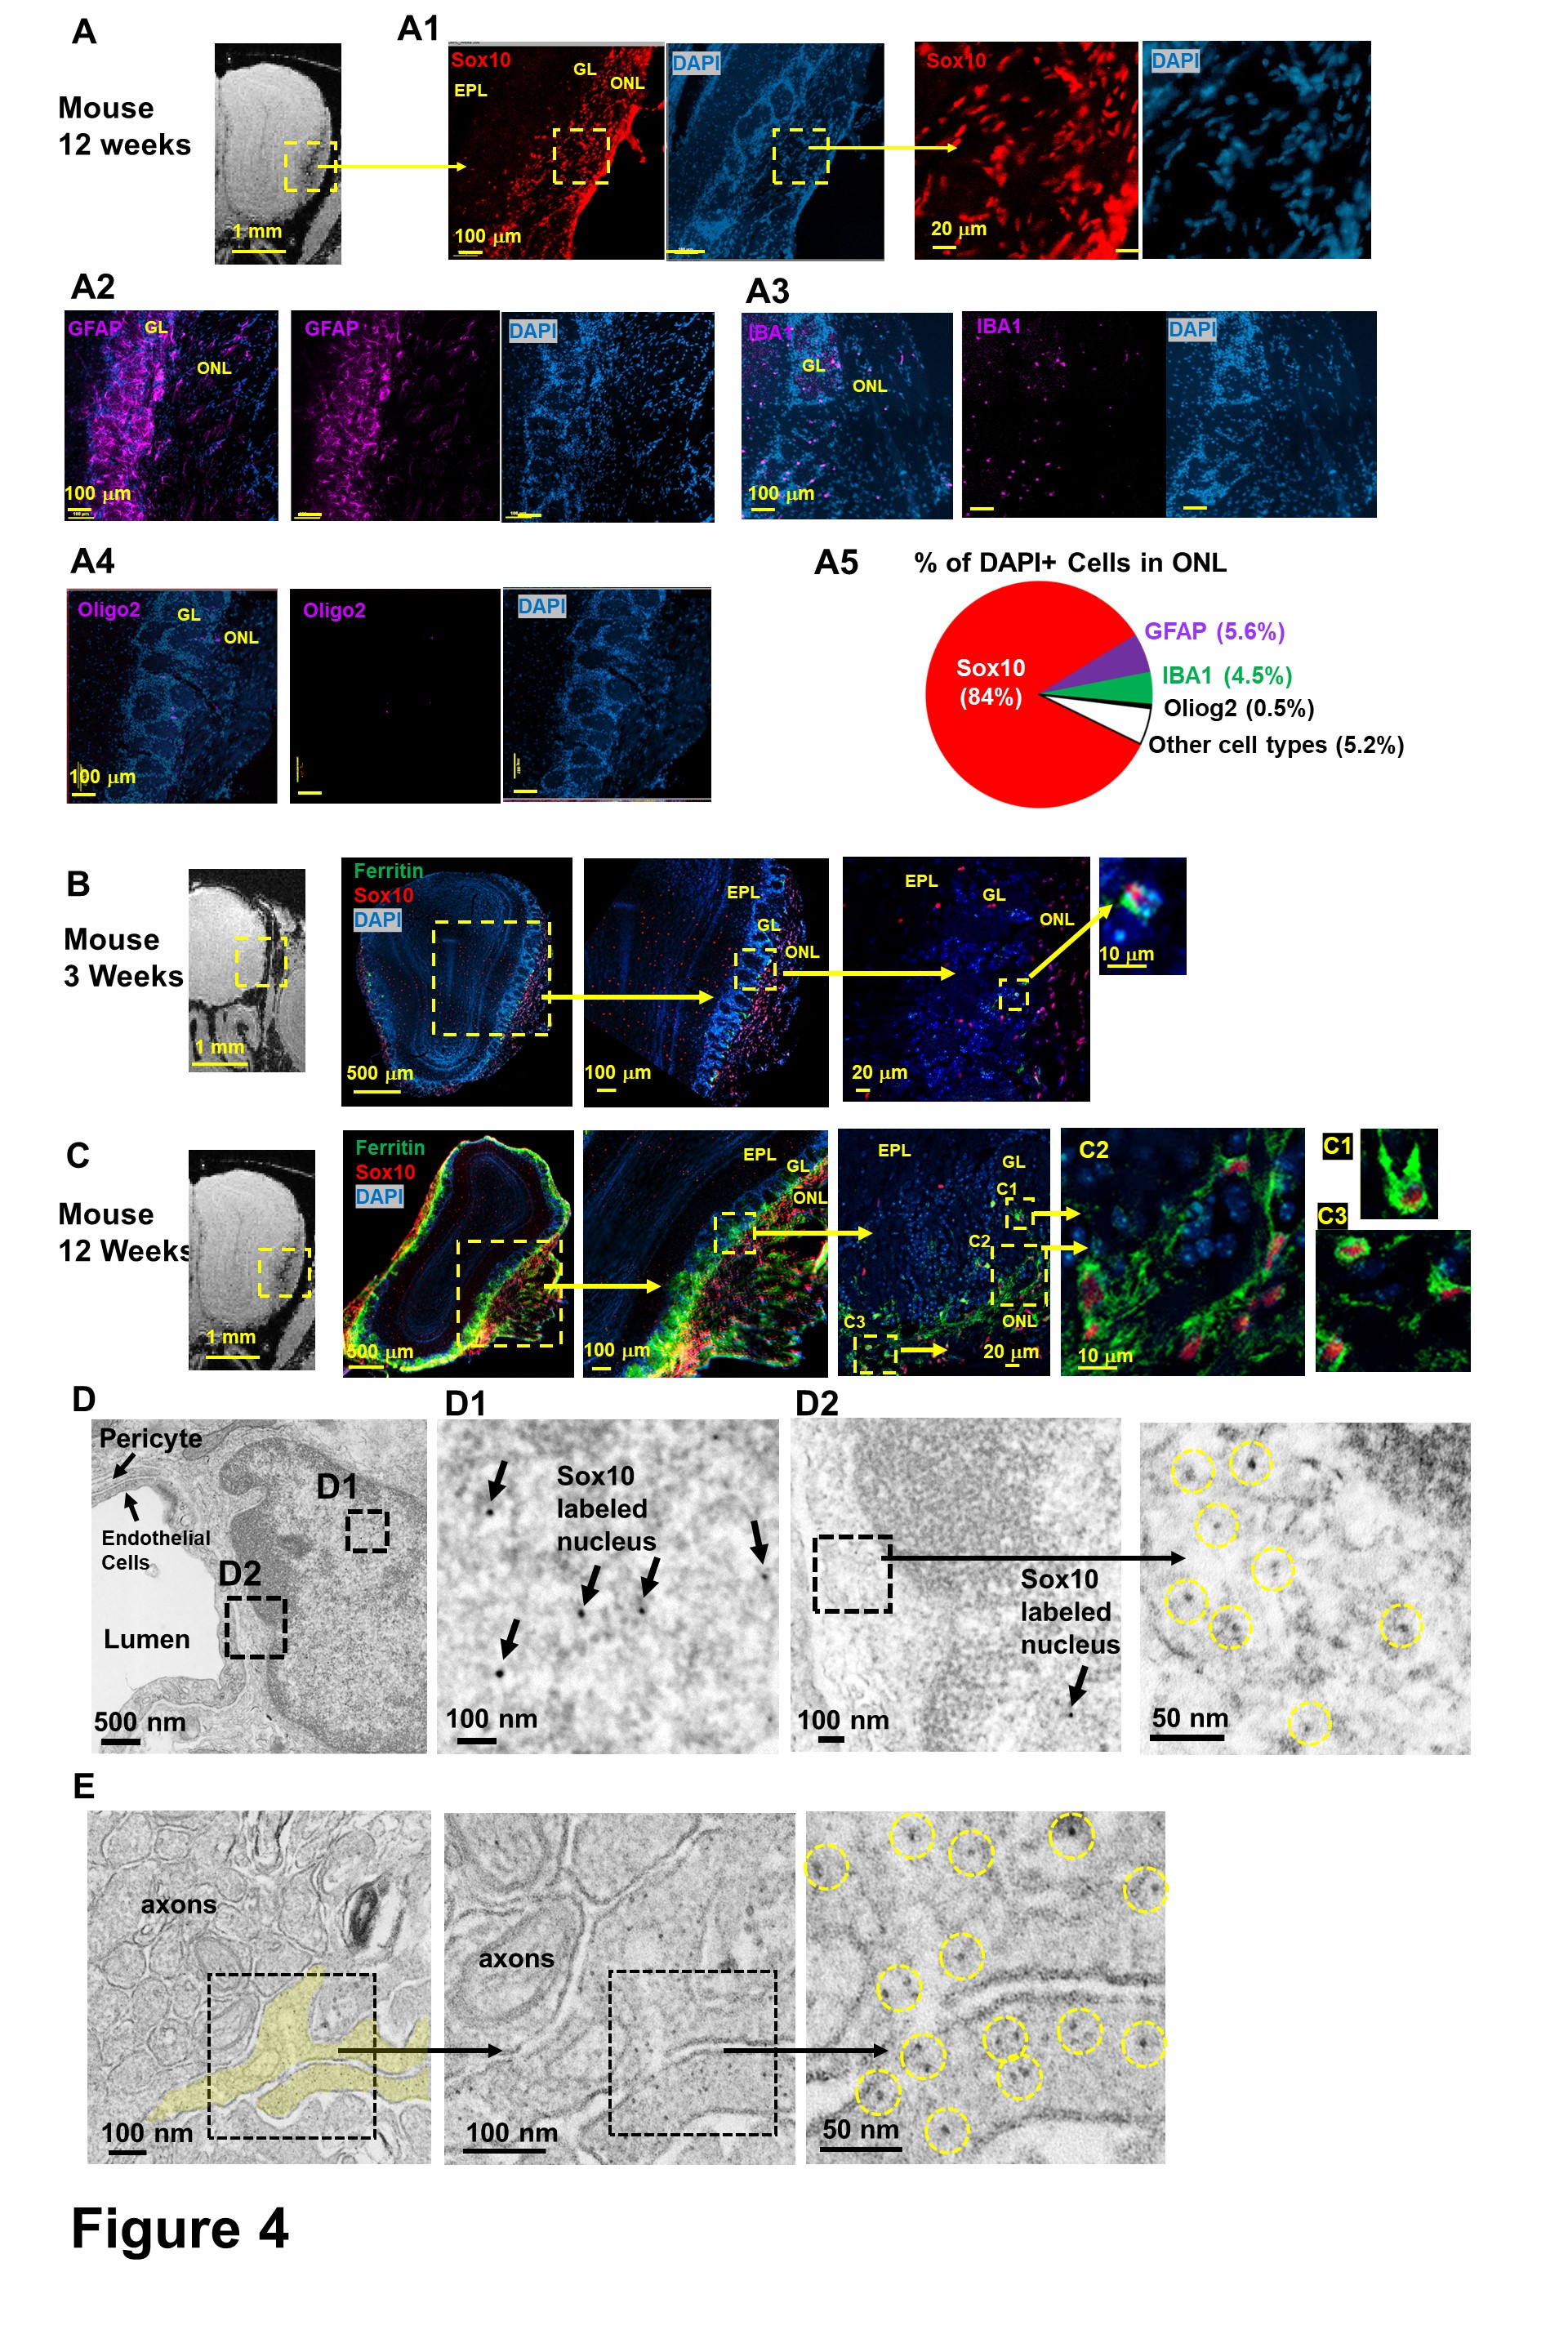
To determine the cellular origin of the high iron, olfactory bulb tissues of 12-week-old mice were stained for OECs (Sox10), astrocytes (GFAP), microglia (IBA1) and oligodendrocytes (Oligo2). We found that OECs were the major cell type (84.2±6.2% of DAPI+ cells) at ONL (Fig 4A). Co-staining of OECs and ferritin showed that there was a high level of ferritin in OECs (Fig 4C). EM images showed OECs wrapped blood vessel and axon bundles (Fig 4D,E). High concentration of EM dark contrast consistent with the size of ferritin were interpreted to be ferritin containing iron particles (yellow circles) in the cytoplasm of OECs.
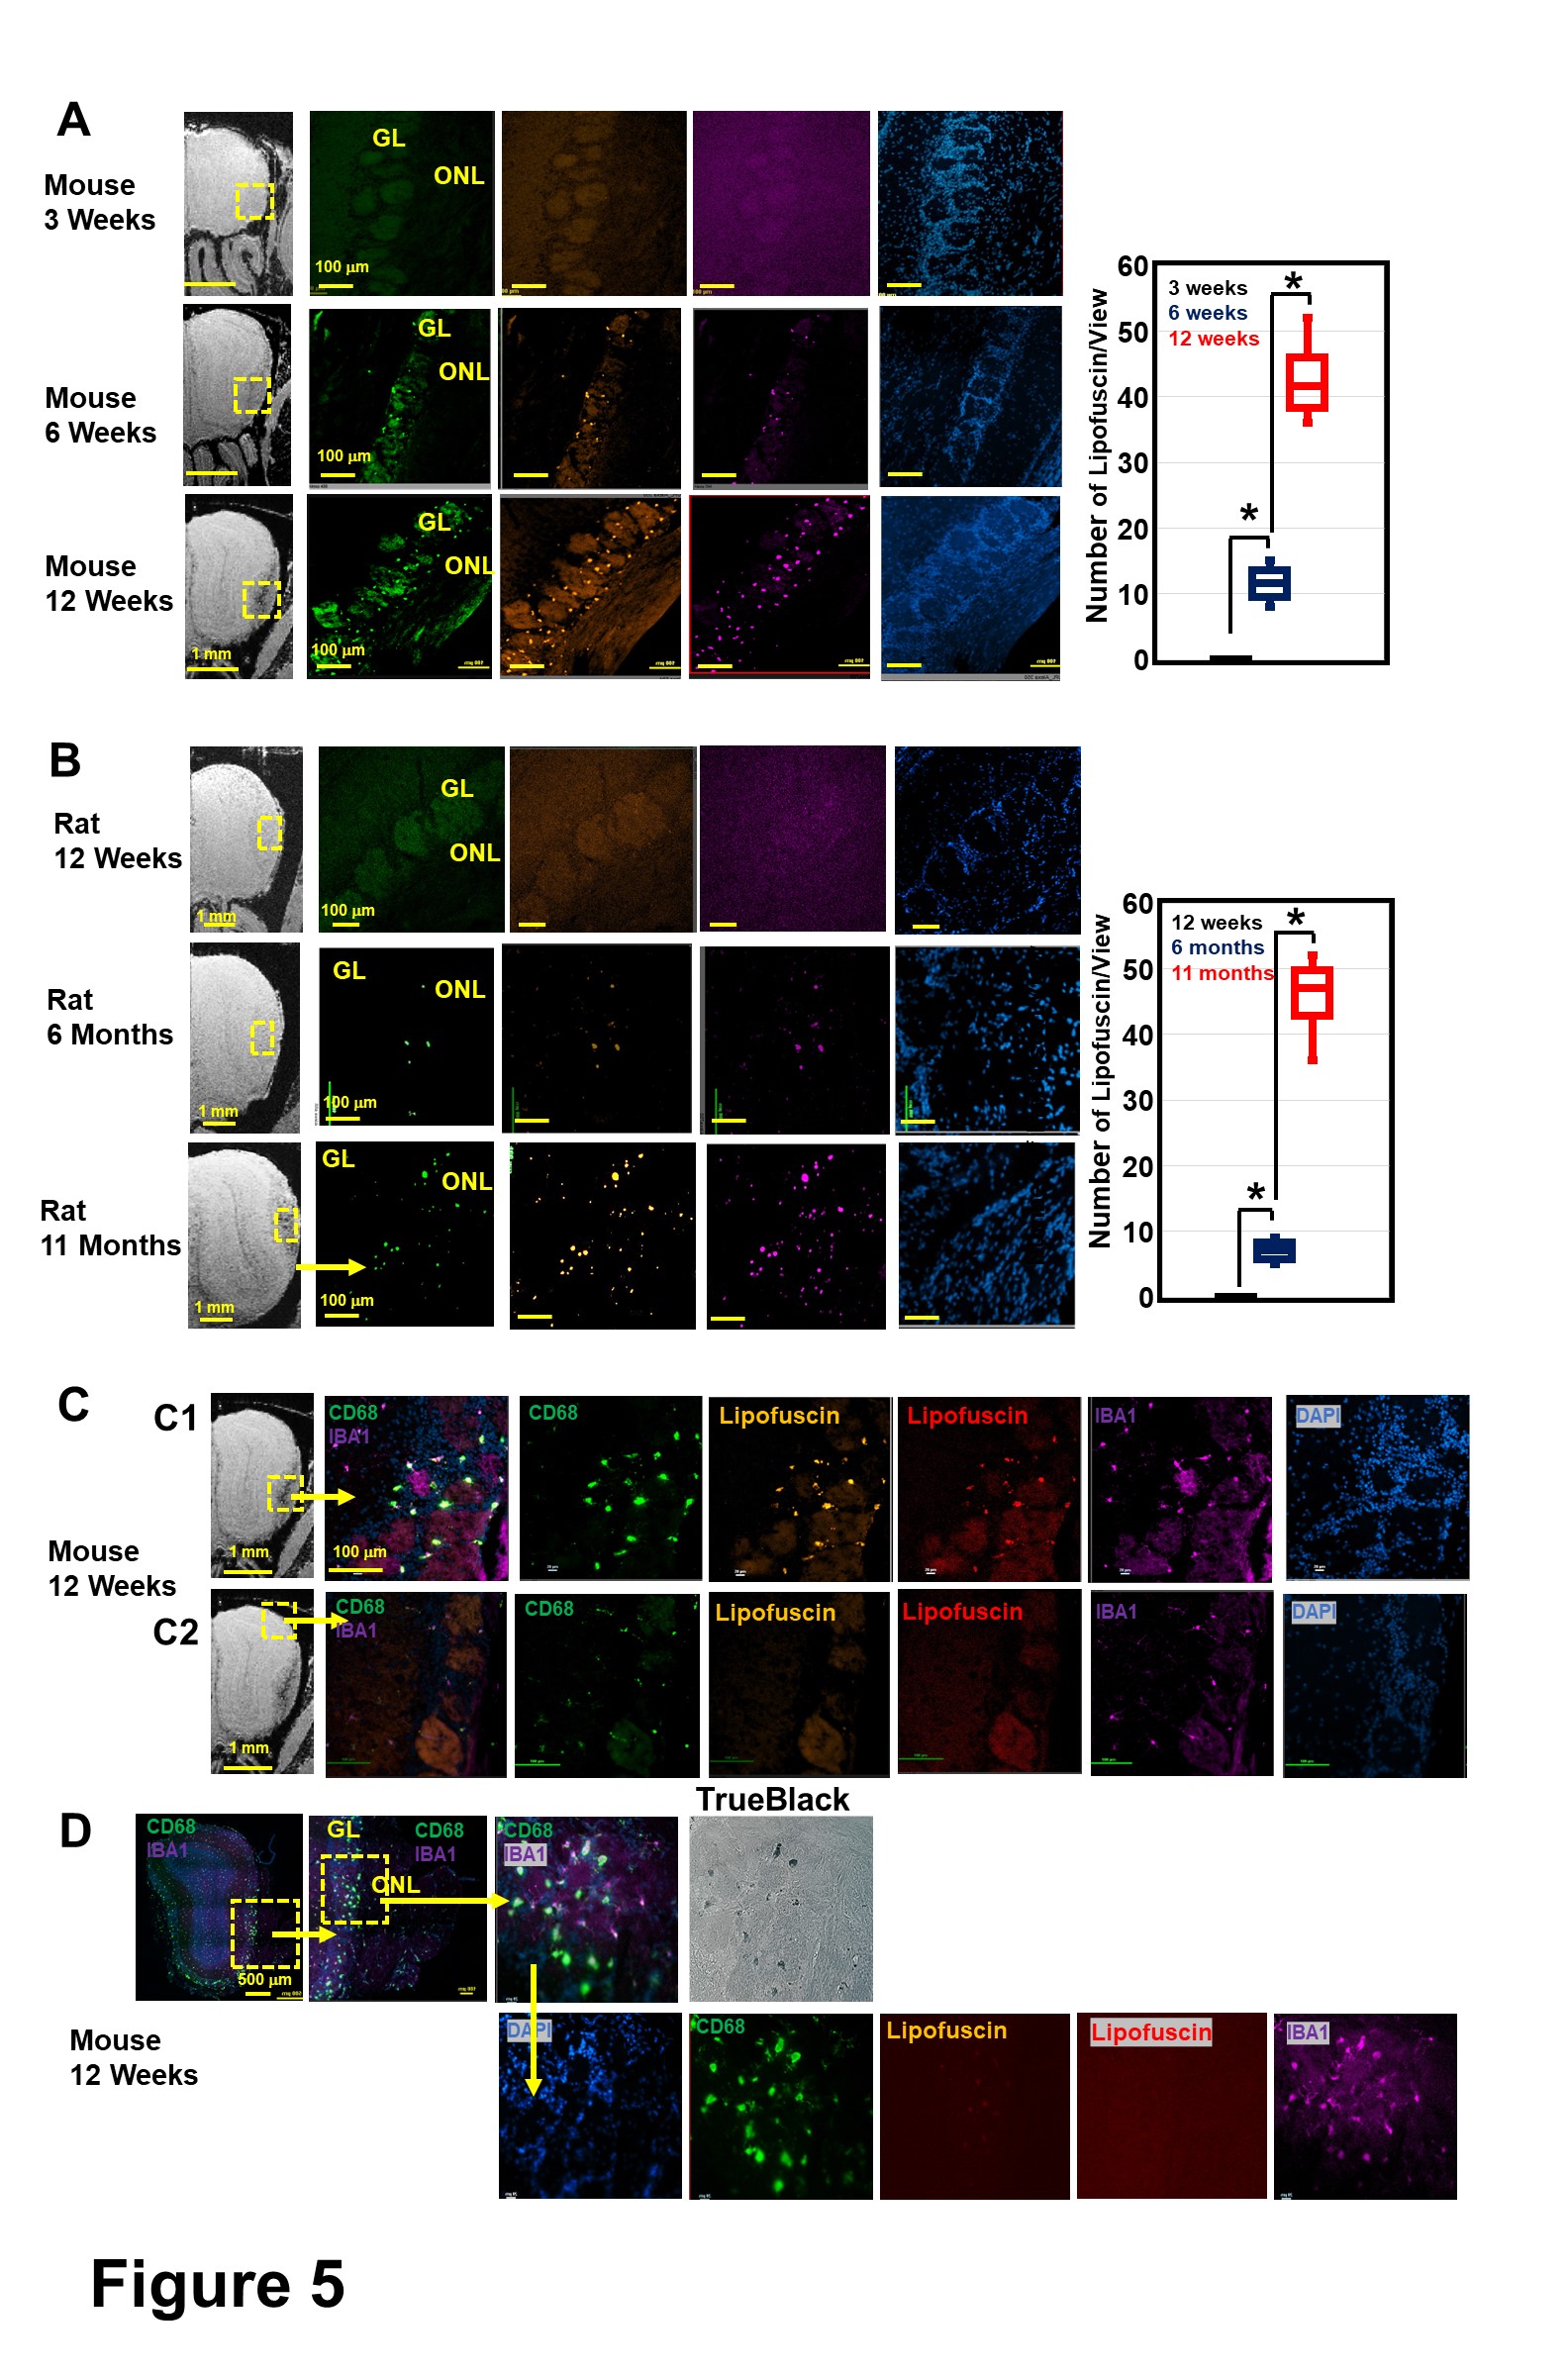
Lipofuscin, a neuroinflammation marker, was observed in high iron areas in ONL and GL in mice as early as 6 weeks (Fig 5A). Lipofuscin was not detected in 3-week mice and 6-month rats (Fig 5B), in which hypointensity was not detected by MRI. Lipofuscin was found to located in the CD68+ activated microglia (Fig 5C-D). Lipofuscin was found primarily in the GL, and not ONL, indicating that OECs can safely store high iron.
DISCUSSION
Brain iron overload leads to neuroinflammation and neurodegeneration, which is evident in many neurological disorders. Oligodendrocytes are a major source of iron in brain as are iron-laden activated macrophages and microglia7. It is not clear why the rat and mouse have such different age dependencies for gaining iron in ONL and may have to do with a higher rate of OSNs regeneration or a higher metabolic rate in the mouse.Although the mechanistic connection between iron accumulation and markers of inflammation such as lipofuscin and activated glia is unclear, they are likely closely associated. This model may help to understand the well-known links between high iron and inflammation.
CONCLUSION
We found that there is a high level of intrinsic iron in the OECs at the ONL of young mice and, interestingly, lipofuscin accumulate nearby at this olfactory barrier.Acknowledgements
This research was supported by the intramural program at the National Institute of Neurological Disorders and Stroke (NINDS), National Institutes of Health (NIH).References
1. Beiersdorfer A, Wolburg H, Grawe J, Scheller A, Kirchhoff F, Lohr C. Sublamina-specific organization of the blood brain barrier in the mouse olfactory nerve layer. Glia. 2020;68(3):631-45. Epub 20191107. doi: 10.1002/glia.23744. PubMed PMID: 31696993.
2. Nazareth L, Chen M, Shelper T, Shah M, Velasquez JT, Walkden H, Beacham I, Batzloff M, Rayfield A, Todorovic M, Beagley KW, St John JA, Ekberg JAK. Novel insights into the glia limitans of the olfactory nervous system. J Comp Neurol. 2019;527(7):1228-44. doi: 10.1002/cne.24618. PubMed PMID: WOS:000460313000005.
3. Beecher K, St John JA, Chehrehasa F. Factors that modulate olfactory dysfunction. Neural Regen Res. 2018;13(7):1151-5. doi: 10.4103/1673-5374.235018. PubMed PMID: 30028314; PMCID: PMC6065237.
4. Saglam A, Calof AL, Wray S. Novel factor in olfactory ensheathing cell-astrocyte crosstalk: Anti-inflammatory protein alpha-crystallin B. Glia. 2021;69(4):1022-36. Epub 20201212. doi: 10.1002/glia.23946. PubMed PMID: 33314354; PMCID: PMC9469687.
5. Denaro S, D'Aprile S, Alberghina C, Pavone AM, Torrisi F, Giallongo S, Longhitano L, Mannino G, Lo Furno D, Zappala A, Giuffrida R, Tibullo D, Li Volti G, Vicario N, Parenti R. Neurotrophic and immunomodulatory effects of olfactory ensheathing cells as a strategy for neuroprotection and regeneration. Front Immunol. 2022;13:1098212. Epub 20221219. doi: 10.3389/fimmu.2022.1098212. PubMed PMID: 36601122; PMCID: PMC9806219.
6. Zhang P, Land W, Lee S, Juliani J, Lefman J, Smith SR, Germain D, Kessel M, Leapman R, Rouault TA, Subramaniam S. Electron tomography of degenerating neurons in mice with abnormal regulation of iron metabolism. J Struct Biol. 2005;150(2):144-53. doi: 10.1016/j.jsb.2005.01.007. PubMed PMID: 15866737; PMCID: PMC1698958.
7. Nair G, Dodd S, Ha SK, Koretsky AP, Reich
DS. Ex vivo MR microscopy of a human brain with multiple sclerosis: Visualizing
individual cells in tissue using intrinsic iron. Neuroimage. 2020;223:117285.
Epub 20200820. doi: 10.1016/j.neuroimage.2020.117285. PubMed PMID: 32828923;
PMCID: PMC7811778.
Figures