2495
SNR Quantification using Pseudoreplica Method: Validation in Phantom and Application to in-vivo Brain Perfusion using ASL1Department of Radiology, UT Southwestern Medical Center, Dallas, TX, United States, 2Philips Healthcare, Dallas, TX, United States, 3Philips Healthcare, Best, Netherlands, 4Advanced Imaging Research Center, UT Southwestern Medical Center, Dallas, TX, United States
Synopsis
Keywords: Data Processing, Quantitative Imaging, SNR, ASL, Brain
Motivation: SNR is a key image quality metric; however estimating it can be difficult when using more complex image acquisition and reconstruction techniques.
Goal(s): Demonstrate the validity of the pseudoreplica method as an accurate SNR estimation tool and show potential for its translation into clinical scanning protocols.
Approach: We quantified SNR using our pseudoreplica method implementation in MATLAB in a prostate phantom, as well as in a brain ASL dataset of healthy volunteers.
Results: SNR values obtained with the pseudoreplica method in the prostate phantom and in-vivo brain ASL dataset had good agreement with the multiple and dual acquisition SNR quantification methods.
Impact: We have demonstrated the reliability and accuracy of our pseudoreplica SNR quantification implementation in ASL. Integrating this method into the scanner's pipeline would allow for real-time assessment of image quality and further optimization of new MR sequences and reconstruction methods.
Introduction
Signal-to-noise ratio (SNR) is a highly valuable metric used to assess image quality. Conventional methods to calculate SNR use a region-of-interest (ROI) approach to measure noise standard deviation in the background. While this technique performs well in some datasets, it is not suitable when dealing with more complex image acquisition and reconstruction methods (SENSE/GRAPPA)1,2. Alternative approaches that use multiple repeated acquisitions may be feasible in phantom studies but are impractical clinically. The “pseudoreplica” method has become an attractive alternative for accurate SNR quantification, especially in cases where noise is not uniformly distributed throughout the image3. Arterial spin labeling (ASL) is a perfusion-weighted technique where SNR quantification is highly desired due to its inherent low signal4. Nonetheless, SNR estimation in ASL remains challenging with conventional techniques. In this work we present an implementation of the pseudoreplica method, its validation on a phantom model, and application to an in-vivo brain ASL dataset.Theory and Methods
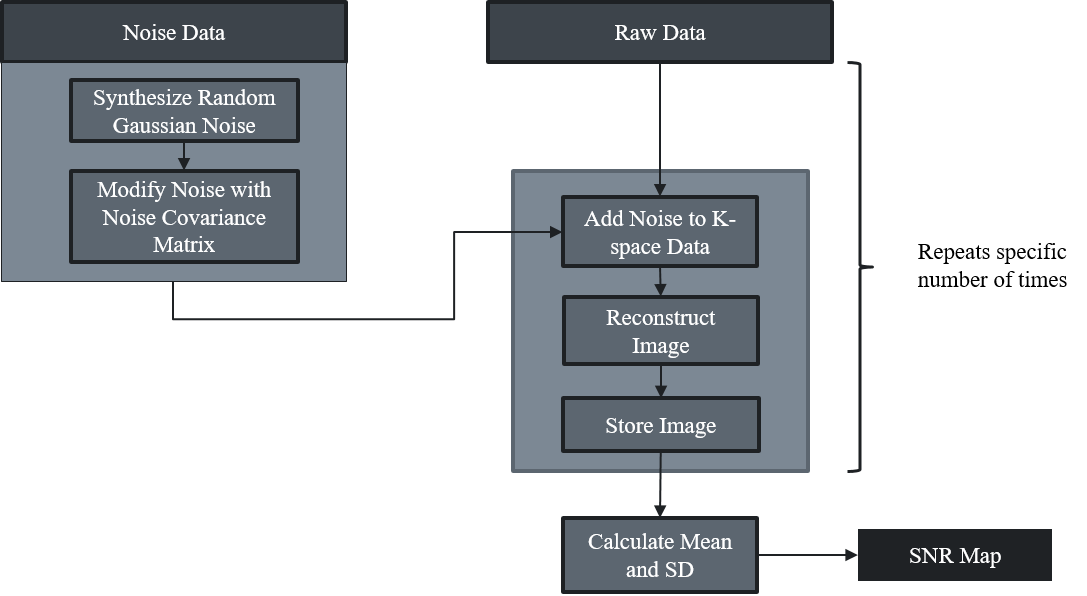
The pseudoreplica method assumes repeated acquisitions of k-space differ solely in their noise content, hence multiple reconstructions can be used to estimate the noise distribution throughout the image on a voxel-by-voxel basis3,5. Our pseudoreplica method was implemented in MATLAB (MathWorks) using ReconFrame (Gyrotools) for phantom data reconstruction and a custom-built reconstruction for all in-vivo ASL data. First, the noise correlations between receiver coil elements were calculated with a noise-only pre-scan (20,000 noise samples for each coil), using the following equation: $$${\Psi}_{ij}=\frac{1}{2N}\sum_{k=1}^Nn_{ik}n_{jk}^*$$$. Noise covariance matrix was scaled by the effective noise bandwidth to ensure the noise spectrum from the pre-scan was flat across the entire bandwidth of the signal.To generate multiple artificial images with similar noise, we synthesized Gaussian noise, scaled by the matrix square root of the noise covariance matrix. This noise was subsequently added to the k-space data, followed by complete reconstruction pipeline to create a final image. This process was repeated a user-defined number of times and SNR was calculated as the ratio of mean signal intensity to the standard deviation across replicates (Figure 1).
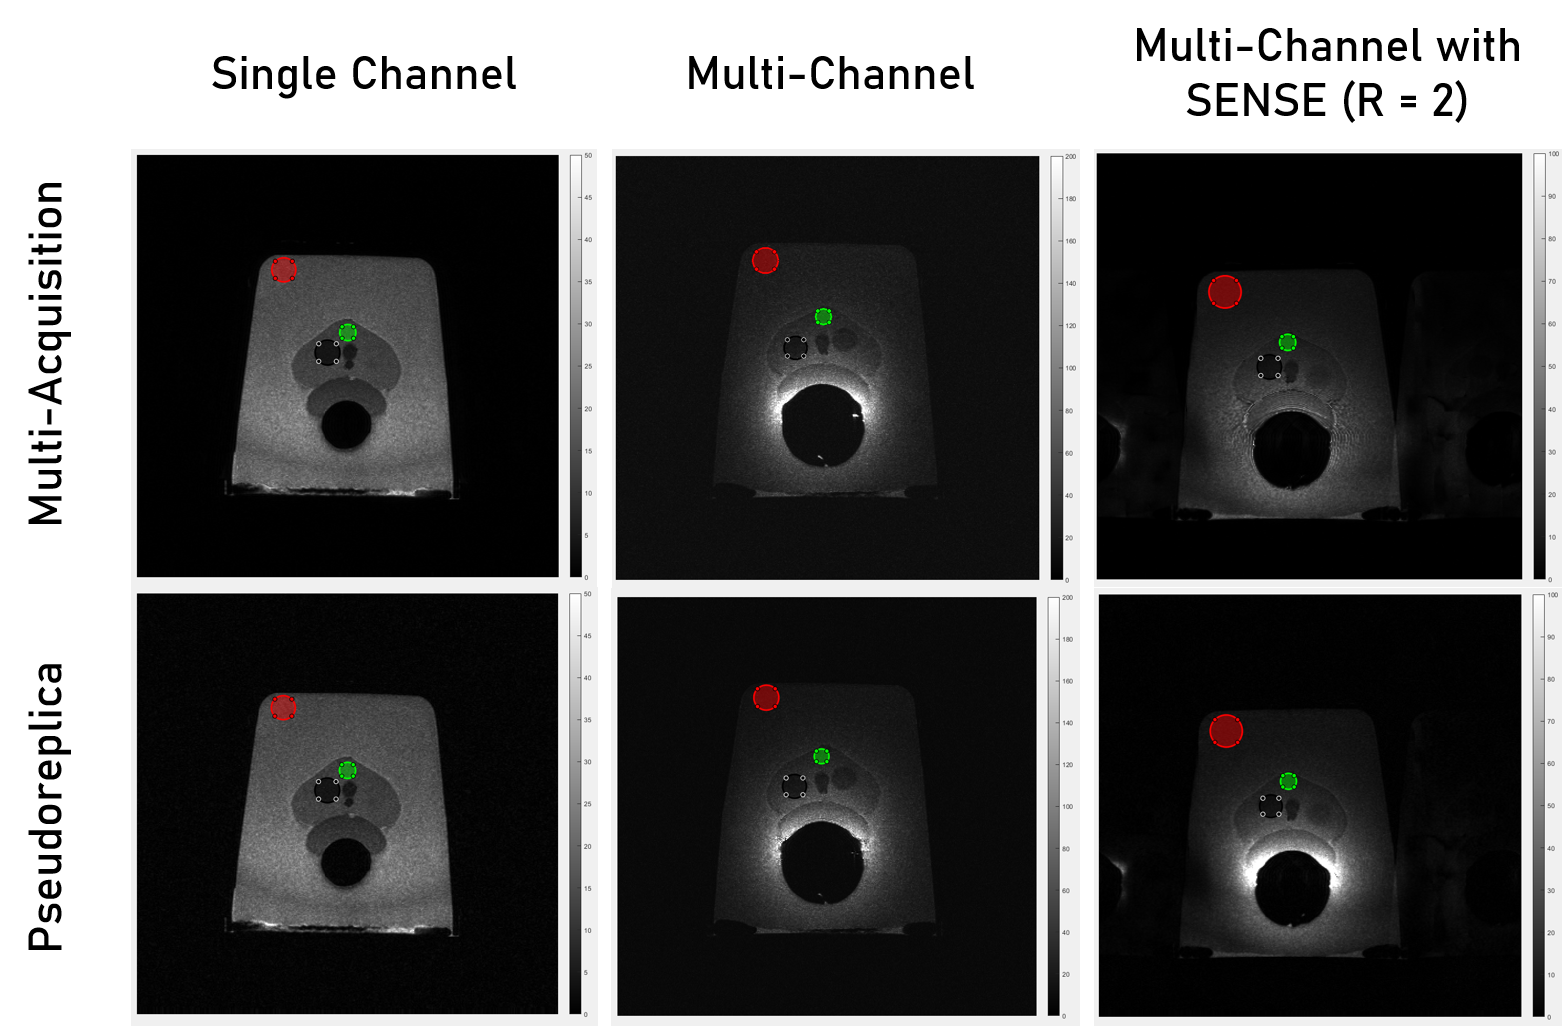
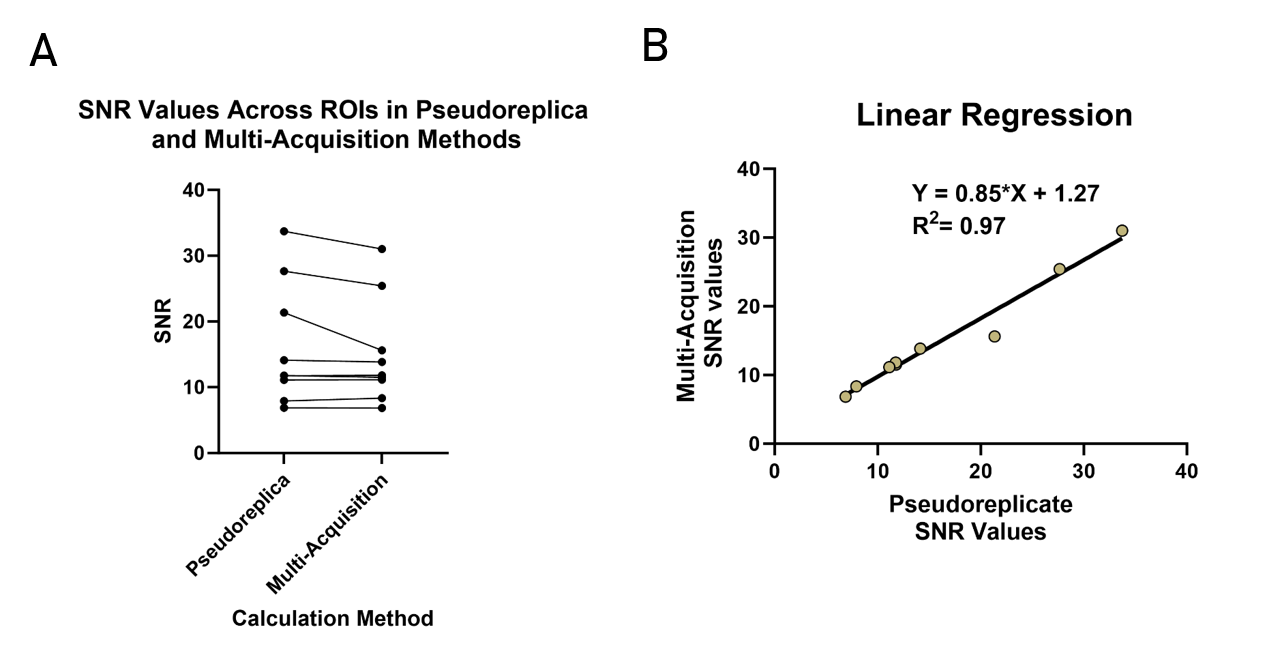
The method was tested on a prostate phantom (Yezitronix) by acquiring a T2-weighted sequence with 32 dynamics. Retrospectively, we generated 32 replicates of the first dynamic using the pseudoreplica algorithm. SNR quantification was performed using both pseudoreplicates and actual replicates on a voxel-by-voxel basis. Three ROIs were manually drawn to compare both methods.
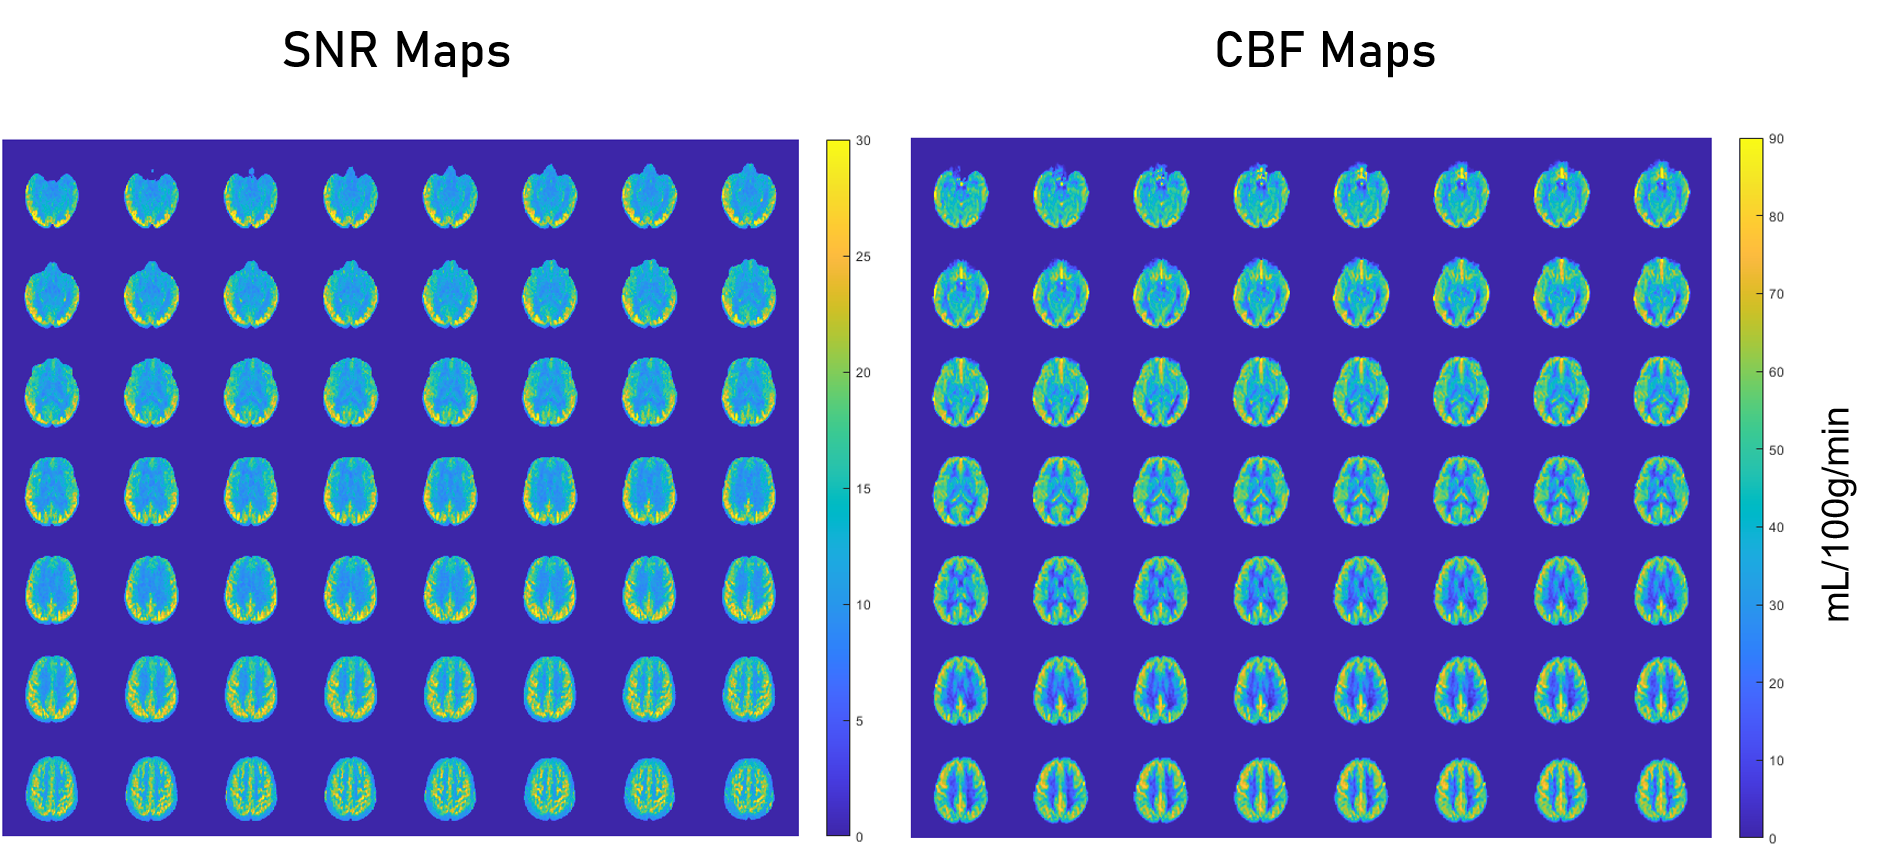
In-vivo comparison was performed on a cohort of 20 healthy volunteers, previously acquired to test the reproducibility of a novel ASL sequence6. Acquisition parameters were: TR/TE = 6000/14 ms, echo spacing = 2.8 ms, TSE factor = 80, acquisition time = 3:10 minutes. For each subject, the sequence was performed twice within the same imaging session. We generated 32 individual pseudoreplicates using both the first and second repetitions and calculated SNR maps for each set. All ASL images were co-registered to the SRI24 Brain Atlas7 to extract white matter and grey matter tissue masks. Control SNR quantification was performed using dual acquisition method in ROIs1. Average SNR for each volunteer across all slices for both brain tissues were calculated.
All statistical analysis was performed with GraphPad Prism (GraphPad). In phantom data, a linear regression was done with SNR values from ROIs across all experiments. Bland-Altman plots were generated in the ASL dataset for both tissues.
Results
In phantom dataset, SNR values from the pseudoreplica method were comparable to the multi-acquisition method in both single-channel and multi-channel (including parallel imaging) scans (Figs. 2,3). In multi-channel acquisition without parallel imaging, there was high agreement between both methods in ROIs with higher SNR; however, in regions with lower SNR, the pseudoreplica method overestimated SNR by ~6 units.In in-vivo brain ASL, SNR values from the pseudoreplicate method were comparable to the dual-acquisition method in both grey matter and white matter (Fig. 4). Bland-Altman plots demonstrated good agreement between both methods with minimal bias. The bias was similar regardless of which repetition was used for pseudoreplicate generation (Fig. 5).
Discussion
The proposed pseudoreplica method accurately calculated SNR values in phantoms for acquisitions with and without parallel imaging. In ASL data, there was minimal bias between the methods for grey and white matter; however, there were larger differences in SNR for a small number of subjects (outliers in Fig. 5). Future work will investigate these differences and adapt the pseudoreplica reconstruction to account for regions with low SNR.Conclusion
Pseudoreplica method can be used for accurate SNR quantification even in acquisitions such as ASL that are often low in SNR. This establishes an objective method to compare ASL methods that can be performed without needing additional acquisitions.Acknowledgements
This work was supported by NIH/NCI grants U01CA207091, R01CA283663, and CPRIT RP190049. The authors would like to thank all volunteers for their participation in this study. The authors also thank Abey Thomas, RT(MR), Courtney Dawson, RT(MR), Michael Fulkerson, AS, LVN, and Camille Harry, for their help in human imaging, and Ben Wagner, MSEE, for his help with image database and analysis routines.References
1. Dietrich, O., et al. (2007). "Measurement of signal-to-noise ratios in MR images: influence of multichannel coils, parallel imaging, and reconstruction filters." J Magn Reson Imaging 26(2): 375-385.
2. Goerner, F. L. and G. D. Clarke (2011). "Measuring signal-to-noise ratio in partially parallel imaging MRI." Med Phys 38(9): 5049-5057.
3. Robson, P. M., et al. (2008). "Comprehensive quantification of signal-to-noise ratio and g-factor for image-based and k-space-based parallel imaging reconstructions." Magn Reson Med 60(4): 895-907.
4. Hernandez-Garcia, L., et al. (2019). "Recent progress in ASL." Neuroimage 187: 3-16.
5. Kellman, P. and E. R. McVeigh (2005). "Image reconstruction in SNR units: a general method for SNR measurement." Magn Reson Med 54(6): 1439-1447.
6. Zhou L., et al. Reproducibility of Pseudocontinuous Arterial Spin Labeling Measured Perfusion in Healthy Volunteers and Glioblastoma Patients. In: Proceedings of the 31st ISMRM Annual Meeting, 2023. Abstract number 2585.
7. Rohlfing, T., et al. (2010). "The SRI24 multichannel atlas of normal adult human brain structure." Hum Brain Mapp 31(5): 798-819.
8. Greer, JS et al. Robust pCASL perfusion imaging using a 3D Cartesian acquisition with spiral profile reordering (CASPR). MRM 2019; 82(5):1713-1724.
Figures