2485
Toward Reliable Quantification of Global Cerebrovascular Reactivity to Hypoxic Hypoxia1Biomedical Engineering, McCormick School of Engineering, Northwestern University, Evanston, IL, United States, 2Physical Therapy and Human Movement Sciences, Feinberg School of Medicine, Northwestern University, Chicago, IL, United States, 3Radiology, Feinberg School of Medicine, Northwestern University, Chicago, IL, United States
Synopsis
Keywords: Blood Vessels, Velocity & Flow, Neuro, Hypoxia, Oxygenation, Cerebrovascular Reactivity
Motivation: The cerebrovascular response to mild hypoxia has not been well-characterized, but hypoxic cerebrovascular reactivity (CVR) may be an important metric that could complement hypercapnic CVR in clinical applications, giving distinct information about cerebrovascular health.
Goal(s): We aimed to increase reliability of hypoxic CVR and modulate the effects of concurrent CO2 changes.
Approach: Using phase-contrast MRI, we measured cerebral blood flow during baseline, hypoxic, and hypercapnic respiratory states, induced with a computer-controlled gas blender. We used hypercapnic CVR to implement a simple correction for changes in PETCO2 that occurred during hypoxia.
Results: While substantial inter-subject variability remained, PETCO2 correction reduced variability and improved reliability.
Impact: Minimizing and correcting for concurrent changes in PETCO2 during a mild inhaled hypoxic stimulus improves the reliability of hypoxic cerebrovascular reactivity, but normal inter-subject variability and the utility of hypoxic cerebrovascular reactivity in clinical populations have yet to be determined.
Introduction
Hypercapnic cerebrovascular reactivity (HC-CVR) is a robust biomarker of cerebrovascular disease, and hypoxic cerebrovascular reactivity (HX-CVR) may provide complementary but distinct insight into cerebrovascular health due to the physiological significance of oxygen1,2. While increased cerebral blood flow during hypercapnia and severe hypoxia has been well-characterized, the response to mild hypoxic hypoxia is underexplored due to its smaller magnitude and inter-subject inhomogeneity2–4. The few existing HX-CVR MRI studies report increased, unchanged, and decreased blood flow across subjects, but it is unclear whether these studies accounted for important sources of physiological variability2,5–7.For HX-CVR to be a meaningful and specific metric, the effects of hypoxia need to be separated from concomitant changes in CO2: even small decreases in arterial CO2 can evoke significant vasoconstriction, potentially obscuring the cerebrovascular response to hypoxia. We used a state-of-the-art computer-controlled gas blending system to minimize concurrent CO2 changes during hypoxia and further applied a correction factor to improve repeatability and physiological interpretation of HX-CVR.
Data Collection
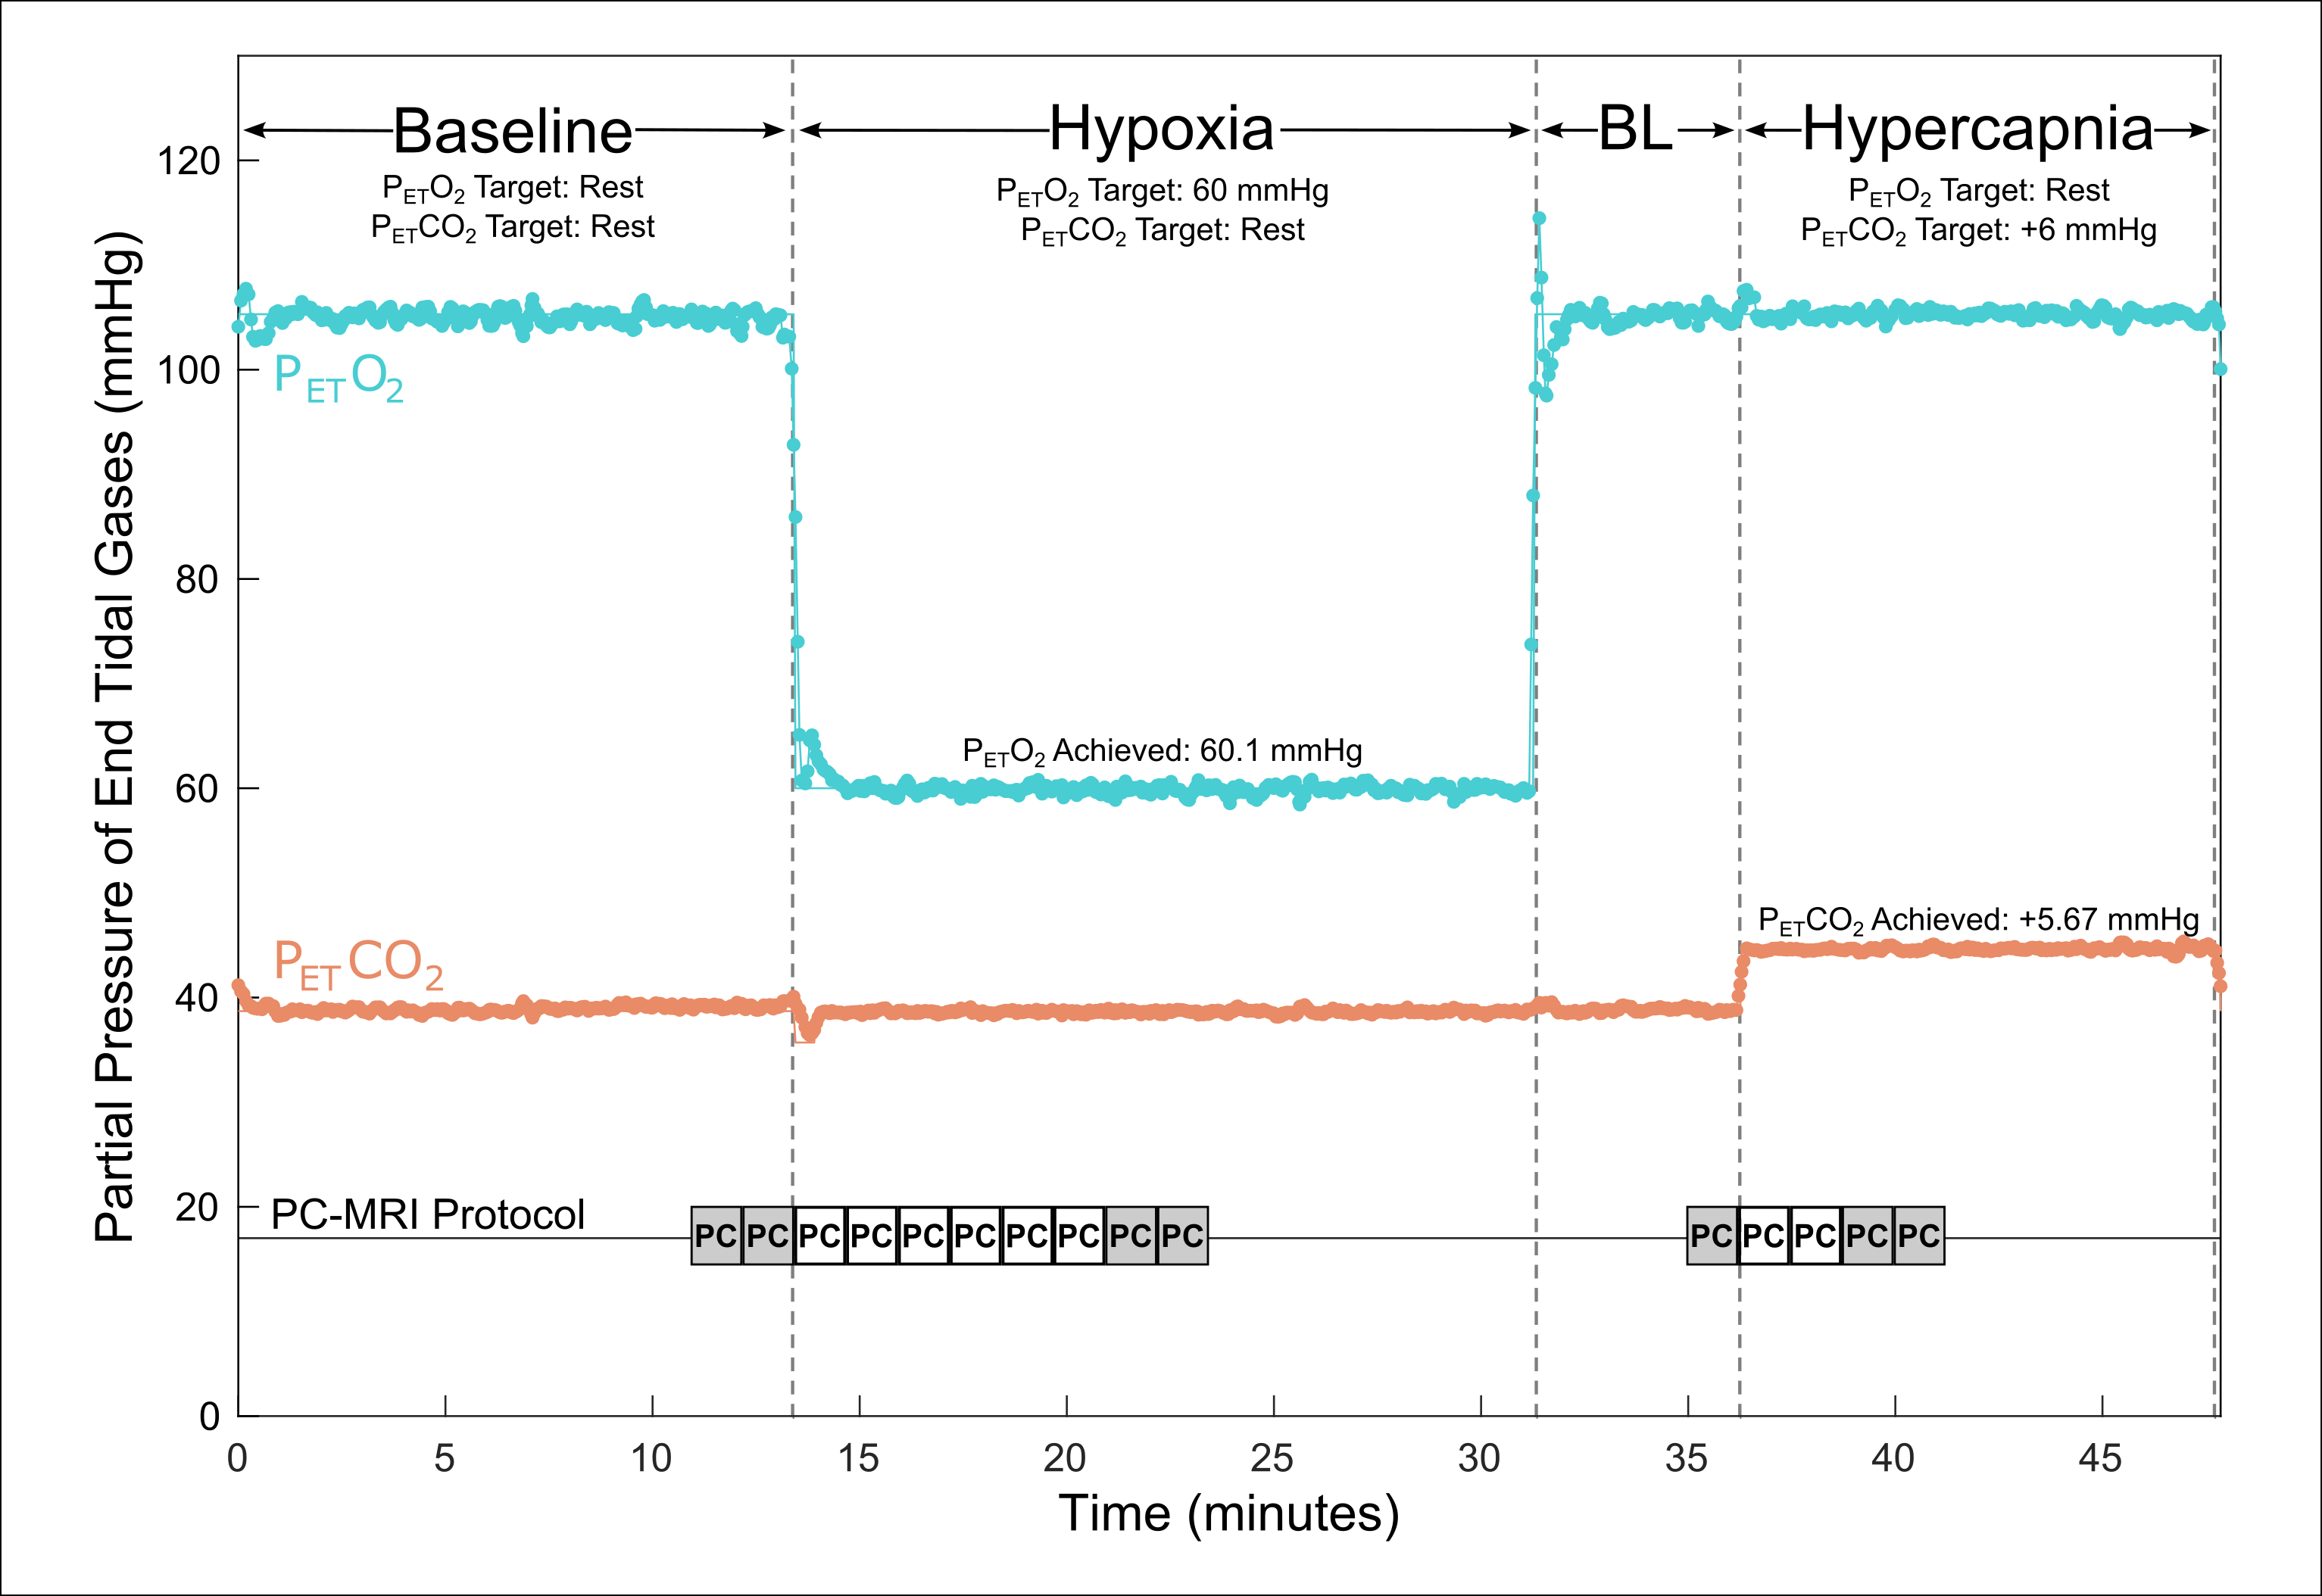
12 participants (7F, 29.9±8.2y) were scanned twice, 21.6(±5.6) days apart, on a Siemens Prisma 3T scanner with a 32-ch head coil. Subjects were fitted with a non-rebreathing facemask connected to a computer-controlled gas blending system (RespirAct™, Thornhill Medical) for precise end-tidal targeting of four respiratory phases: baseline, hypoxia, baseline (BL), and hypercapnia (Fig.1). Informed by a 3D time-of-flight angiogram, a phase-contrast (PC) imaging slice was positioned perpendicular to internal carotid and vertebral arteries. Consecutive retrospectively-gated PC-MRI (TR/TE=47.52/3.45ms, FOV=166mm, resolution=0.5x0.5x5.0mm3, venc=100cm/s, single-slice, acquisition time=~1:30) were acquired in different periods of the gas protocol (Fig.1). SpO2 was recorded at the start of each PC acquisition. A T1-weighted image was acquired for calculation of intracranial volume (ICV).Data Analysis
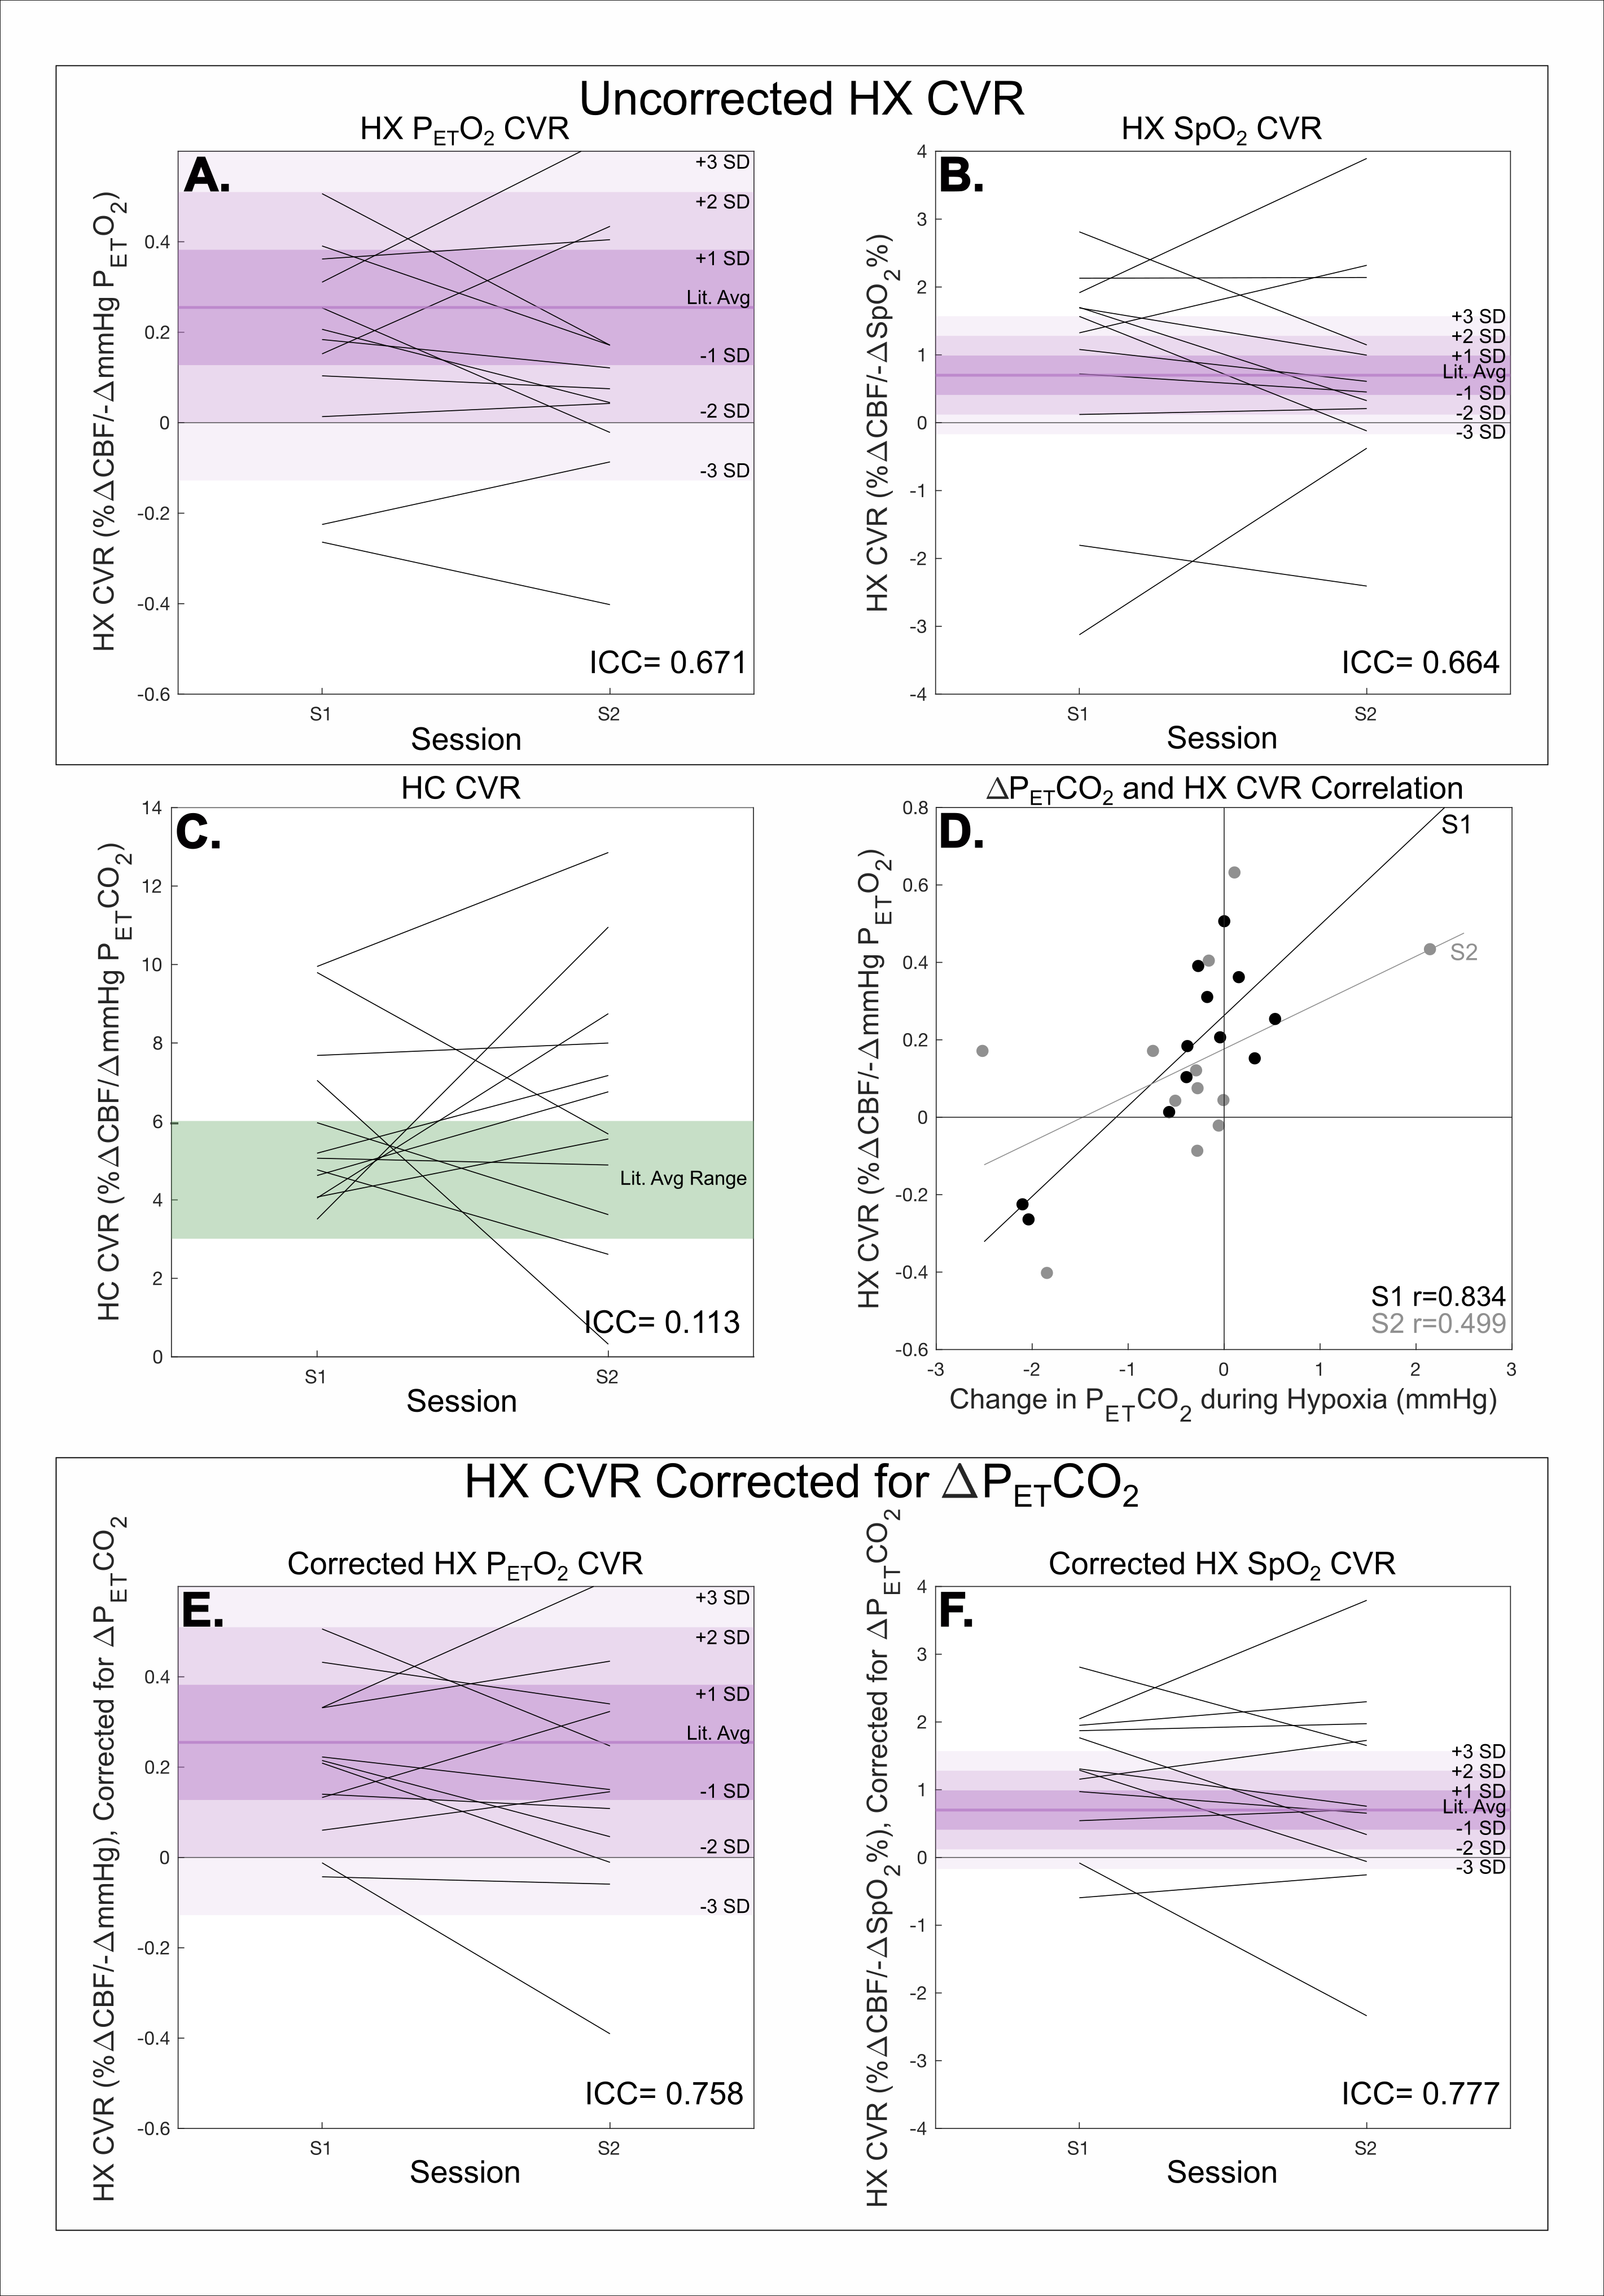
The session-1 T1 image was segmented (FSL-FAST). White- and grey-matter volumes were summed to calculate ICV for each participant. PC-MRI were processed with in-house software: 1) internal carotid and vertebral artery ROIs were selected, 2) for each vessel, mean velocity and vessel area across eight cardiac bins were multiplied to estimate blood flow, 3) flows across the four vessels were summed and normalized to ICV, producing total cerebral blood flow (CBF) in units of mL/100g/min. For each respiratory state, CBF was calculated from the steady-state PC-MRI. End-tidal O2 (PETO2) and CO2 (PETCO2) values for each acquisition were calculated as the average across the PC scan time. HX-CVR and HC-CVR were calculated as the percentage change in CBF divided by the change in PETO2, SpO2, or PETCO2, in accordance with literature5,7,8.We observed unintentional changes in PETCO2 during hypoxia that correlated with HX-CVR. Based on this relationship, hypoxic CBF (and in turn, HX-CVR) was corrected for such changes in PETCO2 (Eq.1) using the participant’s session-specific HC-CVR (Eq.2). Intraclass correlation coefficients (ICC) of CVR between sessions and correlation between HC-CVR and HX-CVR were calculated.
$$(\Delta P_{ET}CO_2)_{hx}=(P_{ET}CO_2)_{hx}-(P_{ET}CO_2)_{bl} \tag{Eq.1}$$
$$CBF_{hx,corr}=CBF_{hx,uncorr}-[(\Delta P_{ET}CO_2)_{hx}*(CVR)_{hc}]\tag{Eq.2}$$
Results
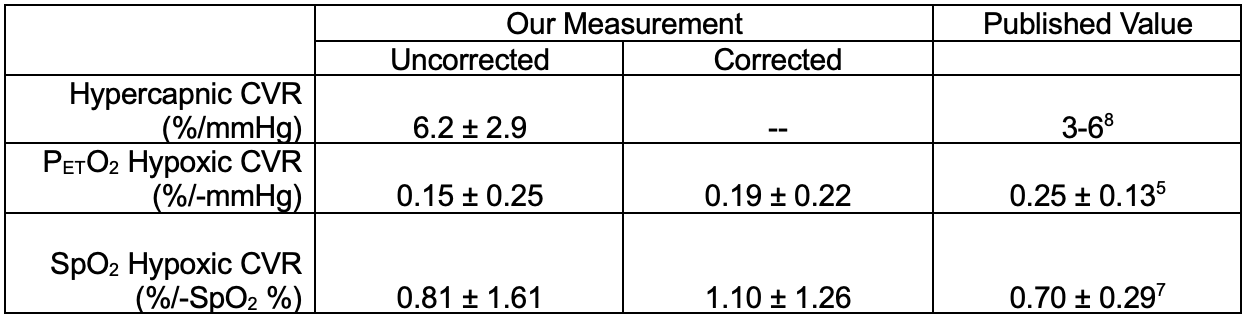
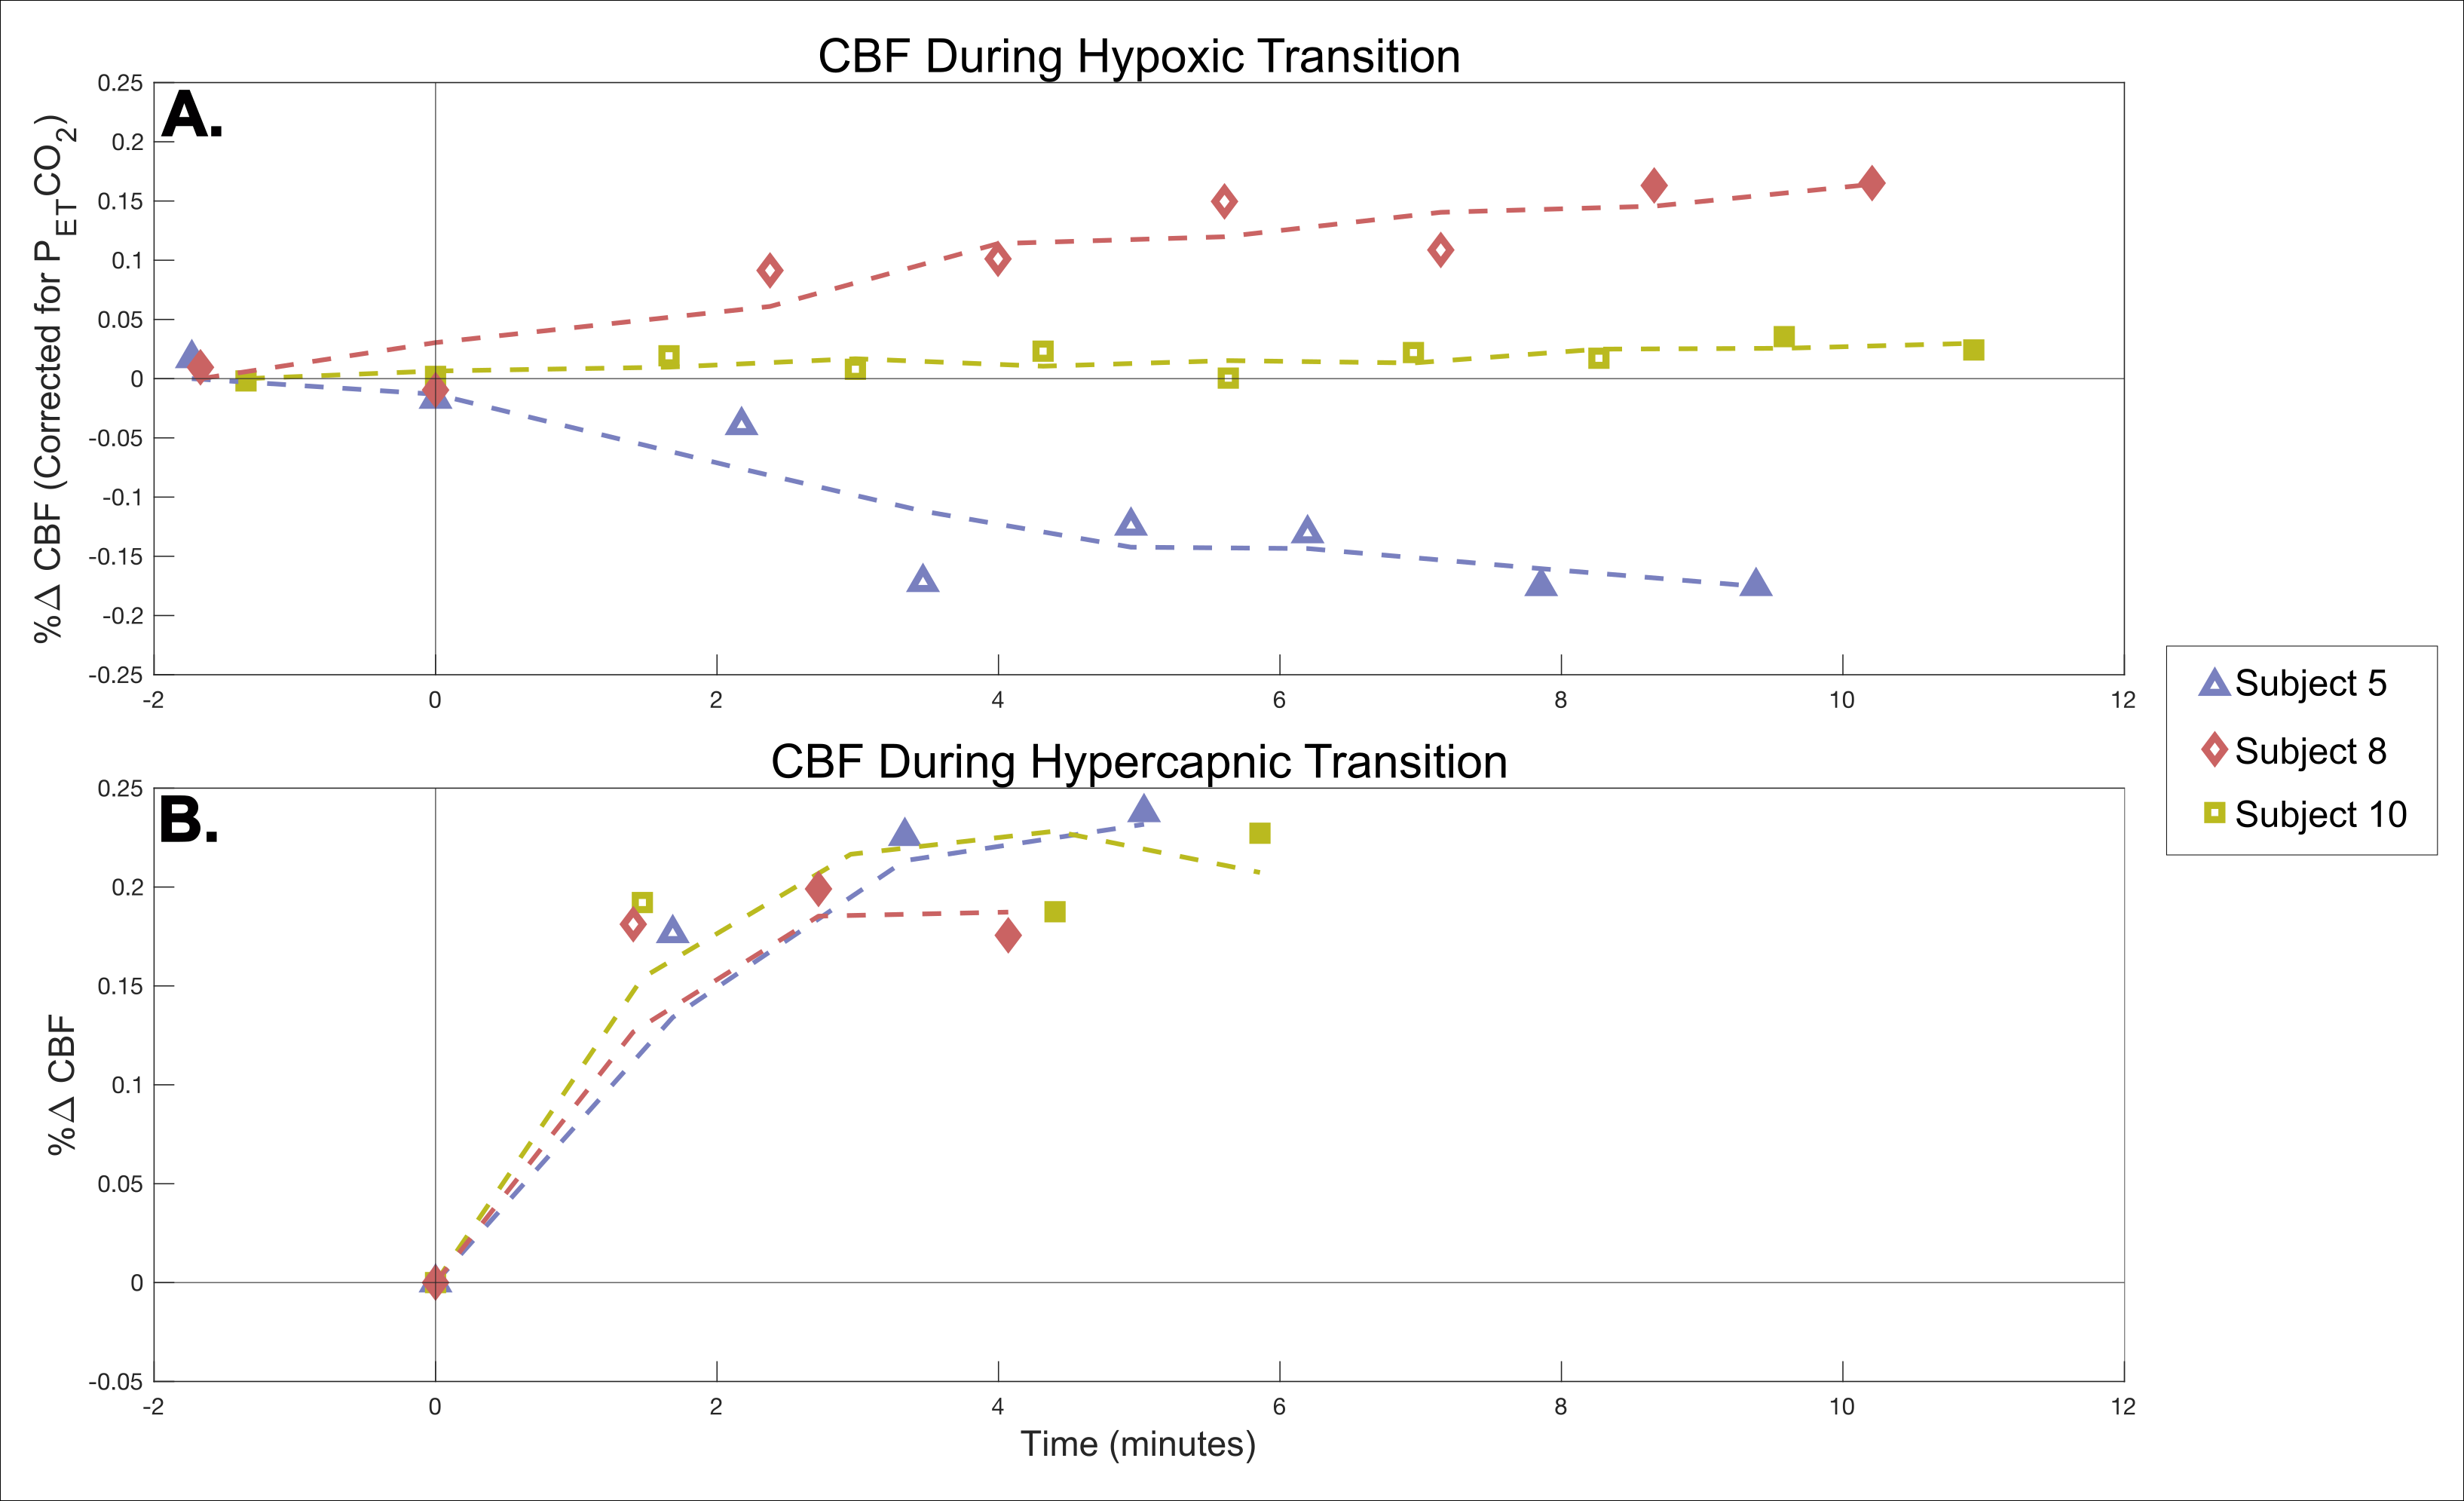
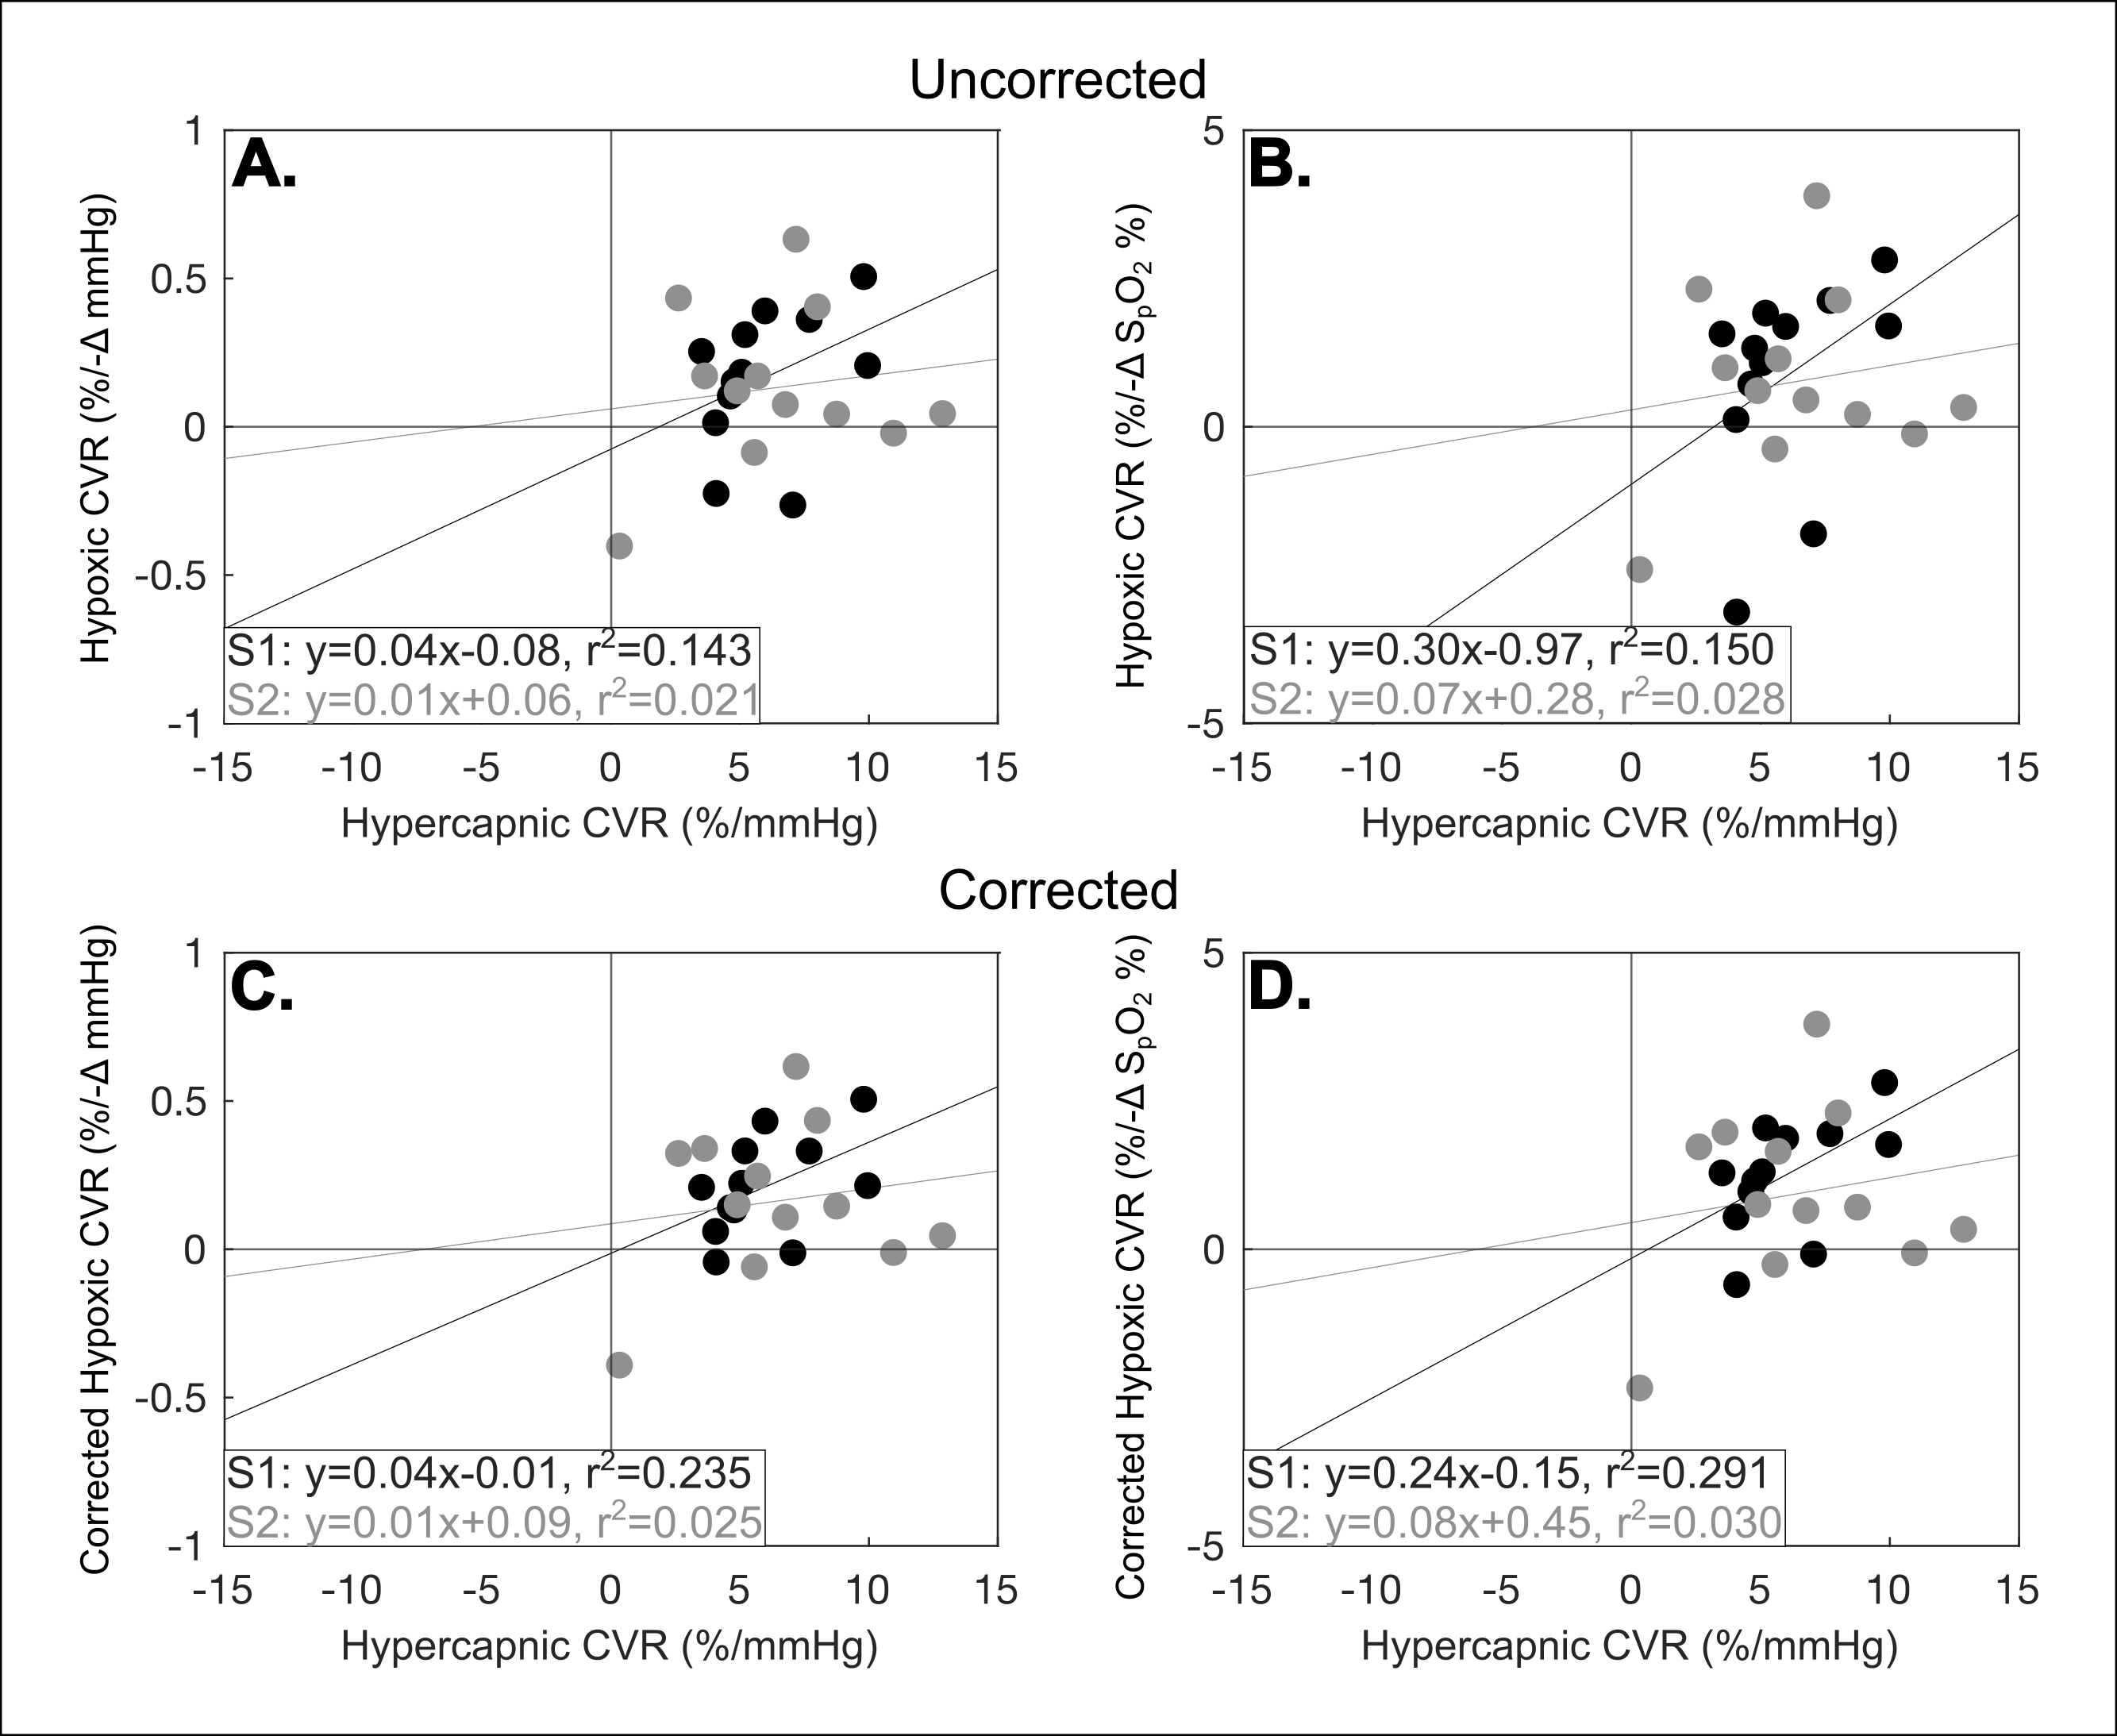
Average HC-CVR and HX-CVR from this study are compared to published values in Table1; variability in HC-CVR and HX-CVR across subjects and sessions is shown in Fig2A-C. ICCs for uncorrected PETO2 and SpO2 HX-CVR are 0.671 and 0.664, respectively. Changes in PETCO2 during hypoxia were correlated with uncorrected HX-CVR in both sessions (Fig.2D). ICCs for corrected PETO2 and SpO2 HX-CVR are 0.758 and 0.777, respectively (Fig.2E-F). Repeated PC-MRI CBF measurements during transitions to hypoxia and hypercapnia (Fig.3A-B) demonstrate that CVR estimates are reflective of steady-state physiology rather than reflecting the transition. HC-CVR and HX-CVR (Fig.4) demonstrate residual correlation, even in corrected HX-CVR data.Discussion
Although the overall mean HX-CVR is positive, some individuals exhibited no change or a decrease in CBF, in agreement with previous reports5–7. The consistency of these responses during the transition to hypoxia, and the positive HC-CVR in all subjects, suggests that this intersubject variability in HX-CVR is not due to transient hemodynamics, measurement error, or compromised vasodilatory capacity.Despite using a state-of-the-art gas blending system, we observed small changes in PETCO2 during hypoxia which were correlated with HX-CVR. We therefore implemented a simple correction for such changes in PETCO2 and calculated corrected HX-CVR. Although substantial inter-subject variability remained and warrants further investigation, correcting for CO2 changes improved the reliability of HX-CVR from moderate to good9, indicating it is a repeatable metric.
Increased correlations between HX-CVR and HC-CVR following PETCO2 correction may be a by-product of our correction method but may also signify that healthy individuals with greater HC-CVR have greater HX-CVR. Further investigation in clinical cohorts could determine the significance of this relationship. However, the low R2 values observed indicate these metrics are likely distinct measures of vascular health.
Acknowledgements
Thanks to Rachael Young and the staff at the Center for Translational Imaging (CTI), Northwestern Radiology, and members of the Bright Lab for help with study setup, and to Andrew Vigotsky for statistical advice. This research was supported by the National Institutes of Health’s National Institute of Neurological Disorders and Stroke, Grant Number 1R21NS121742-02. The content is solely the responsibility of the authors and does not necessarily represent the official views of the National Institutes of Health. HRJ was supported by an NIH-funded training program (T32EB025766).References
1. Reinhard, M. et al. Cerebrovascular reactivity predicts stroke in high-grade carotid artery disease. Neurology83, 1424–1431 (2014).
2. Corfield, D. R. & McKay, L. C. Regional Cerebrovascular Responses to Hypercapnia and Hypoxia. in Hypoxia: Translation in Progress (eds. Roach, R. C., Hackett, P. H. & Wagner, P. D.) 157–167 (Springer US, 2016). doi:10.1007/978-1-4899-7678-9_11.
3. Kety, S. S. & Schmidt, C. F. THE EFFECTS OF ALTERED ARTERIAL TENSIONS OF CARBON DIOXIDE AND OXYGEN ON CEREBRAL BLOOD FLOW AND CEREBRAL OXYGEN CONSUMPTION OF NORMAL YOUNG MEN. https://www.jci.org/articles/view/101995/scanned-page/484 (1948) doi:10.1172/JCI101995.
4. Poulin, M. J., Liang, P. J. & Robbins, P. A. Dynamics of the cerebral blood flow response to step changes in end-tidal PCO2 and PO2 in humans. Journal of Applied Physiology 81, 1084–1095 (1996).
5. Harris, A. D. et al. Cerebral blood flow response to acute hypoxic hypoxia. NMR in Biomedicine 26, 1844–1852 (2013).
6. Binks, A. P., Cunningham, V. J., Adams, L. & Banzett, R. B. Gray matter blood flow change is unevenly distributed during moderate isocapnic hypoxia in humans. J Appl Physiol (1985) 104, 212–217 (2008).
7. Nöth, U., Kotajima, F., Deichmann, R., Turner, R. & Corfield, D. R. Mapping of the cerebral vascular response to hypoxia and hypercapnia using quantitative perfusion MRI at 3 T. NMR in Biomedicine 21, 464–472 (2008).
8. Liu, P., De Vis, J. B. & Lu, H. Cerebrovascular reactivity (CVR) MRI with CO2 challenge: A technical review. NeuroImage 187, 104–115 (2019).
9. Koo, T. K. & Li, M. Y. A Guideline of Selecting and Reporting Intraclass Correlation Coefficients for Reliability Research. Journal of Chiropractic Medicine 15, 155 (2016).
Figures