2476
CSF fraction measured by MR T2 relaxometry is better than PVS load to associate with amyloid beta deposition in 11C-PiB PET1Department of Radiology, Weill Cornell Medicine, New York, NY, United States, 2USC Mark and Mary Stevens Neuroimaging and Informatics Institute, University of Southern California, Los Angeles, CA, United States
Synopsis
Keywords: Neurofluids, Alzheimer's Disease, Biomarker
Motivation: Perivascular space (PVS) enlargement is used to estimate the severity of glymphatic clearance dysfunction in Alzheimer’s disease. There is a lack of imaging tool to estimate the cerebral cortical PVS load.
Goal(s): Investigate the association between the MR T2-relaxometry based CSF fraction (CSFF), a measure of total PVS (including both MR visible and invisible PVS), and PET imaging based Aβ deposition.
Approach: Use 6-echo FAST-T2 image to map CSFF and correlate it with Aβ deposition in both cognitive normal and mild cognitive impaired groups.
Results: CSFF is better than PVS load in association with Aβ deposition in MCI/AD subjects.
Impact: Parenchymal CSF fraction measured using MR T2-relaxometry is an estimate of total perivascular space, which reflect glymphatic clearance function. It has superior performance in correlation with Aβ deposition than MRI based PVS segmentation.
INTRODUCTION
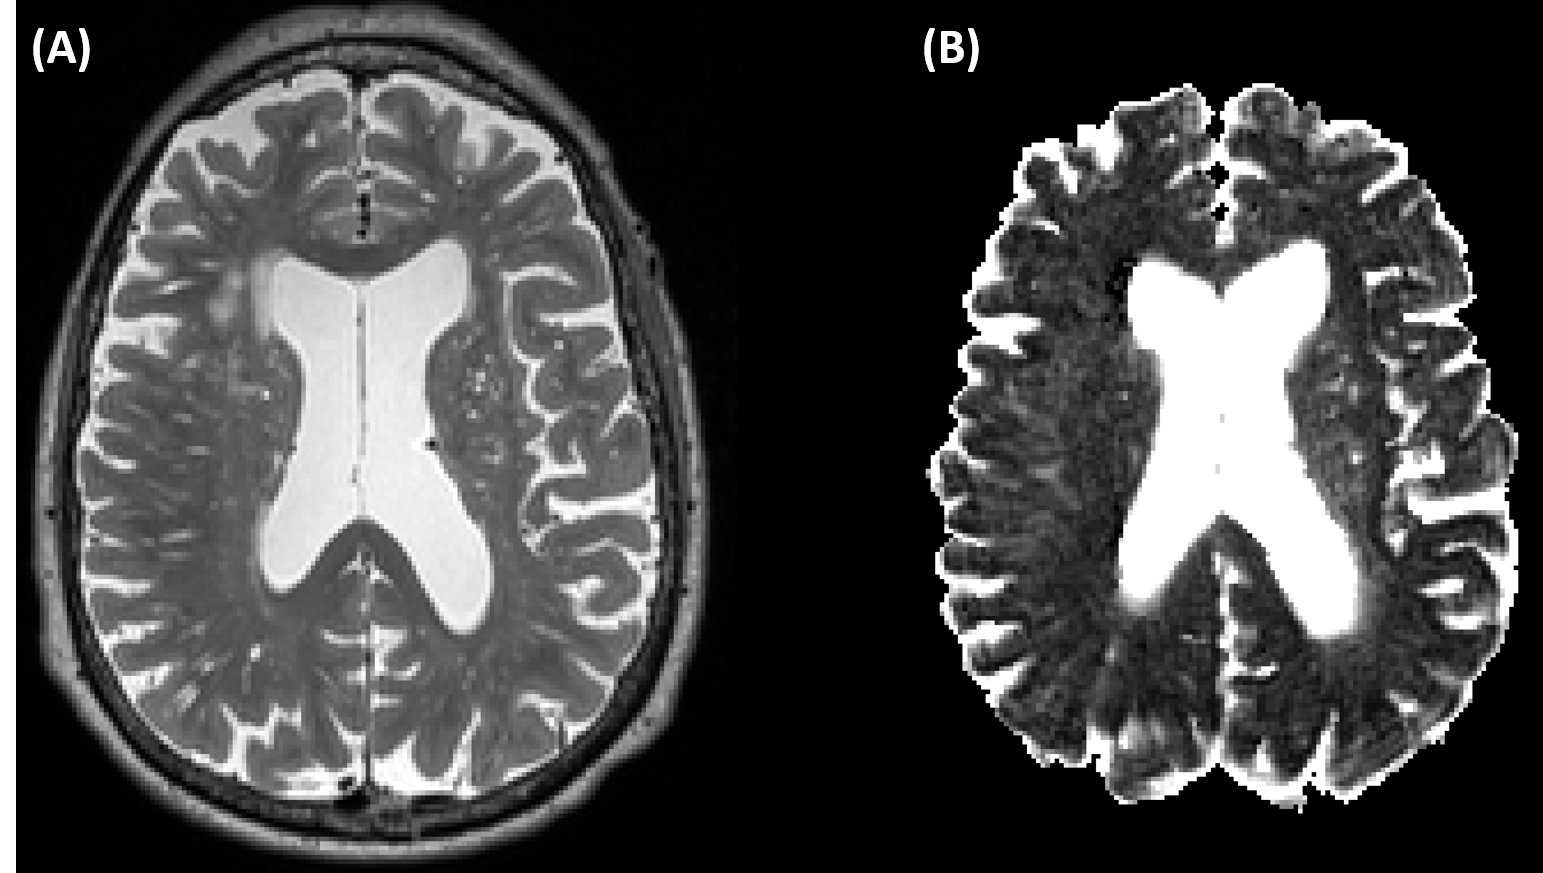
Glymphatic clearance dysfunction is considered the cause of beta-amyloid (Aβ) deposition in Alzheimer’s disease (AD). Perivascular space (PVS) is the key pathway of glymphatic clearance. The dilation of PVS reflects the fluid stasis and glymphatic clearance dysfunction. The typical approach to quantify PVS load is the segmentation of hyperintensity spots on T2w in the cerebral white matter (WM). However, the PVS is everywhere surrounding small blood vessels (arteriole, capillary, venule) in both WM and cerebral gray matter (GM). The PVS segmented in WM is inherently an underestimation of total PVS and ignores the PVS at subvoxel level, which may result in an inaccurate estimation of glymphatic clearance dysfunction and worsen its association with the Aβ pathology. Given that the fluid in PVS is CSF-like fluid and freely movable, we have developed an MR T2 relaxometry based three water compartmental model for CSF fraction mapping using FAST-T2 sequence,1 which maps the long T2 (T2>200 ms) component of total water in voxel.2 In this study, we investigated the association between Aβ deposition measured by 11C-PiB PET and CSFF, and compare it with PVS load.METHODS
A total of 39 subjects underwent brain MRIs on a Siemens Prisma 3T scanner using a product 64-channel head/neck receiver coil. The brain imaging protocol consisted of 3D T1W-MPRAGE and 2D T2W-SPACE sequences for anatomical structure, as well as 3D FAST-T2 sequence for CSF fraction (CSFF) mapping. The 3D axial FAST-T2 was acquired with spiral TR/TE = 7.8/0.5 ms, nominal T2prep times = 0 (T2-prep turned off), 7.5, 17.5, 67.5, 147.5, and 307.5 ms, voxel size = 1.3 × 1.3 ×2 mm3, scan time = 7 min. PiB PET scanning used a Siemens Biograph mCT–S (64) slice PET/CT for SUVR calculation. The CSFF was reconstructed with 6-TE FAST-T2 data and correlated with Aβ deposition in Aβ prone ADmask.2,3 PVS was segmented using recently proposed deep learning based weakly supervised UNet automatic segmentation method and then normalized by WM volume.4 The association between PVS load and Aβ deposition was compared with the performance of CSFF. Age and gender were controlled for all the analysis. Phantom experiments were conducted to validate the consistency between CSFF and free water. We conducted phantom experiments with 6 different Gd concentration to mimic various T2 time of fluid. We mix multi-echo T2 signal of different Gd concentration and using our reconstruction algorithm to separate the mixed signal.RESULTS
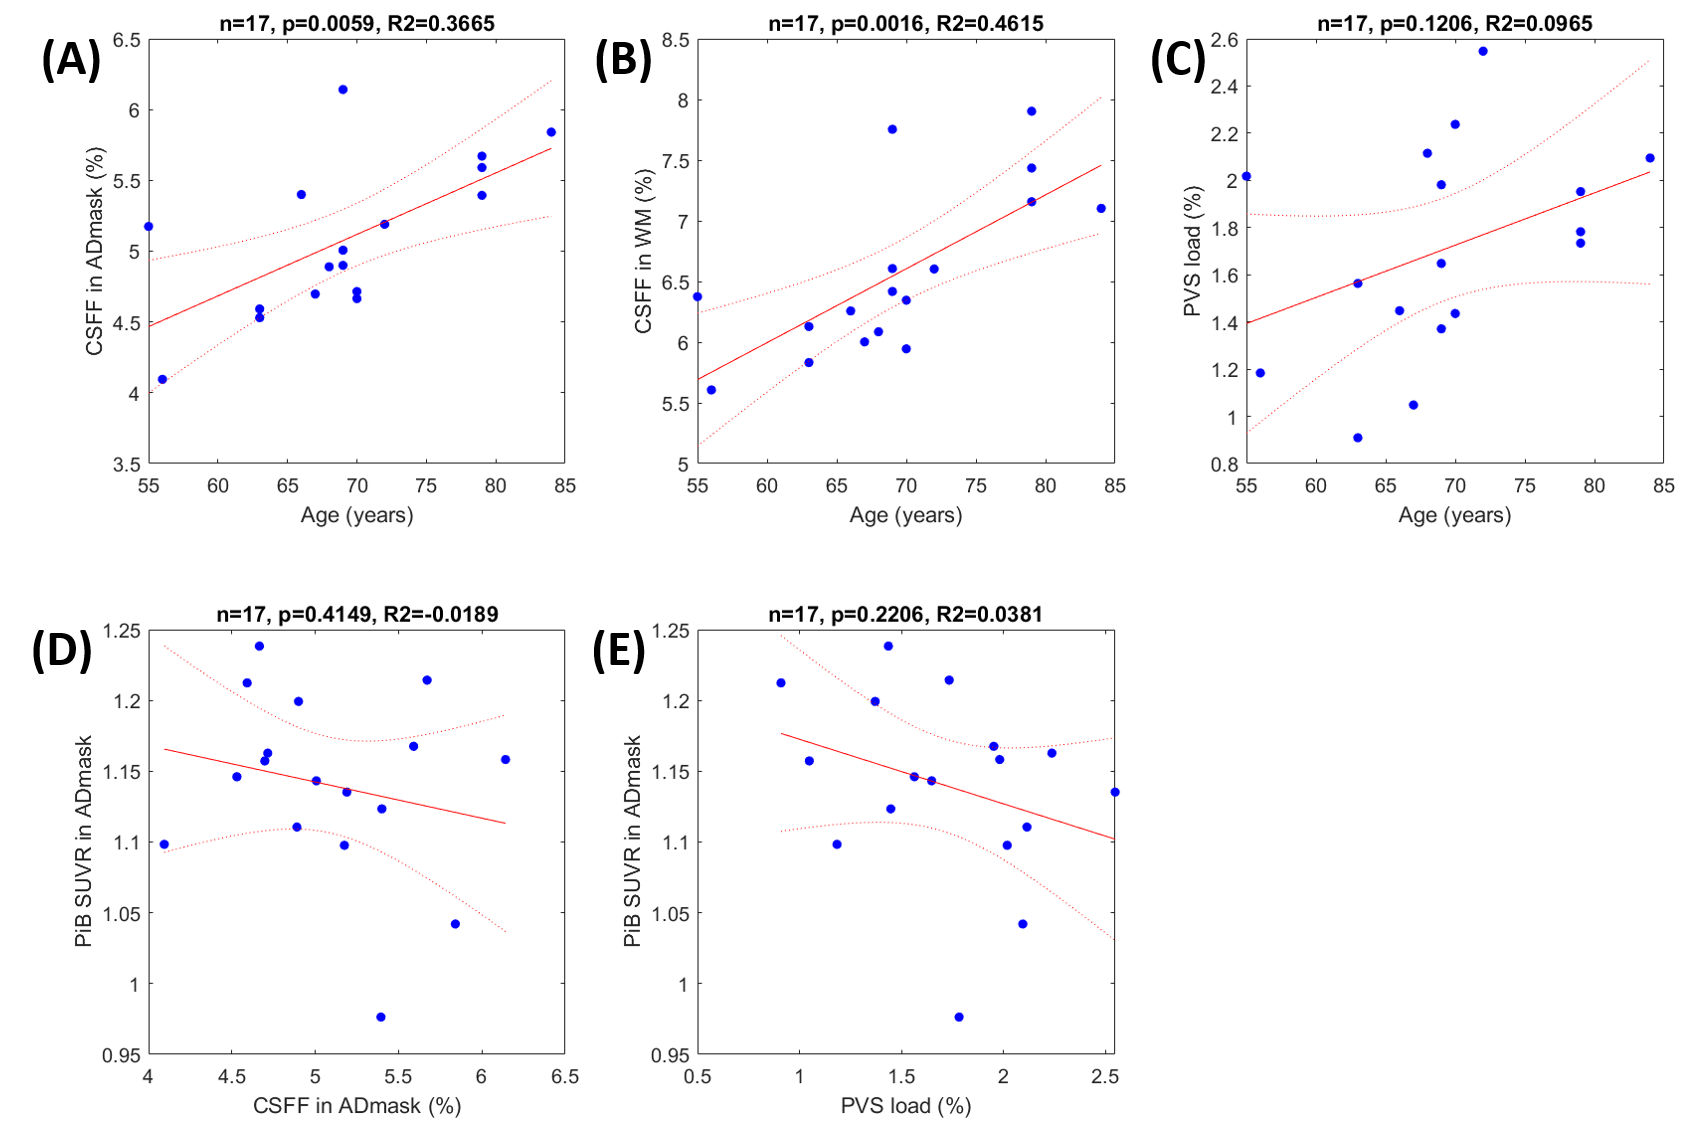
1) Phantom experiments. The mixed signal of 95% signal from Gd with concentration of 0.005 mmol/L (T2=78 ms) and 5% signal from pure water (T2=2700 ms) were separated with 5.5% (0.27 over 5) relative error at SNR=150.2) Clinic results. There is no age and gender difference between CN and MCI/AD groups, specifically, 17 CN has 69.75±7.91 years old; and 22 MCI/AD has 70.64±10.50 years old. Figure 2 (A)-(C) show the age effect of CSFF in ADmask (p<0.05, R2=0.367), WM (p<0.05, R2=0.462) and normalized PVS load (p=0.121, R2=0.097). (D)-(E) show the regression between PiB SUVR in ADmask and CSFF (p=0.415, R2=0.019) and PVS load (p=0.221, R2=0.038), respectively.
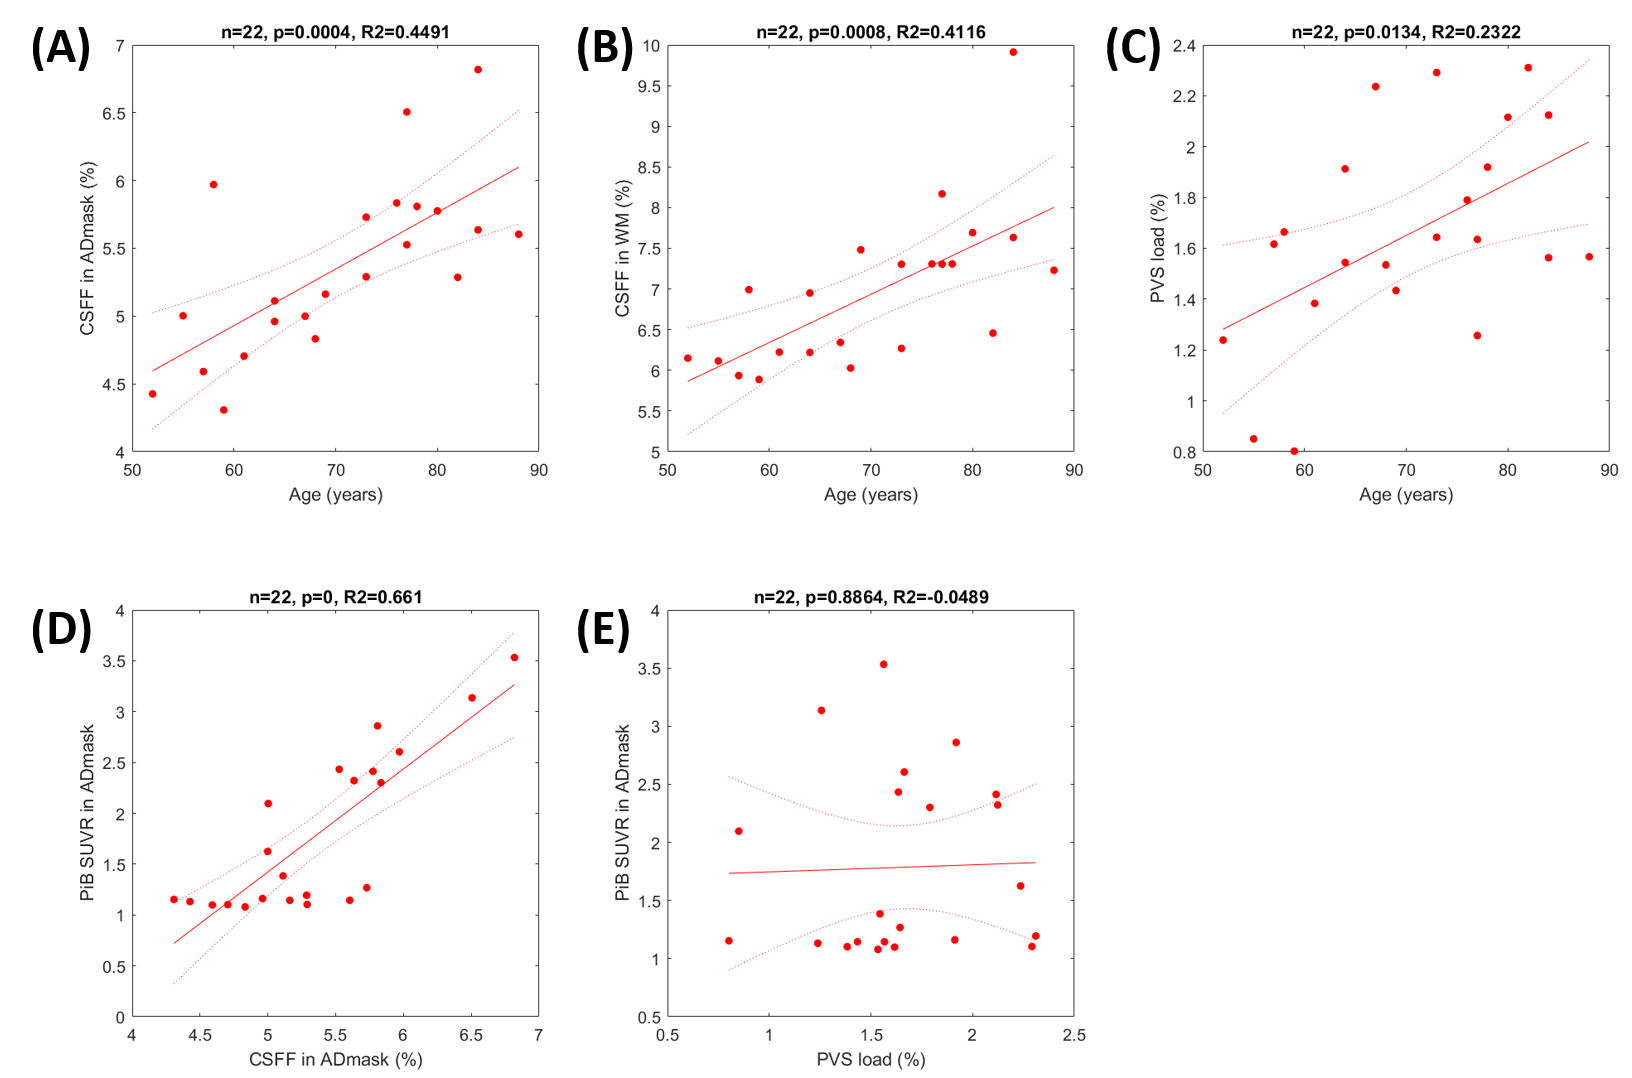
Figure 3 (A)-(C) show the age effect of CSFF in ADmask (p<0.05, R2=0.449), WM (p<0.05, R2=0.412) and normalized PVS load (p<0.05, R2=0.232). (D)-(E) show the regression between PiB SUVR in ADmask and CSFF (p<0.05, R2=0.661) and PVS load (p=0.886, R2=0.049), respectively.
DISCUSSION
We have presented the positive association between parenchymal CSFF in ADmask and Aβ deposition in MCI/AD subjects indicating a fluid stasis in PVS and glymphatic clearance dysfunction. Phantom experiments show that our CSFF mapping, theoretically maps the free water in brain tissue, works well by fitting the total signal into water components by constraining the T2 distribution. Long T2 signal corresponding to the freely movable fluid, which matches well with the glymphatic fluid in PVS. In both CN and MCI/AD groups, we observed the aging effect of increased CSFF in both ADmask and WM, which is consistent with our previous findings.2 However, the PVS segmentation from WM only increases significantly with age in MCI/AD group. In CN group, both CSFF in ADmask and PVS load are not associated with the Aβ deposition measured using PiB PET since there is no Aβ deposition and the PiB measurements are much affected by the noise floor. In MCI/AD group, Aβ deposition is positively associated with CSFF in ADmask showing the effect of glymphatic clearance impairment. We didn’t observe significant relationship between Aβ deposition and PVS load, which could be due to the large variation of PVS distribution in patients.CONCLUSION
CSFF could be a potential biomarker for estimating glymphatic clearance in AD research.Acknowledgements
This work was conducted with grants supported by NIH (R01 R56AG058913, R01 AG068398, AG057848, R01AG022374, RF1 AG057570).References
1. Nguyen TD, Deh K, Monohan E, et al. Feasibility and reproducibility of whole brain myelin water mapping in 4 minutes using fast acquisition with spiral trajectory and adiabatic T2prep (FAST-T2) at 3T: Whole Brain Myelin Water Mapping with FAST-T2. Magn Reson Med. 2016;76(2):456-465. doi:10.1002/mrm.258772.
Zhou L, Li Y, Sweeney EM, et al. Association of brain tissue cerebrospinal fluid fraction with age in healthy cognitively normal adults. Front Aging Neurosci. 2023;Vol. 15(1162001). doi:https://doi.org/10.3389/fnagi.2023.11620013.
Mosconi L, Rinne JO, Tsui WH, et al. Increased fibrillar amyloid-β burden in normal individuals with a family history of late-onset Alzheimer’s. Proc Natl Acad Sci. 2010;107(13):5949-5954. doi:10.1073/pnas.09141411074.
Lan H, Lynch KM, Custer R, et al. Weakly supervised perivascular spaces segmentation with salient guidance of Frangi filter. Magn Reson Med. 2023;89(6):2419-2431. doi:10.1002/mrm.29593
Figures