2472
Perivascular space semi-automated segmentation (PVSSAS) of 7T images from patients with and without epilepsy following traumatic brain injury1Department of Computer Science, Mathematics, Physics and Statistics, University of British Columbia, Kelowna, BC, Canada, 2Department of Rehabilitation and Human Performance, Brain Injury Research Centre, Icahn School of Medicine at Mount Sinai, New York, NY, United States, 3Department of Neurology, Icahn School of Medicine at Mount Sinai, New York, NY, United States, 4Department of Diagnostic, Molecular and Interventional Radiology, Icahn School of Medicine at Mount Sinai, New York, NY, United States, 5UBC MRI Research, Department of Radiology, Faculty of Medicine, University of British Columbia, Vancouver, BC, Canada, 6Biomedical Engineering and Imaging Institute, Icahn School of Medicine at Mount Sinai, New York, NY, United States
Synopsis
Keywords: Traumatic Brain Injury, Epilepsy
Motivation: Perivascular spaces (PVSs) are small fluid-filled spaces between blood vessels and pia mater. PVSs may appear differently in traumatic brain injury (TBI) patients with and without post-traumatic epilepsy (PTE) due to their role in waste removal.
Goal(s): To investigate characteristics of PVSs in PTE relative to TBI without PTE and healthy controls.
Approach: A semi-automated workflow for segmenting PVSs was established and applied to images from a 7T MRI study, including 8 TBI patients with PTE, 18 TBI patients without PTE, and 22 healthy controls.
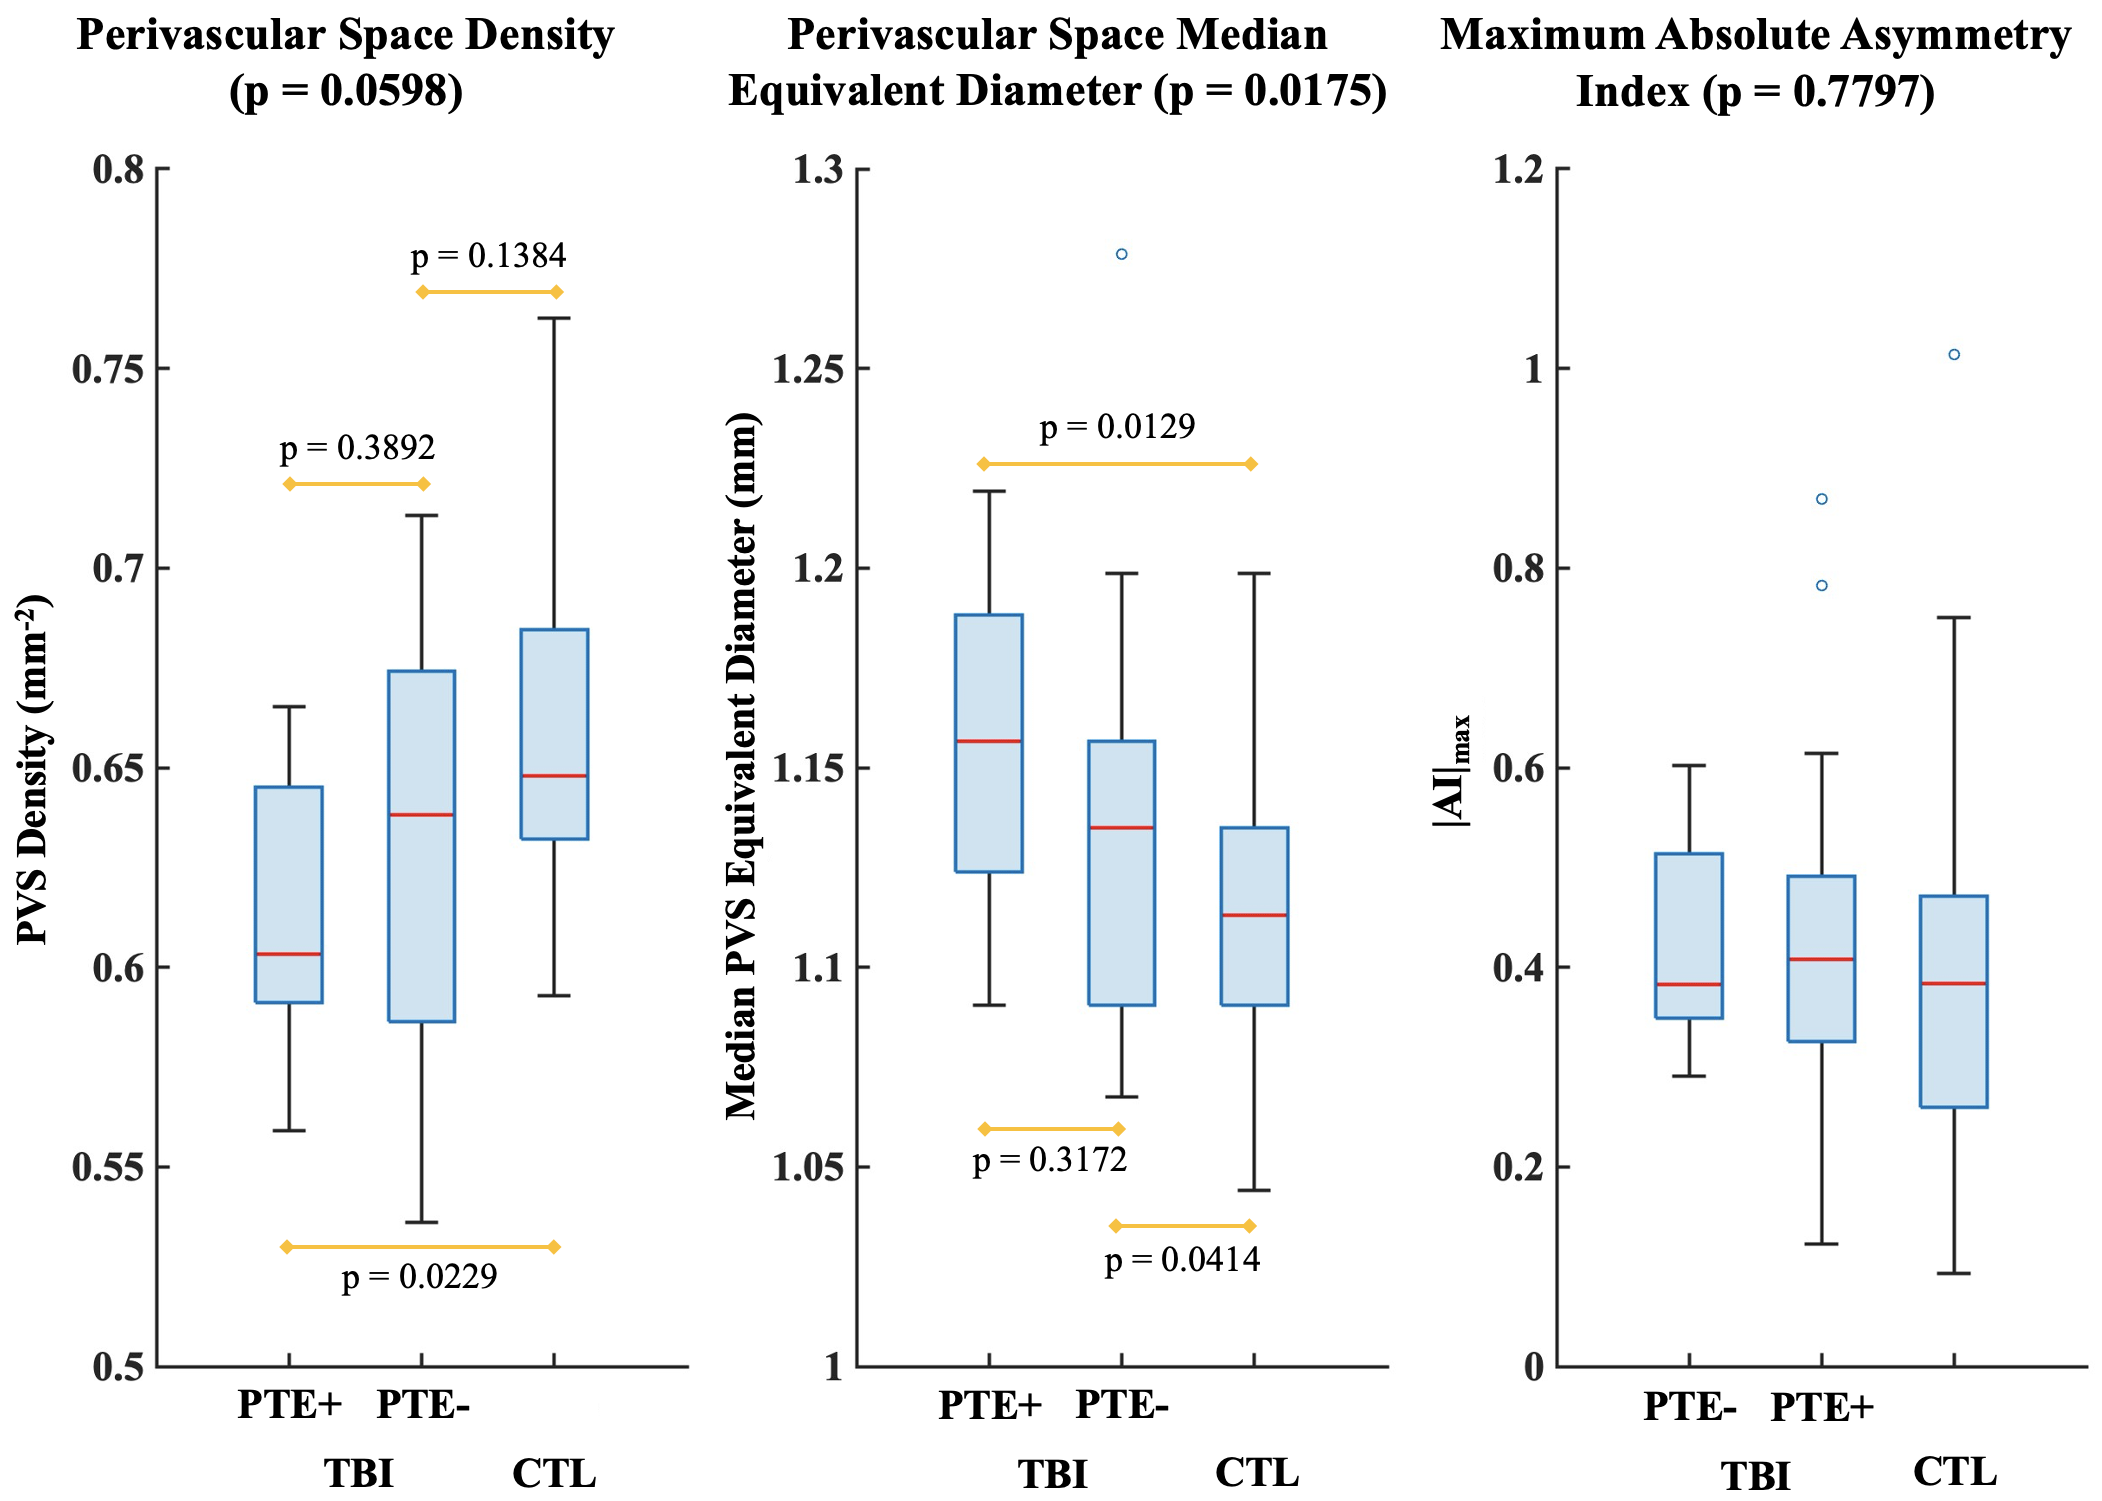
Results: Larger median PVS equivalent diameter was observed in TBI, particularly with PTE, suggesting enlarged PVSs in TBI.
Impact: Identification of increased median perivascular space equivalent diameter in traumatic brain injury, particularly cases that develop post-traumatic epilepsy as shown in this work, may improve diagnosis and prognostication for post-traumatic epilepsy.
Introduction
Traumatic brain injury (TBI) is characterized by focal vascular damage and diffuse axonal injury, and often presents with symptoms such as nausea, headache, and impaired cognitive function that may manifest acutely or over time1. Following injury, the infiltration of inflammatory cytokines and accumulation of metabolic waste leads to cell death2. Up to 50% of severe TBI patients develop post-traumatic epilepsy (PTE)3. Early clinical symptoms of TBI1 and conventional imaging techniques4 have not been predictive of PTE. Further, overlapping side effects of antiseizure medication5 and TBI symptoms2 have hampered treatment and recovery assessment.Perivascular spaces (PVSs) are small cerebrospinal fluid filled spaces between blood vessels and pia mater6,7. Enlarged PVSs may serve as epileptogenic biomarkers as they facilitate waste removal and fluid volume homeostasis6,7. The detectability of PVSs in T2-weighted (T2w) images has been enhanced by 7T MRI8. TBI and epilepsy have demonstrated enlarged PVSs9,10 and increased PVS counts10,11, and epilepsy has further been associated with PVS asymmetry between brain hemispheres12.
The PVS Semi-Automated-Segmentation (PVSSAS) tool employs a Frangi-based detection algorithm to increase the speed and reproducibility of PVS segmentation13. PVSSAS has been used in studies of depression14 and COVID-1915. Here, we use PVSSAS to investigate differences in PVS characteristics between TBI patients with PTE (PTE+) and without PTE (PTE-), and healthy controls (CTL).
Methods
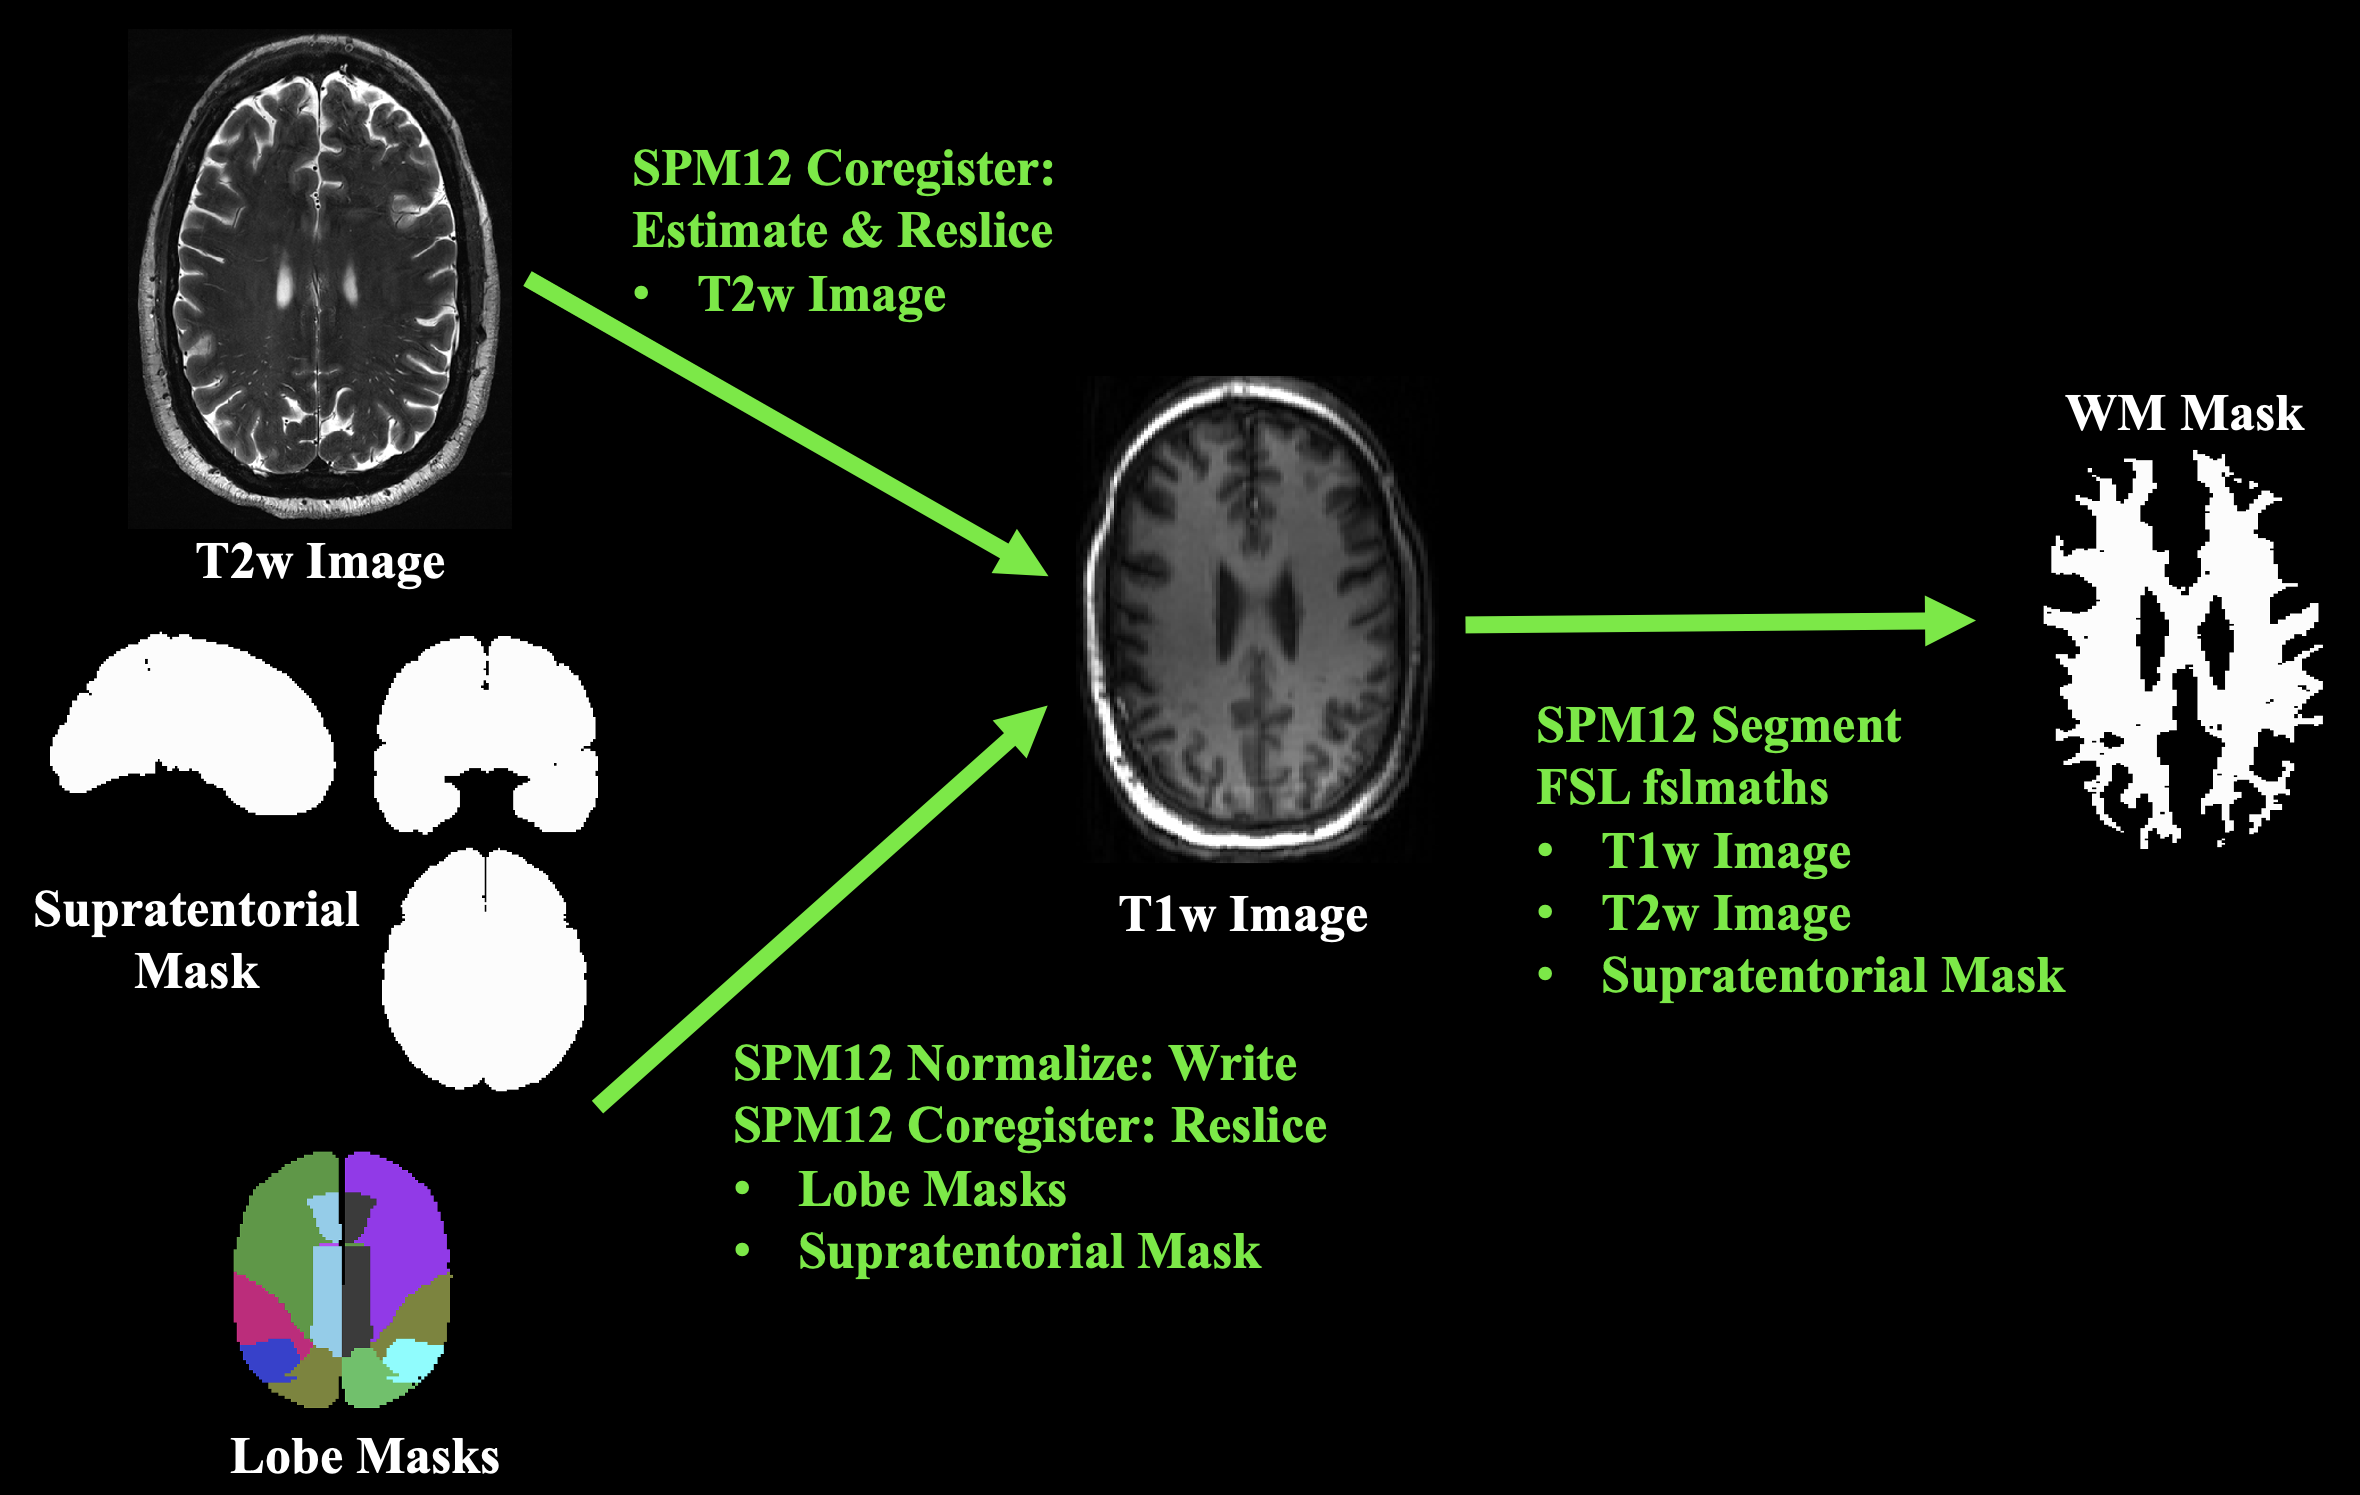
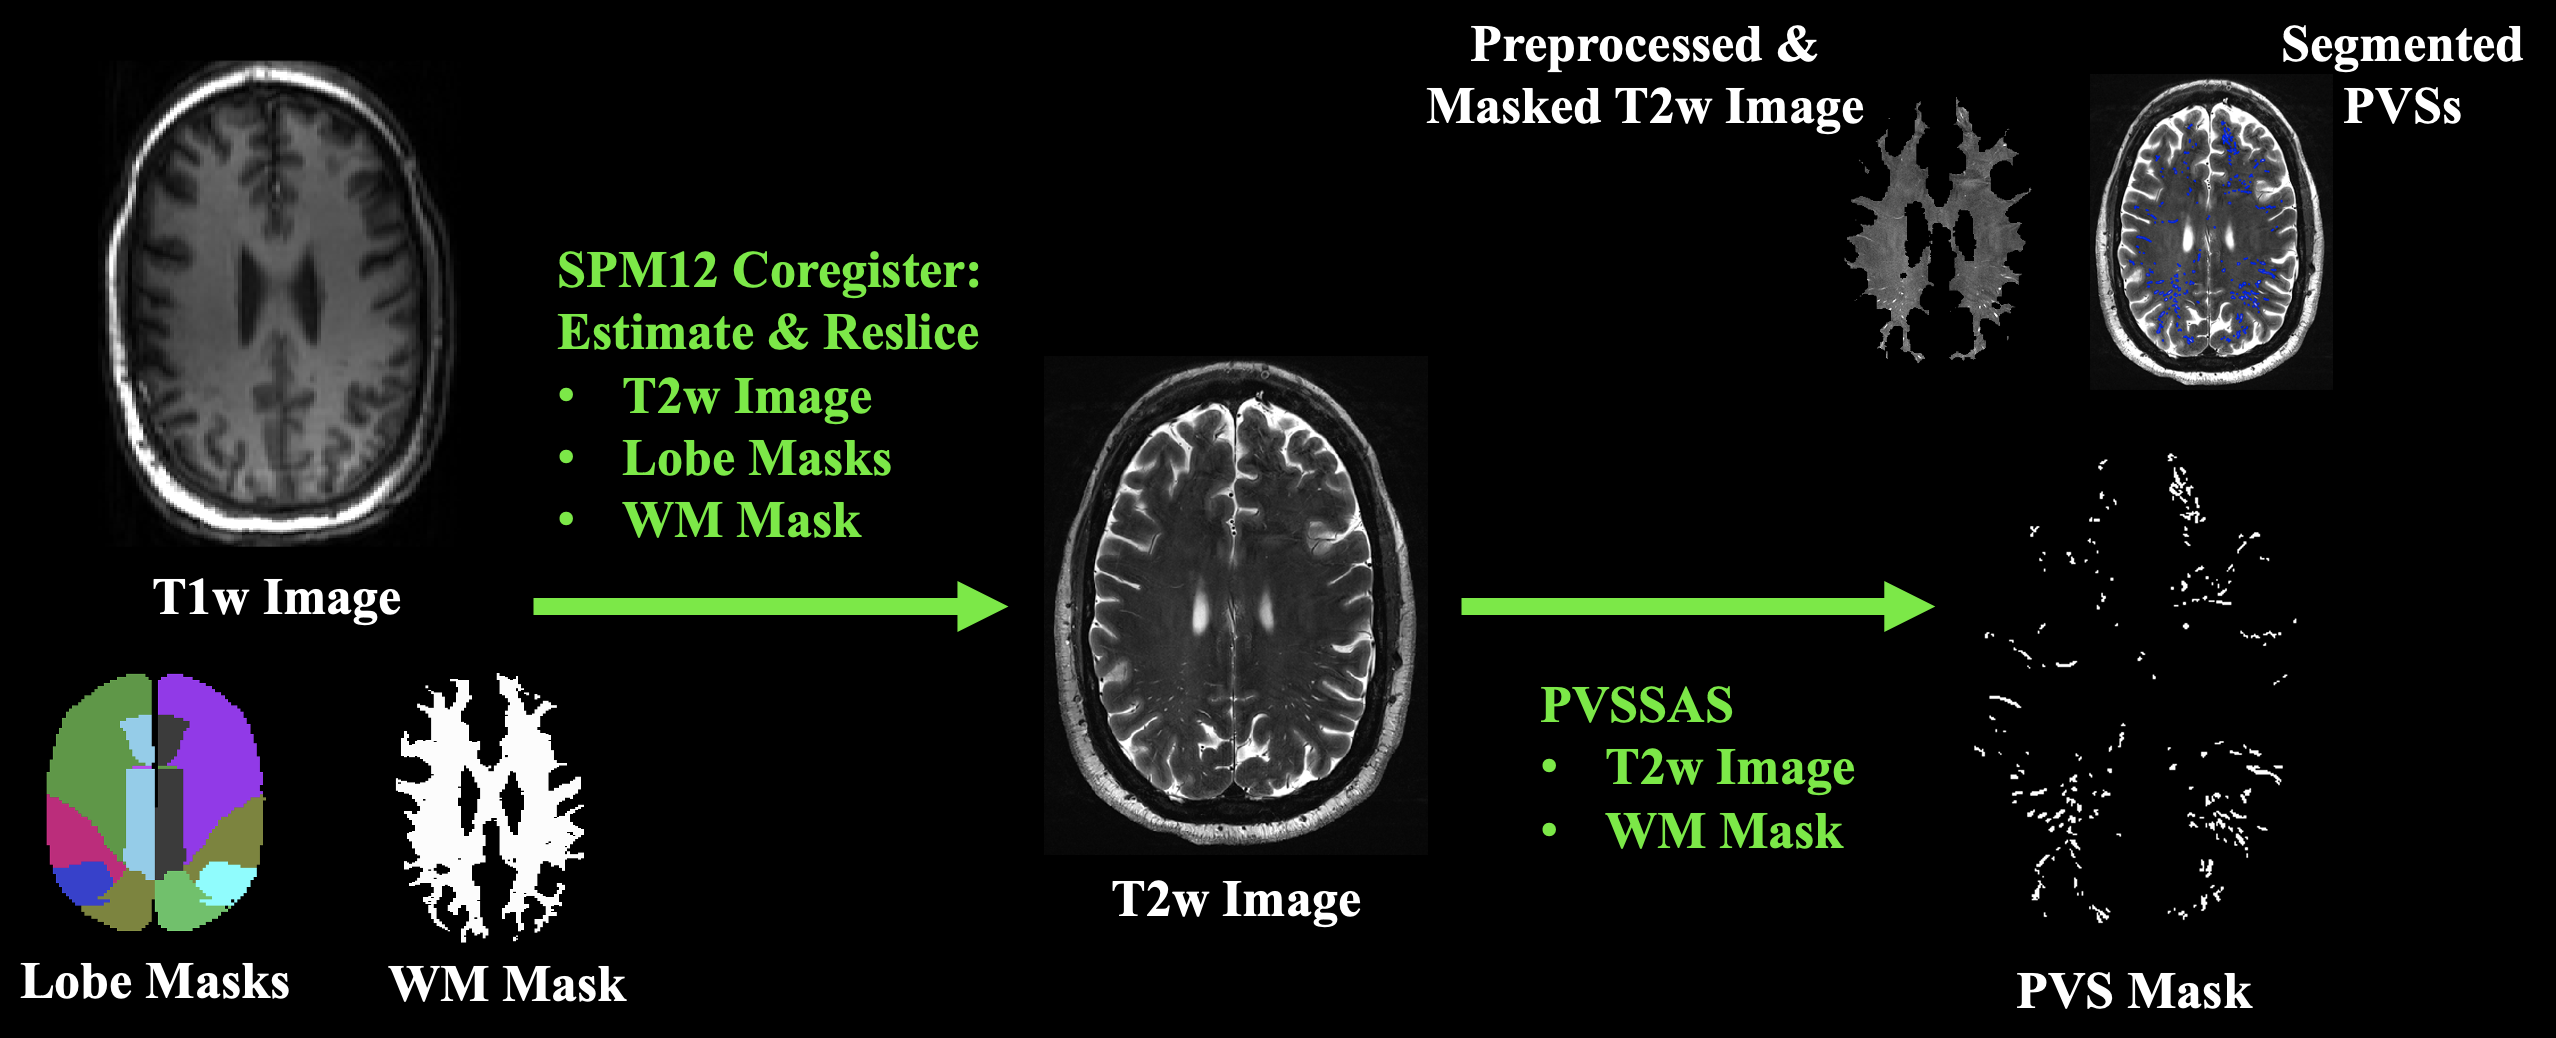
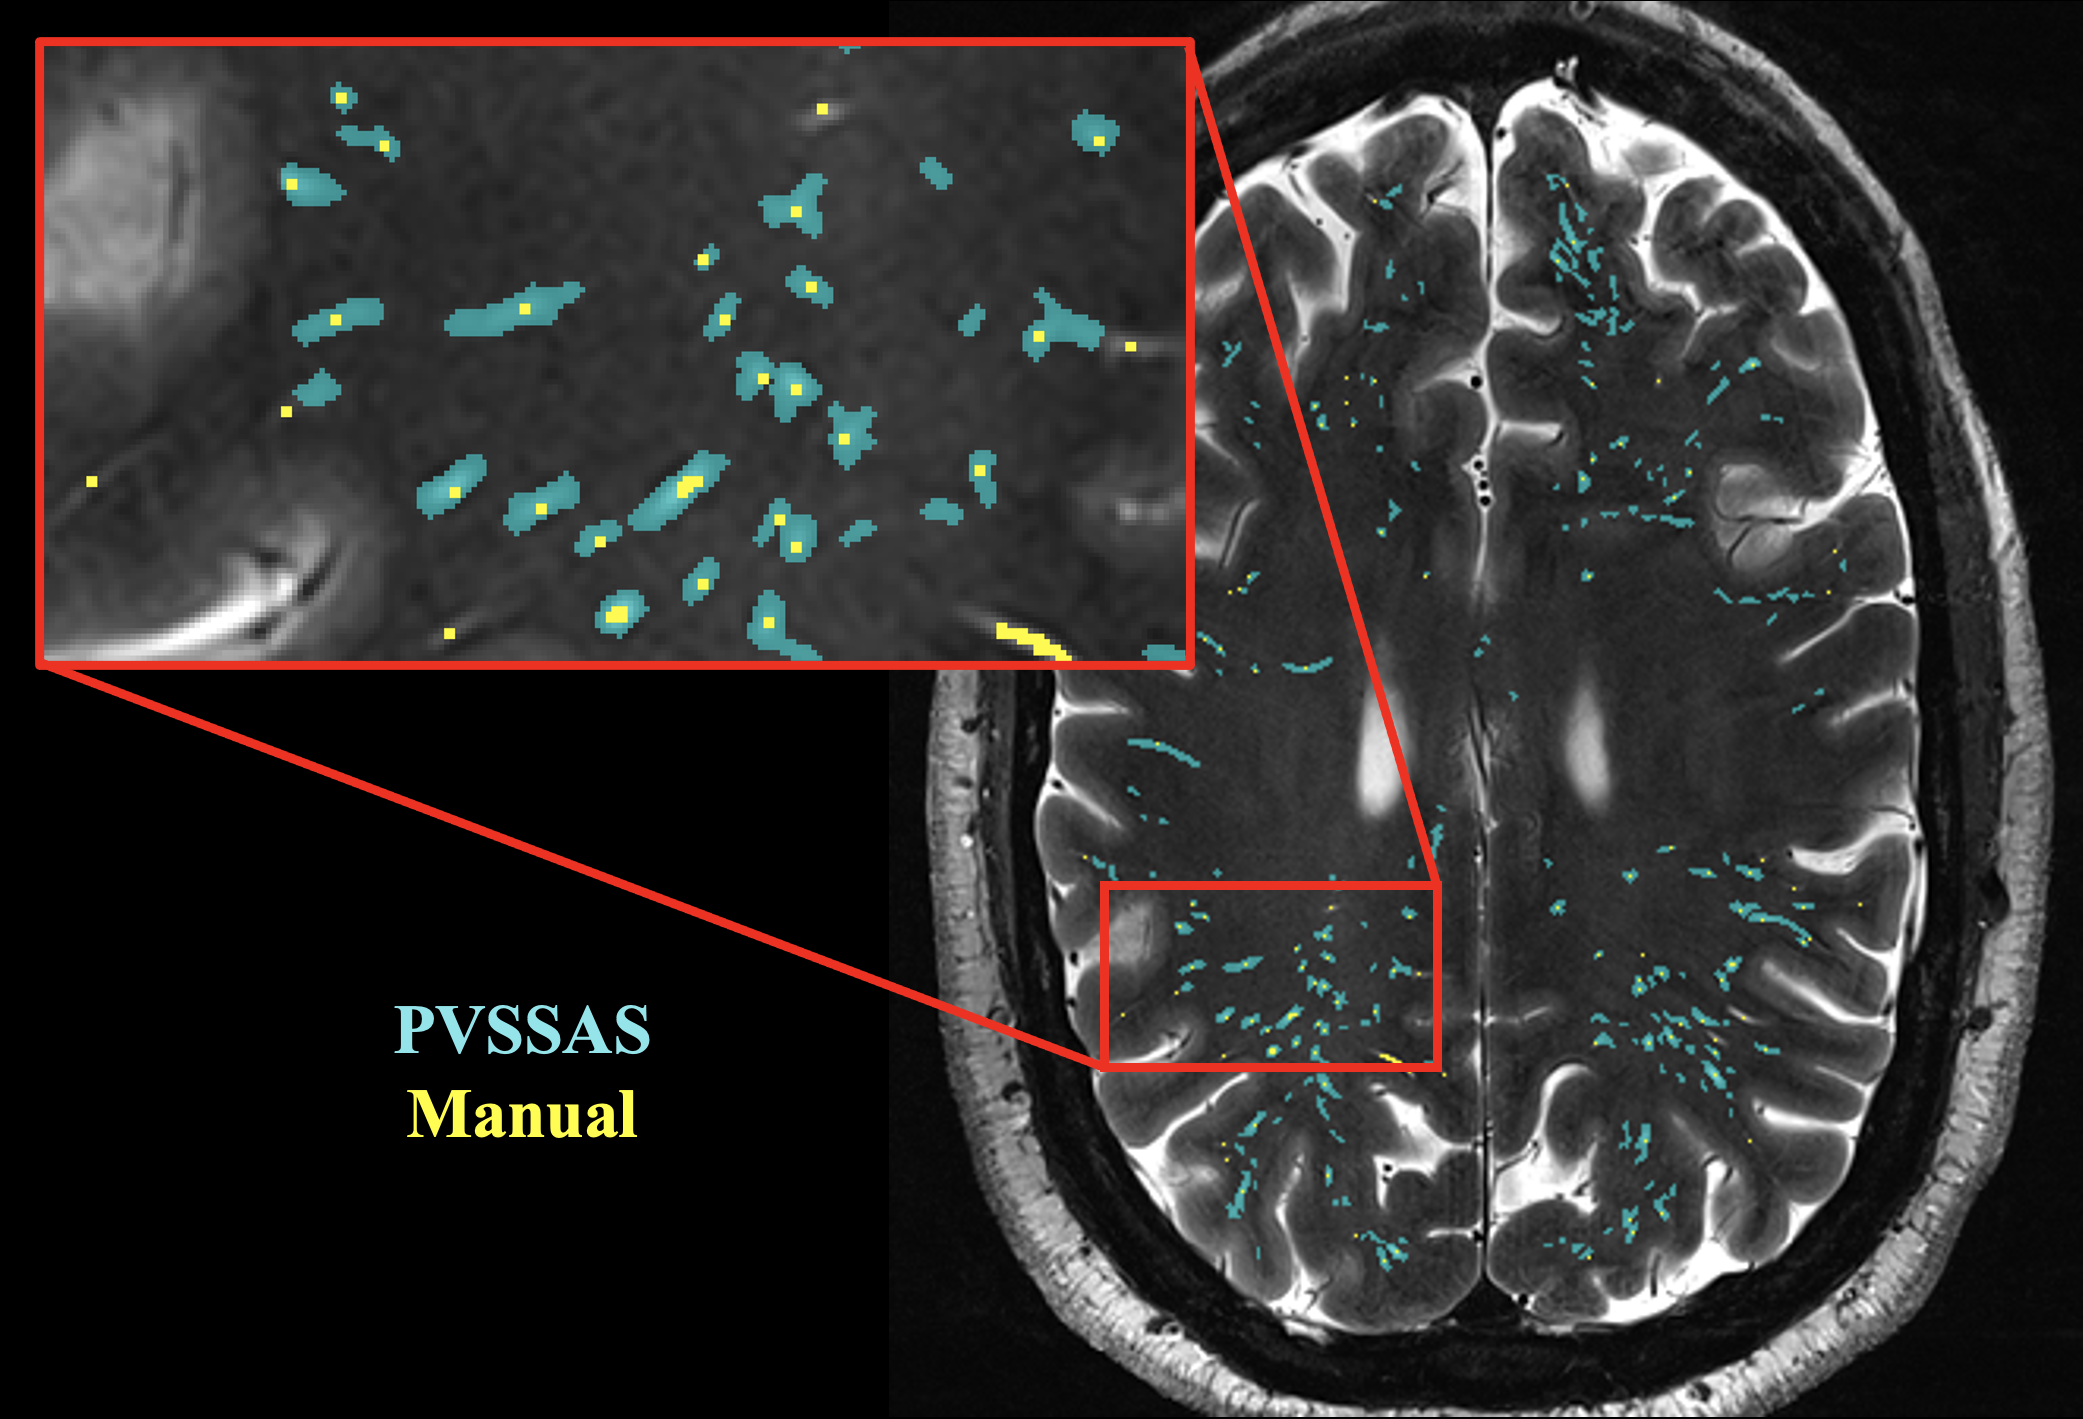
Axial T1w MPRAGE and T2w images were acquired from 8 PTE+, 18 PTE-, and 22 CTL using a 7T Siemens Magnetom. Images were processed with SPM1216 and FSL17,18 in MATLAB (see Figures 1 and 2). T2w images were coregistered to T1w images and supratentorial white matter (WM) masks were generated. Additional masks of frontal, temporal, occipital, parietal, and limbic lobes were created from the Talairach-Daemon lobe atlas19,20 that is part of SPM12’s WFU_PickAtlas toolbox21,22 and warped to T1w images. T1w images were coregistered to T2w images and masks were warped to T2w images.WM masks were preprocessed with PVSSAS by filling holes under 200 pixels in size and eroding 5 pixels from mask boundaries. T2w images were preprocessed with PVSSAS by applying a 1 pixel standard deviation Gaussian filter. PVSs 4-300 pixels in size were segmented using Frangi filter parameters optimized for 7T23 and a sensitivity of 1. Erosion width and sensitivity were chosen based on comparison to a manual segmentation (see Figure 3).
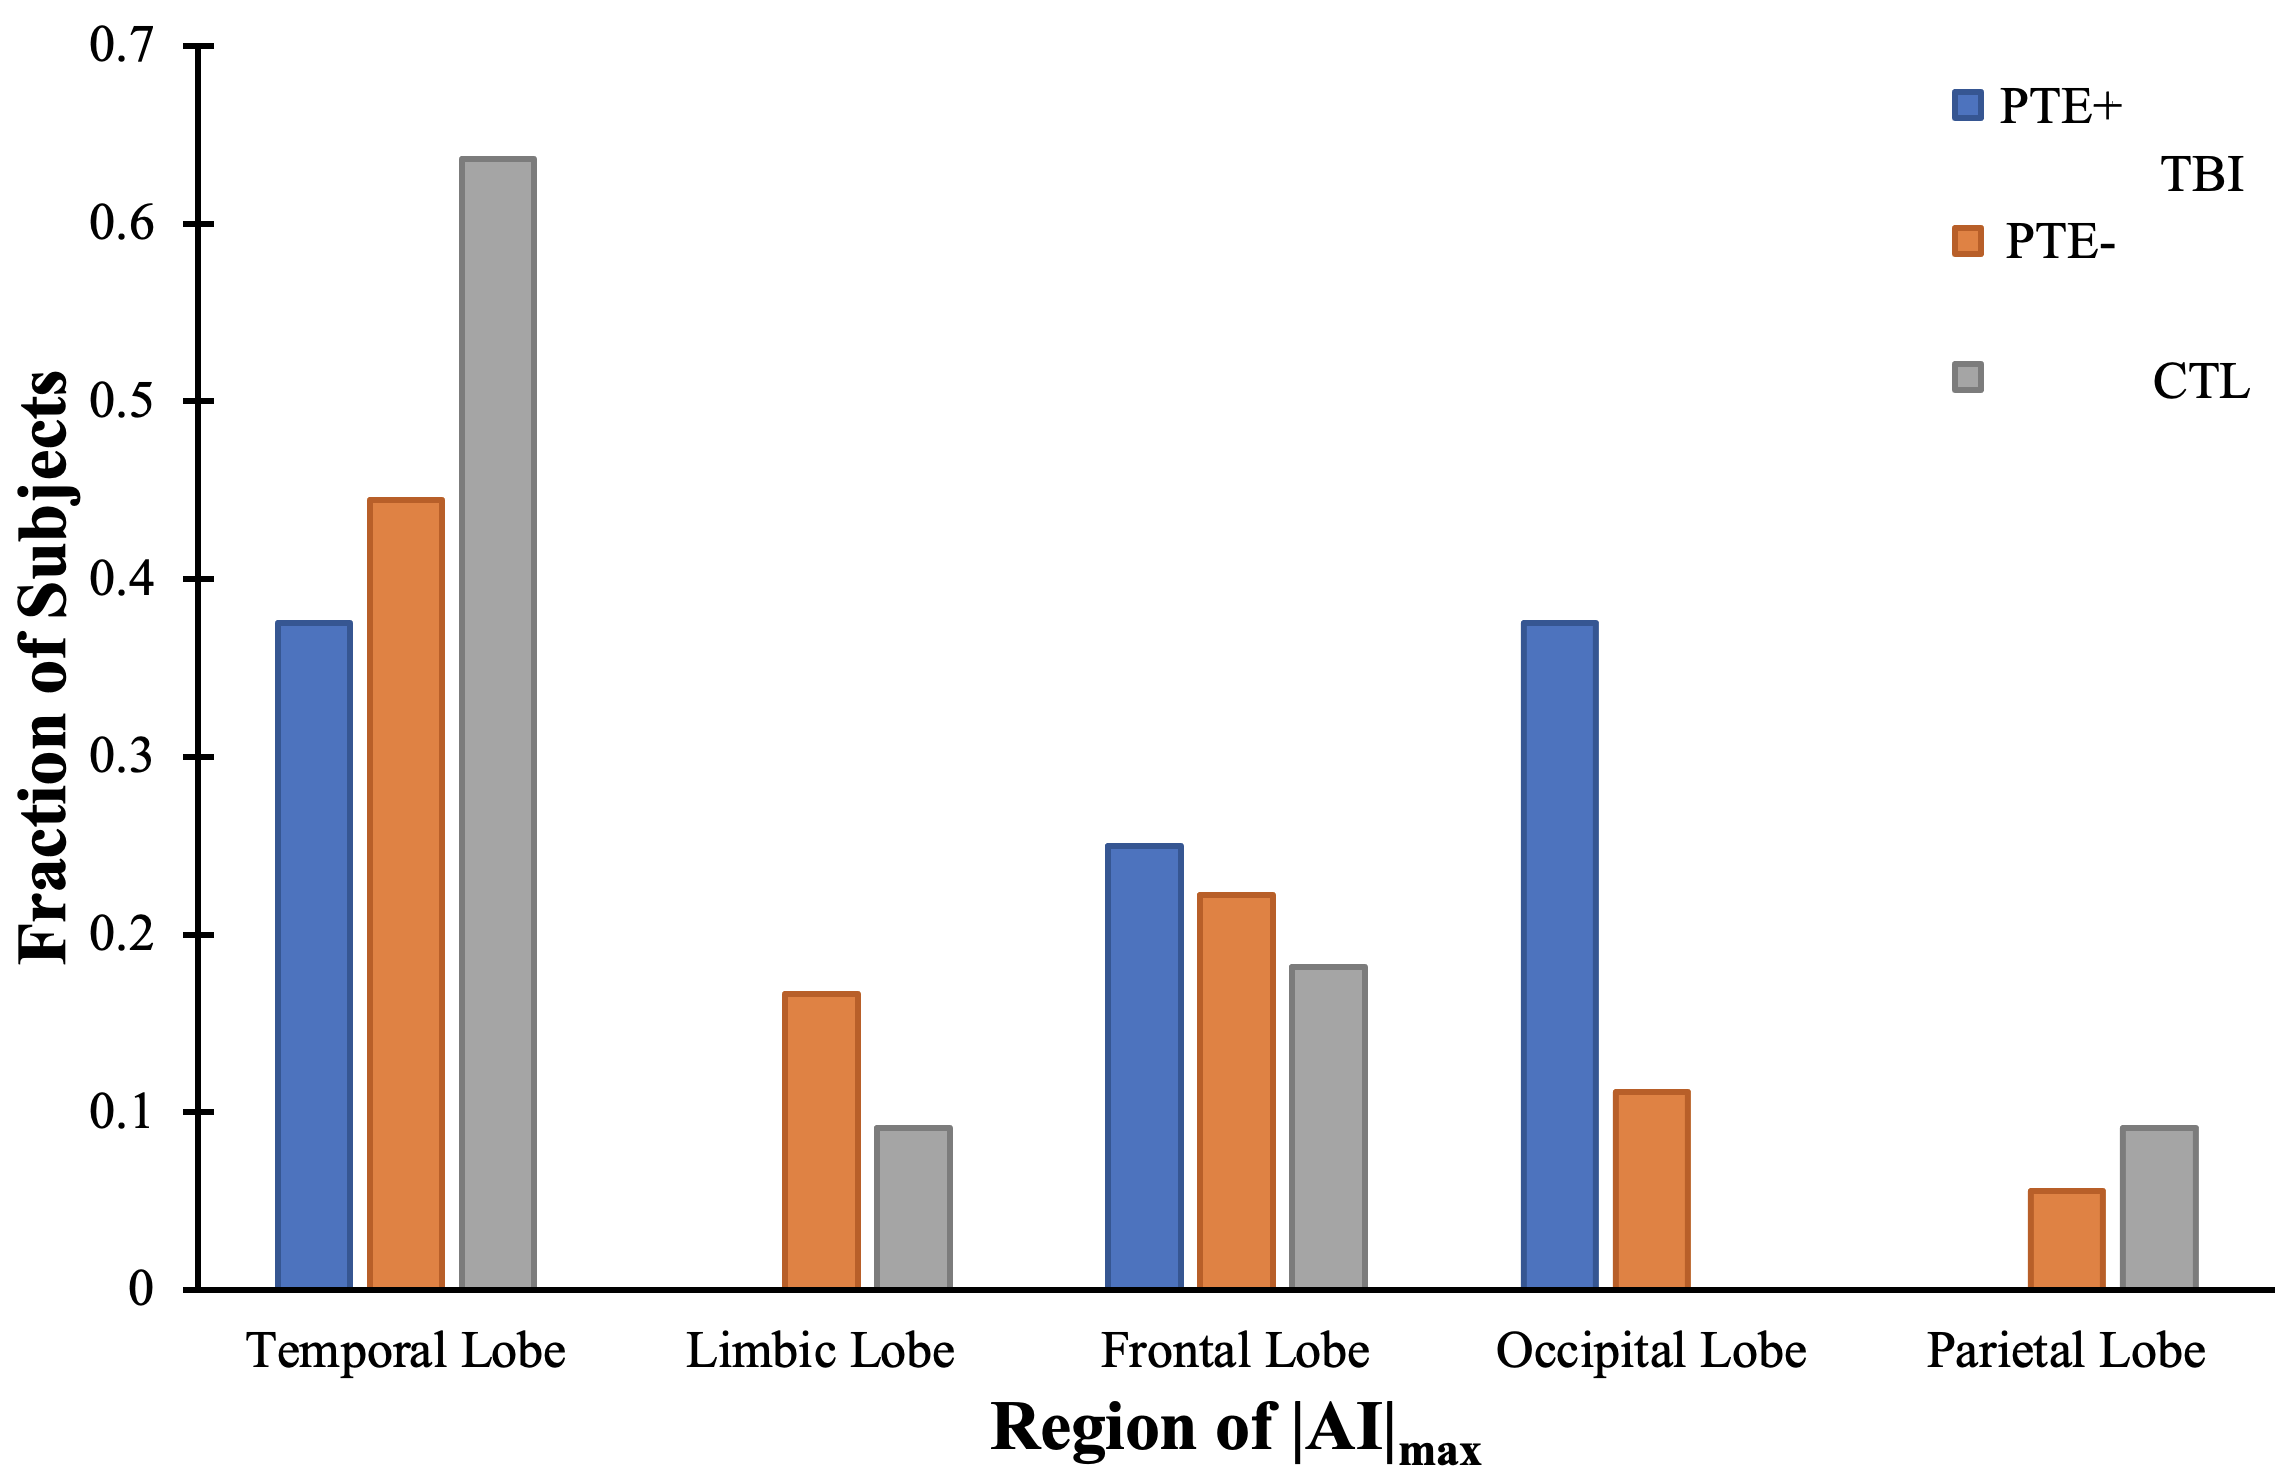
PVS density (#PVS/WMarea) and median PVS equivalent diameter were calculated. In addition, asymmetry index was calculated according to12 $$AI_{j}=\frac{(S_{jr}-S_{jl})}{\frac{1}{2}(S_{jr}+S_{jl})},$$ where Sjr and Sjl are the sums of PVS equivalent diameters in each lobe on right and left sides, respectively. The maximum absolute asymmetry index (|AI|max) was calculated and regions of |AI|max were counted for each group. Differences between the groups were evaluated with Kruskal-Wallis tests followed by post-hoc Mann-Whitney U tests.
Results
Figure 4 demonstrates a difference between groups in median PVS equivalent diameter (p=0.0175) and a trend towards difference between groups in PVS density (p=0.0598). No difference between groups in |AI|max (p=0.7797) was found. Pairwise analysis of PVS density showed a decrease in PTE+ compared to CTL (p=0.0229), but no differences between the other groups (p>0.12). Median PVS equivalent diameter was higher in PTE+ versus CTL (p=0.0129) and in PTE- versus CTL (p=0.0414), but no difference was observed between PTE+ and PTE- (p=0.3172). The distribution of regions of |AI|max for each group is shown in Figure 5.Discussion
The results suggest a relationship between PVS size and TBI, consistent with previous findings9,10. Following TBI, the inflammatory response helps to repair damage and remove waste via PVSs6,7, potentially leading to enlarged PVSs in PTE+ and PTE-. The increase in median PVS equivalent diameter may be more apparent in the PTE+ relative to PTE- due to prolonged waste clearance associated with epilepsy24. In PTE+ there was a trend towards a reduced PVS density relative to CTL, which is not consistent with other findings10, and may suggest that multiple enlarged PVSs are being segmented as one.The investigation of PVSs as biomarkers of disease pathophysiology is still a developing field. The lack of difference found in |AI|max is not consistent with previous findings in epilepsy12. Although epilepsy is thought to be an asymmetric disease, with seizures originating in epileptogenic zones25, growing evidence suggests that network changes also occur diffusely throughout the brain26,27. In addition, the small number of PTE+ in this study precluded adjustment for age, injury severity, and time since injury – all of which have implications on PVS characteristics.
Conclusion
Semi-automated PVS segmentation of 7T images highlights differences in median PVS equivalent diameter and PVS density between TBI with and without PTE compared to healthy controls.Acknowledgements
We acknowledge the support of the Natural Sciences and Engineering Research Council of Canada, Canadian Foundation for Innovation, United States of America Department of Defence Institute for Defence Analysis, and Walter C. Sumner Memorial Foundation.References
- Capizzi A, Woo J, and Verduzco-Gutierrez M. Traumatic Brain Injury: An Overview of Epidemiology, Pathophysiology, and Medical Management. Med Clin North Am. 2020;104(2):213-238.
- Ladak AA, Enam SA, and Ibrahim MT. A Review of the Molecular Mechanisms of Traumatic Brain Injury. World Neurosurg. 2019;131:126-132.
- Agrawal A, Timothy J, Pandit L, et al. Post-traumatic epilepsy: An overview. Clin Neurol Neurosurg. 2002;108(5):433-439.
- Brody DL, Mac Donald CL, Shimony JS. Current and future diagnostic tools for traumatic brain injury: CT, conventional MRI, and diffusion tensor imaging. Handb Clin Neurol. 2015;127:267-275.
- Akyuz E, Koklu B, Ozenen C, et al. Elucidating the Potential Side Effects of Current Anti-Seizure Drugs for Epilepsy. Curr Neuropharmacol. 2021;19(11):1865-1883.
- Jessen NA, Munk AS, Lundgaard I, et al. The Glymphatic System: A Beginner’s Guide. Neurochem Res. 2015;40(12):2583-2599.
- Bakker EN, Bacskai BJ, Arbel-Ornath M, et al. Lymphatic Clearance of the Brain: Perivascular, Paravascular and Significance for Neurodegenerative Diseases. Cell Mol Neurobiol. 2016;36(2):181-194.
- Cai K, Tain R, Das S, et al. The feasibility of quantitative MRI of perivascular spaces at 7 T. J Neurosci Methods. 2015;256:151-156.
- Inglese M, Bomsztyk E, Gonen O, et al. Dilated Perivascular Spaces: Hallmarks of Traumatic Brain Injury. AJNR Am J Neuroradiol. 2005;26(4):719-724.
- Liu C, Habib T, Salimeen M, et al. Quantification of visible Virchow–Robin spaces for detecting the functional status of the glymphatic system in children with newly diagnosed idiopathic generalized epilepsy. Seizure. 2020;78:12-17.
- Wang ML, Yang DX, Sun Z, et al. MRI-Visible Perivascular Spaces Associated with Cognitive Impairment in Military Veterans with Traumatic Brain Injury Mediated by CSF P-Tau. Front Psychiatry. 2022;13:921203.
- Feldman RE, Rutland JW, Fields MC, et al. Quantification of perivascular spaces at 7T: A potential MRI biomarker for epilepsy. Seizure. 2018;54:11-18.
- Smith DA, Verma G, Ranti D, et al. Perivascular space semi-automatic segmentation (PVSSAS): A tool for segmenting, viewing and editing perivascular spaces. Biorxiv [preprint]. 2020.
- Ranti DL, Warburton AJ, Rutland JW, et al. Perivascular spaces as a marker of psychological trauma in depression: A 7-Tesla MRI study. Brain Behav. 2022;12(7):e32598.
- Langan MT, Smith DA, Verma G, et al. Semi-automated Segmentation and Quantification of Perivascular Spaces at 7 Tesla in COVID-19. Front Neurol. 2022;13:846957.
- Penny WD, Friston KJ, Ashburner JT, et al. Statistical parametric mapping: the analysis of functional brain images. Elsevier. 2007.
- Woolrich MW, Jbabdi S, Patenaude B, et al. Bayesian analysis of neuroimaging data in FSL. Neuroimage. 2009;45(1 Suppl):S173-S186.
- Smith SM, Jenkinson M, Woolrich MW, et al. Advances in functional and structural MR image analysis and implementation as FSL. Neuroimage. 2004;23(1 Suppl):S208-S219.
- Lancaster JL, Summerlin JL, Rainey L, et al. The Talairach Daemon, a database server for Talairach Atlas Labels. Neuroimage. 1997;5(4):S633.
- Lancaster JL, Woldorff MG, Parsons LM, et al. Automated Talairach atlas labels for functional brain mapping. Hum Brain Mapp. 2000;10(3):120-131.
- Maldjian JA, Laurienti PJ, Kraft RA, et al. An automated method for neuroanatomic and cytoarchitectonic atlas-based interrogation of fMRI data sets. Neuroimage. 2003;19(3):1233-1239.22.
- Maldjian JA, Laurienti PJ, and Burdette JH. Precentral gyrus discrepancy in electronic versions of the Talairach atlas. Neuroimage. 2004;21(1):450-455.
- Ballerini L, Lovreglio R, ValdesHernandez MDC, et al. Perivascular spaces segmentation in brain MRI using optimal 3D filtering. Sci Rep. 2018;8(1):2132.
- Muktar I. Inflammatory and immune mechanisms underlying epileptogenesis and epilepsy: From pathogenesis to treatment target. Seizure. 2020;82:65-79.
- Jehi L. The Epileptogenic Zone: Concept and Definition. Epilepsy Curr. 2018;18(1):12-16.
- Gonzalez Otarula KA and Schuele S. Networks in Temporal Lobe Epilepsy. Neurosurg Clin N AM. 2020;31(3):309-317.
Figures