2471
Explained variance of cerebrospinal fluid component in resting-state fMRI as a potential biomarker for proportionate perivascular space volume1Radiology, Mayo Clinic, Rochester, MN, United States, 2Psychiatry, Mayo Clinic, Rochester, MN, United States
Synopsis
Keywords: Neurofluids, Neurofluids, perivascular space, explained variance of CSF
Motivation: Estimating cerebrospinal fluid (CSF) in perivascular spaces (PVS) is essential to advance understanding of glymphatic clearance of cerebral waste products.
Goal(s): This study aimed to explore a novel method for evaluating CSF in PVS in awake subjects, including healthy controls and those with mild cognitive impairment (MCI).
Approach: We analyzed the explained variance of CSF components (CSF-derived R2) in resting-state fMRI images to determine the proportionate volume of PVS.
Results: We observed a decline in CSF-derived R2 with aging in healthy controls. Conversely, elevated CSF-derived R2 in MCI participants suggests enlargement of PVS, which may implicate altered glymphatic function in cognitive disorders.
Impact: The CSF-derived R2 metric from resting-state fMRI images offers a quantifiable assessment of CSF volume in perivascular spaces of the gray matter, holding potential as a biomarker for investigating glymphatic system efficiency.
Introduction
Cerebrospinal fluid (CSF) is known to play an important role in clearing brain waste products through the glymphatic system. Perivascular spaces (PVS) are the CSF-filled spaces surrounding brain parenchymal blood vessels and are a key glymphatic component. Earlier investigations have attempted to measure CSF water diffusivity in white matter (WM) PVS [1]. Other studies found correlation between CSF inflow and global signal in gray matter (GM) PVS during sleep [2, 3]. PVS-related activities had been shown to correlate with aging, cognitive capacity [4], and characteristics of neurological diseases [5].In a conventional preprocessing of resting-state fMRI (rs-fMRI), the CSF component is considered as non-neural artifact and eliminated from cortical signal as a regressor [6]. In this work, we investigated the potential of explained variance R2 of the CSF regressor as a biomarker to assess the proportion of the CSF-related signal emanating from the GM and WM PVS.
Methods
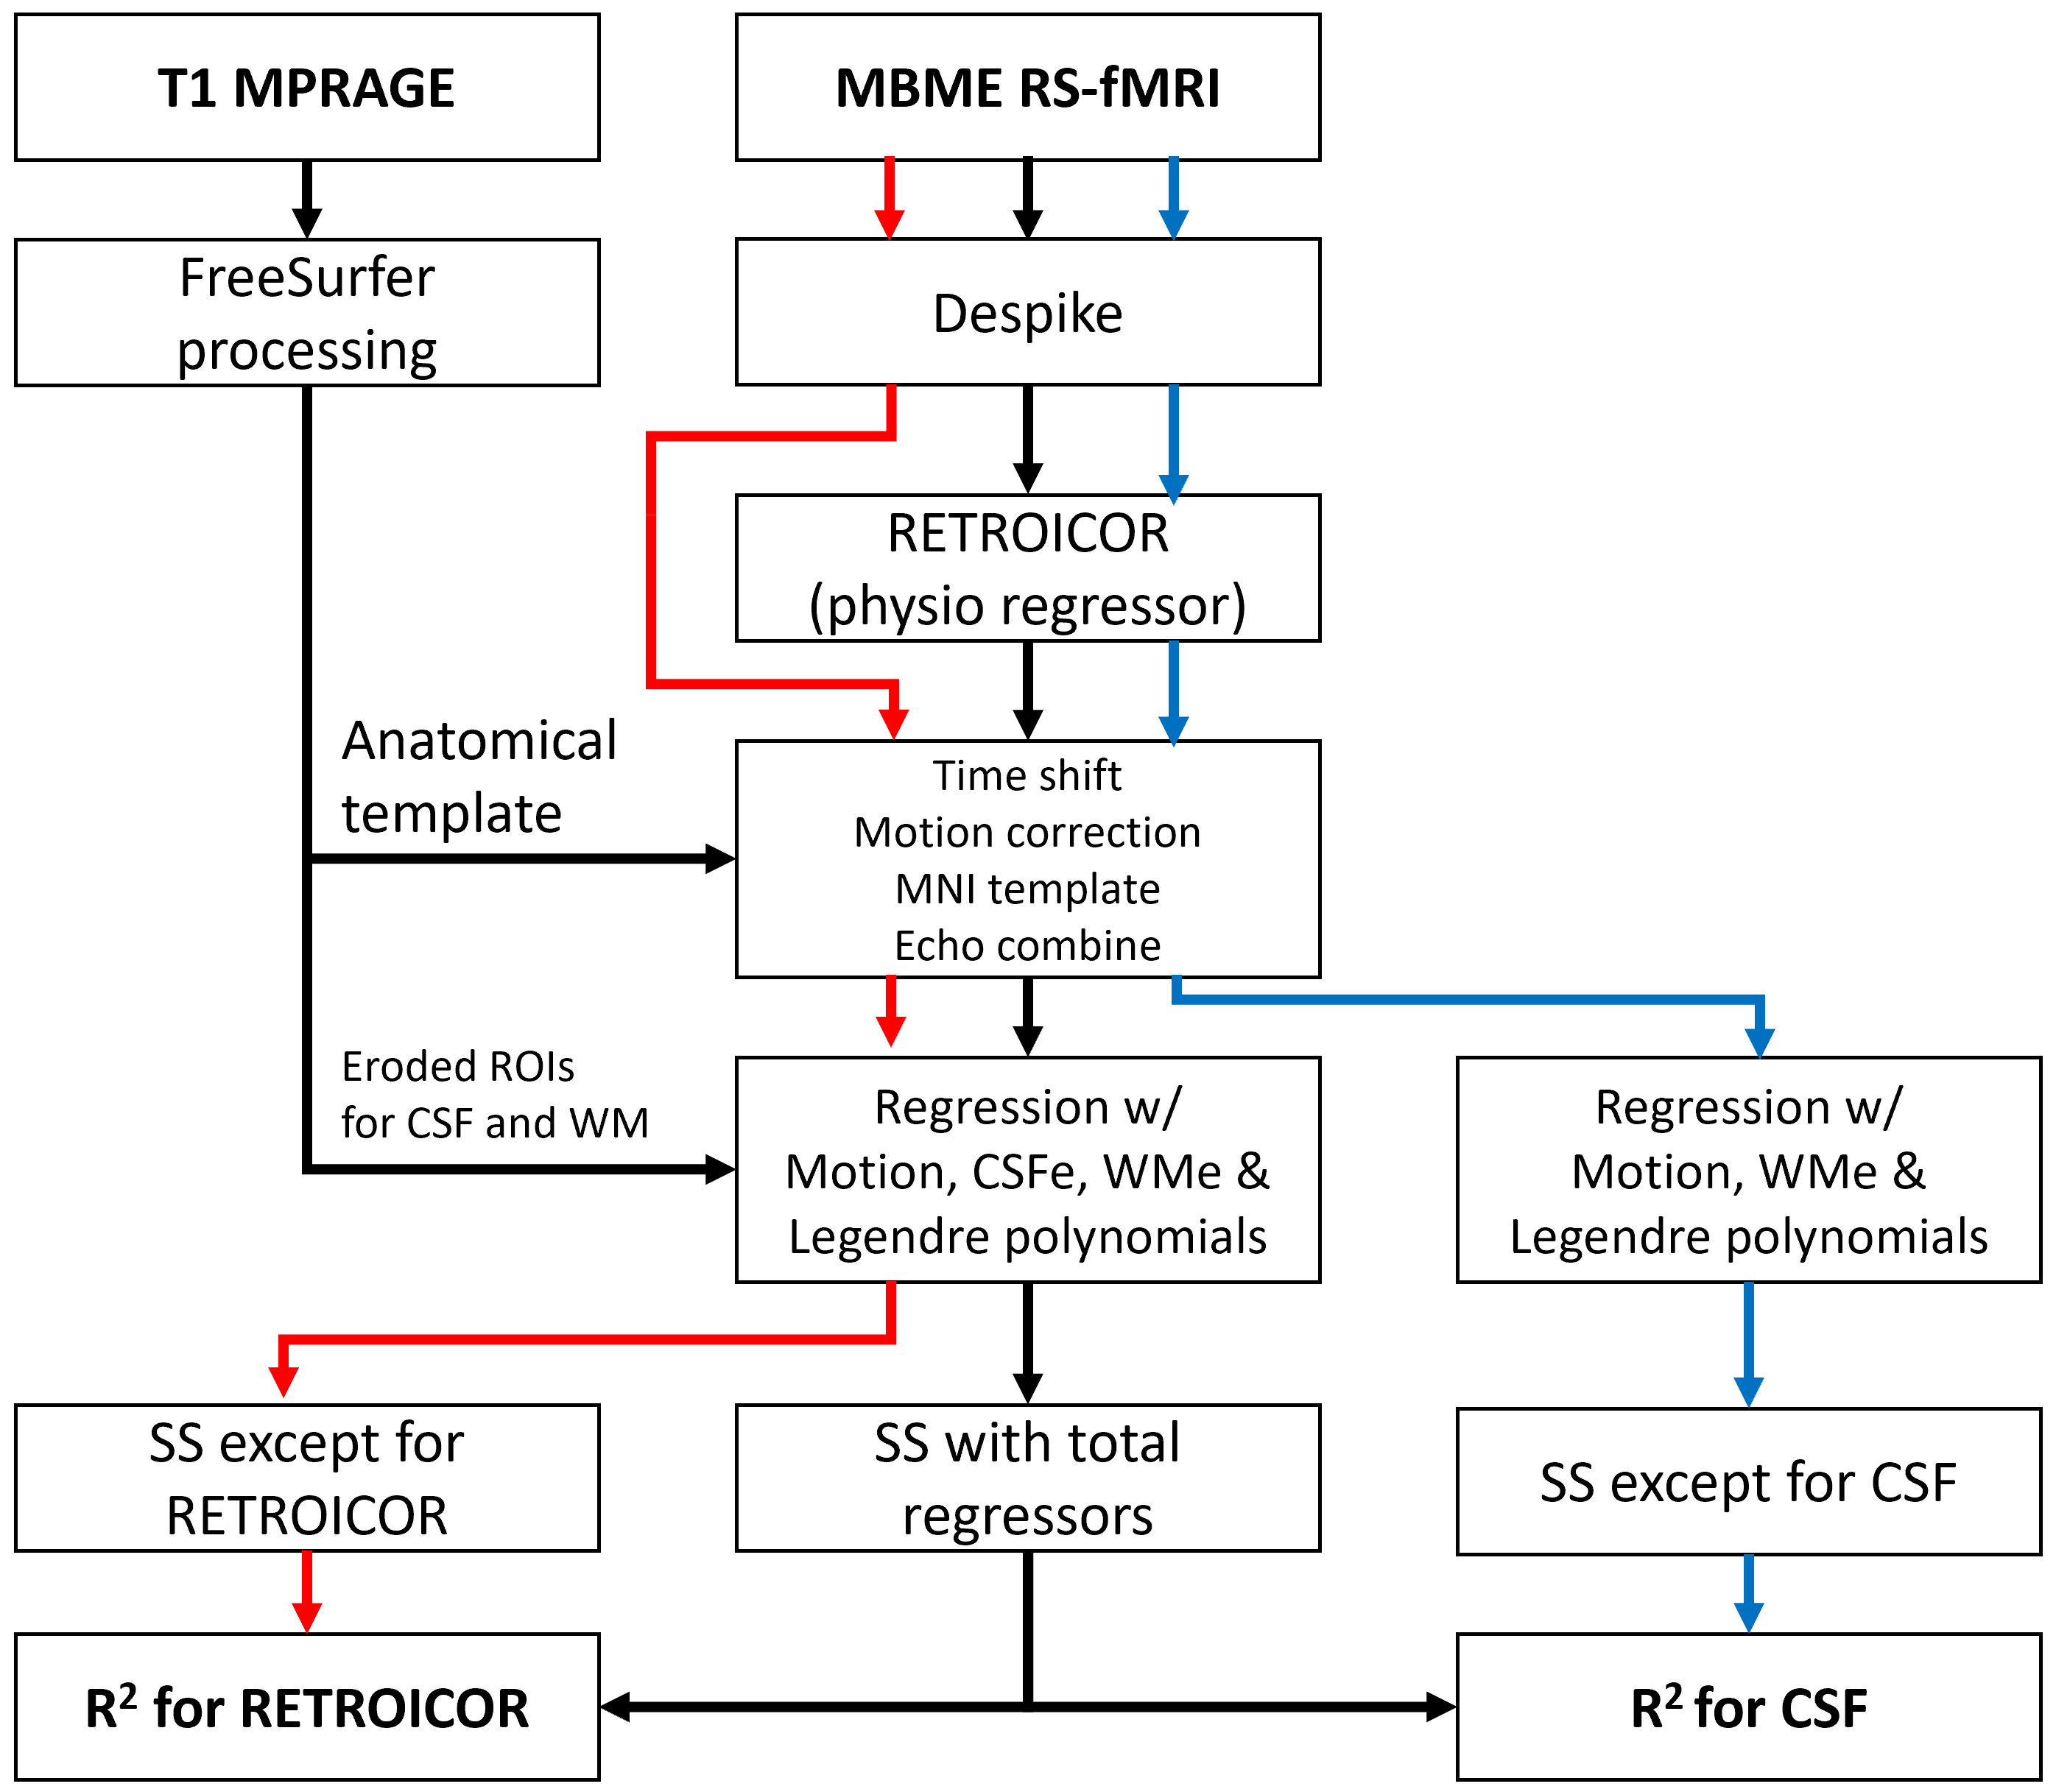
Following protocols approved by the IRB, 28 healthy subjects and 6 mild cognitive impairment (MCI) patients participated in a rs-fMRI study after written informed consent (Table 1). All were scanned with a compact 3T scanner using a 32-channel brain coil [7]. During rs-fMRI, all participants were awake with eyes open and instructed to fix their gaze. Independent measures of physiological variables, i.e. cardiac pulsation and respiration motion, were recorded. All healthy participants had two rs-fMRI scans. Nineteen had 5-minute acquisitions repeated twice in one session, The other nine had 10-minute fMRI acquisitions repeated with an interval of 18.9±5.3 days. rs-fMRI was conducted using a 3-echo gradient-echo EPI sequence with 2.4-mm isotropic voxels. For anatomic reference, a 1.0-mm isotropic T1-weighted MPRAGE sequence was performed. Other imaging parameters were the same as those in reference [8].To examine signal variance explained with specific regressors, R2 value was employed to determine the proportion of the signal variance observed without individual preprocessing steps relative to the variance observed with all preprocessing steps [8, 9], as shown in Figure 1. The value of R2 was evaluated from:
$$R_{regressor}^2\equiv1-\frac{{SS}_{total}}{{SS}_{regressor}}$$
, where SStotal was the error sum of squares with all regressors, and SSregressor was the error sum of squares with all regressors except for a certain regressor. Without band pass filtering and spatial smoothing, R2 maps were evaluated for the RETROICOR [10] and three significant principal components from CSF in the lateral ventricles [6]. The mean R2 values were calculated in GM and WM voxels for each trial of participants. All image-related processing was performed using AFNI and FreeSurfer [11, 12].
Results
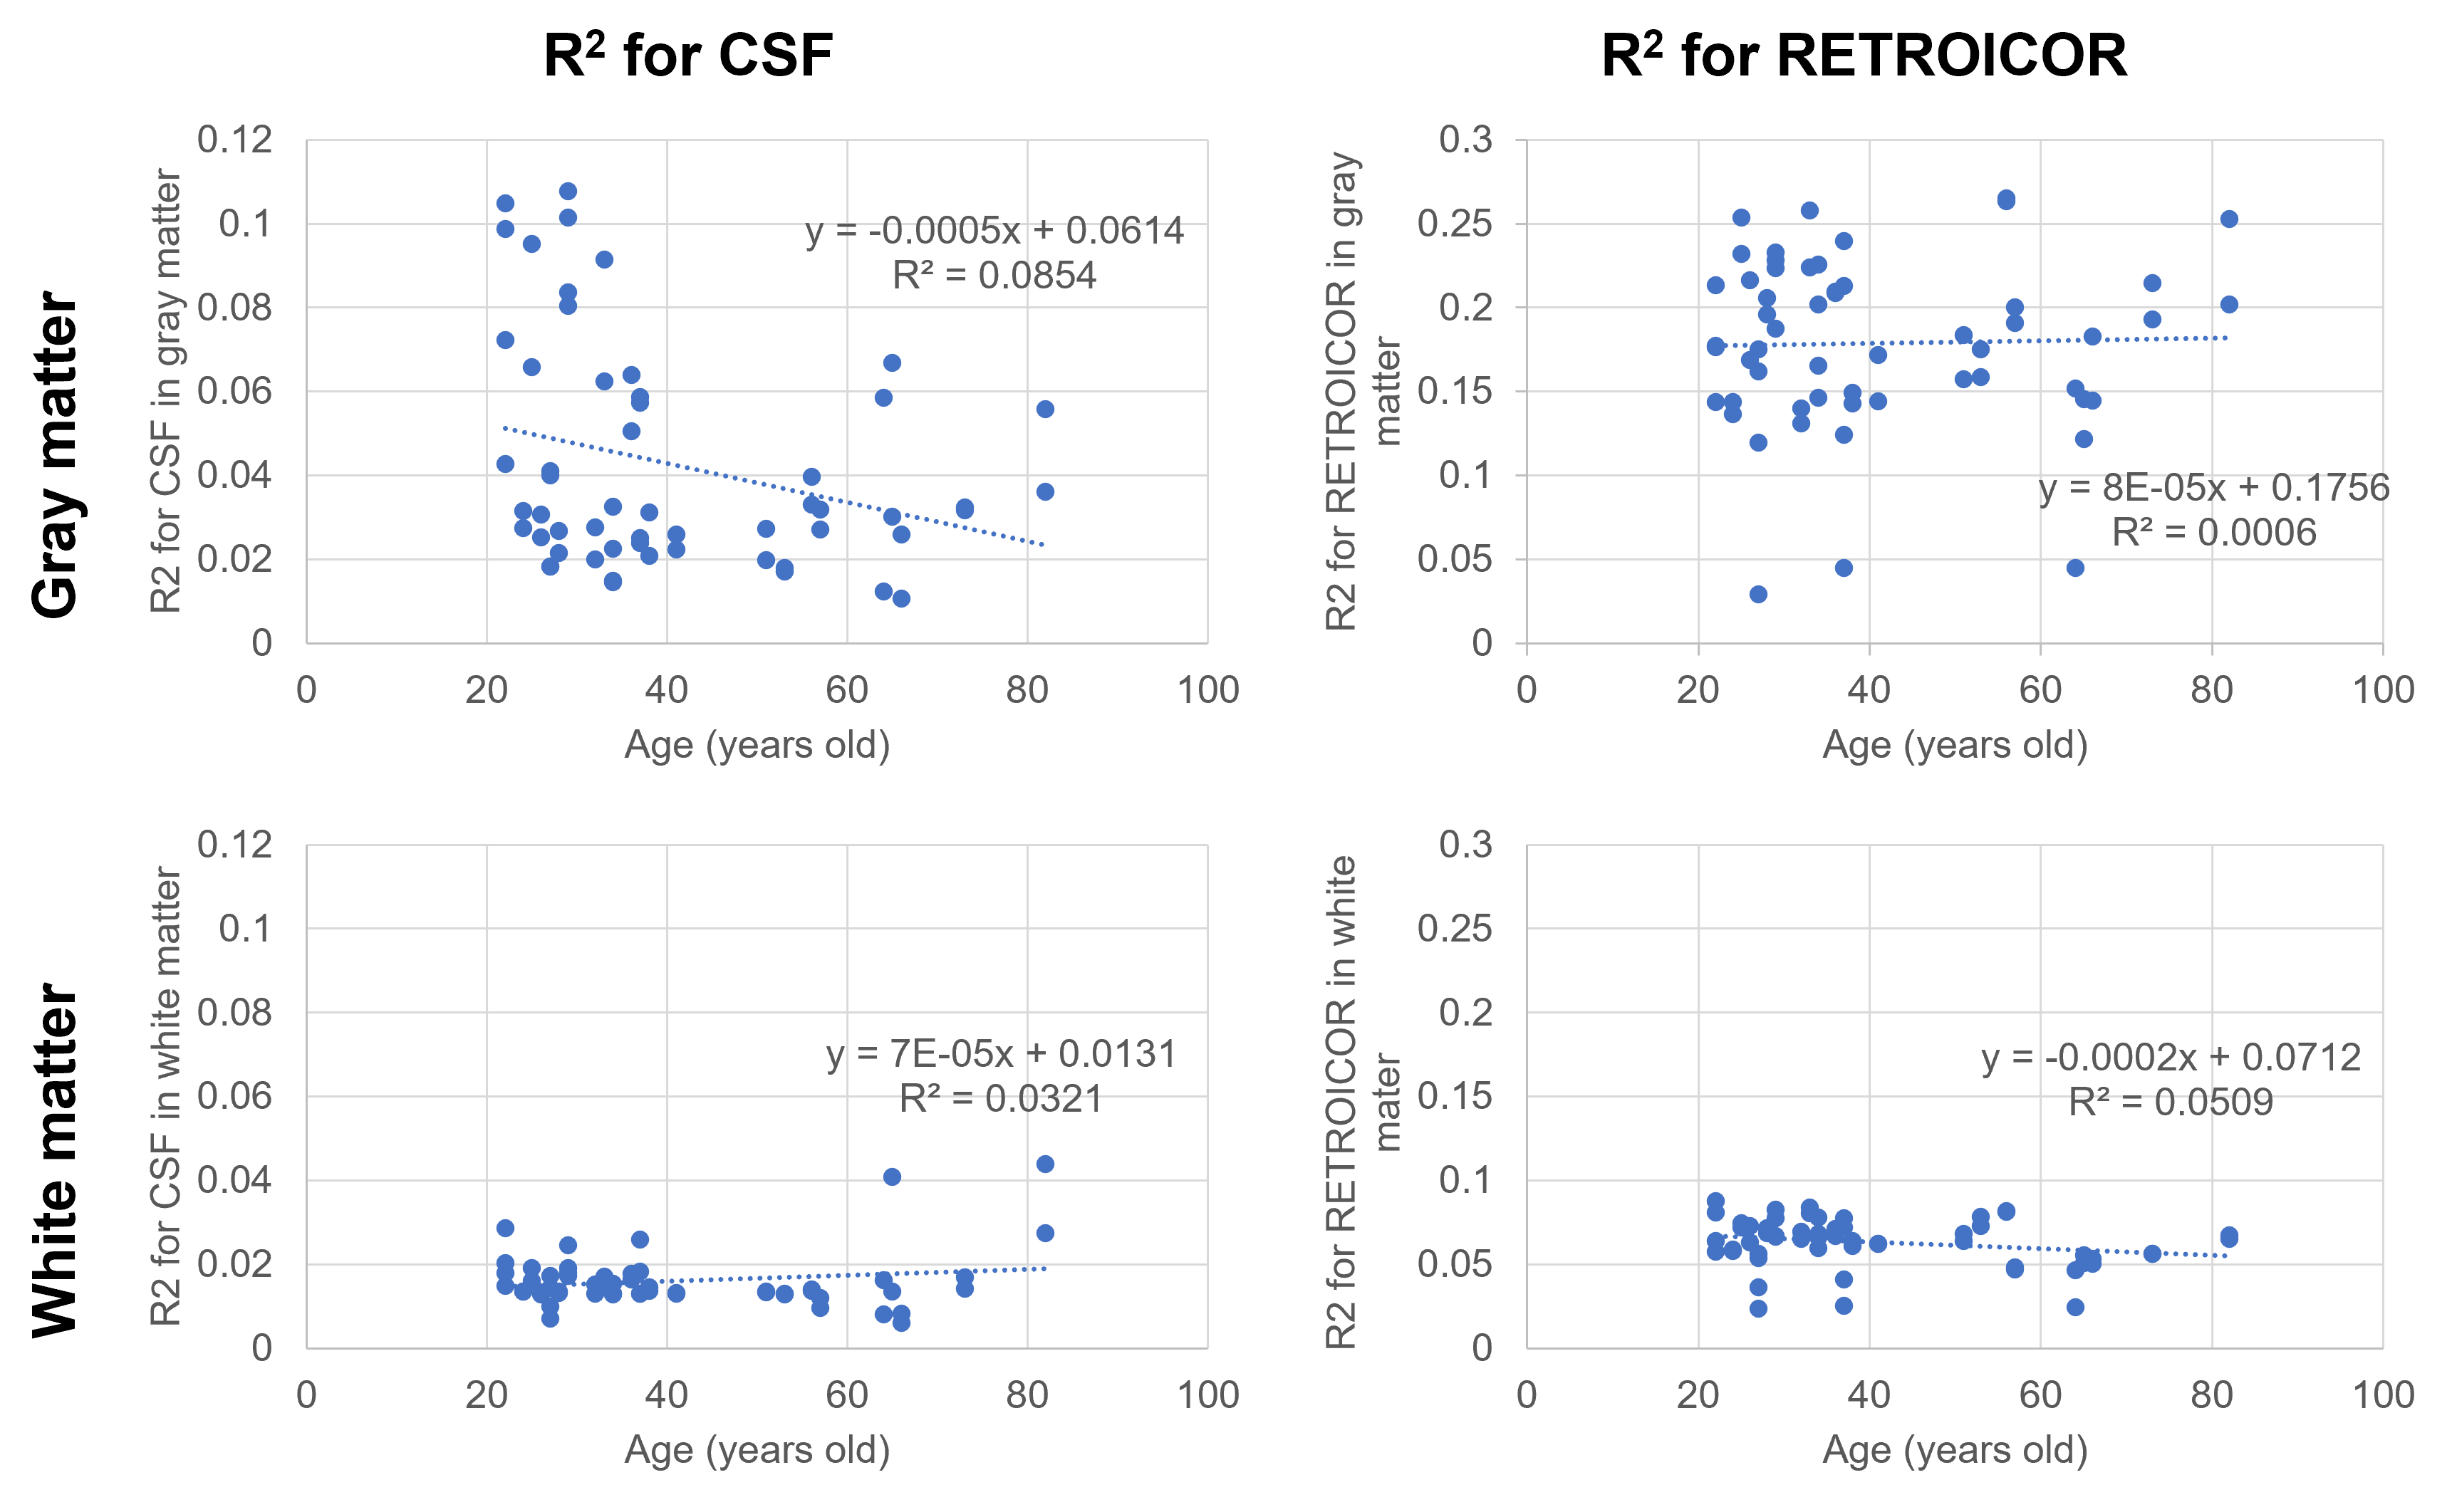
The test-retest reliability for R2 was assessed through Pearson’s correlation. The R2 for CSF in GM and WM were r=0.7260 and 0.6261 (p<0.0001 for both), respectively. The R2 for RETROICOR in GM and WM were r=0.7467 and 0.9192 (p<0.0001 for both), respectively. Both R2 for CSF and RETROICOR demonstrated good reliability.Figure 2 shows the relationships of various R2 to age. R2 for CSF in GM showed negative relationship with age while R2 for RETROICOR did not change. In WM, R2 for CSF and RETROICOR showed relatively small values compared to those in GM. In Spearman’s correlation analysis, R2 for CSF and RETROICOR in GM had correlation coefficients ρ=-0.2767 (p=0.0390) and ρ=-0.0023 (p=0.9864) with age, respectively. R2 for CSF and RETROICOR in WM had ρ=-0.1710 (p=0.2076) and ρ=-0.2596 (p=0.0533), respectively.
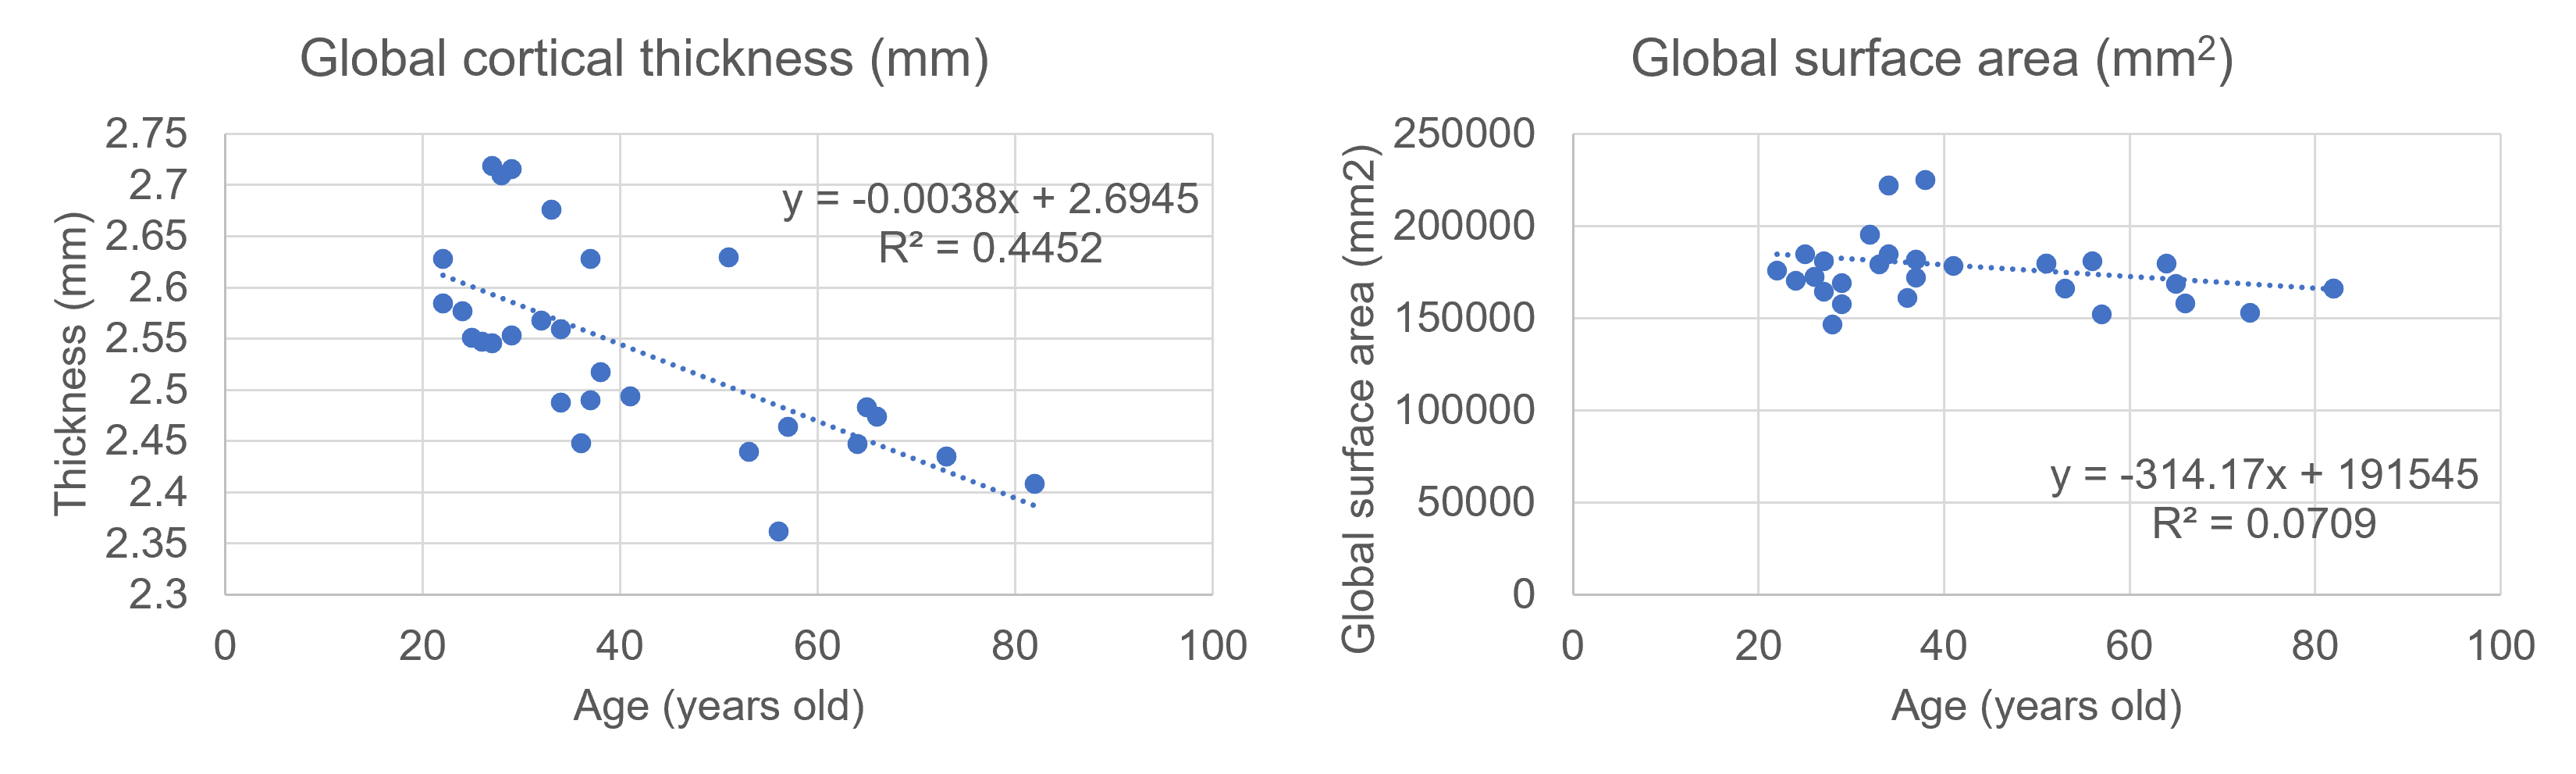
The cortical thickness and surface area were examined with anatomical images. In Figure 3, cortical thickness was negatively correlated with age.
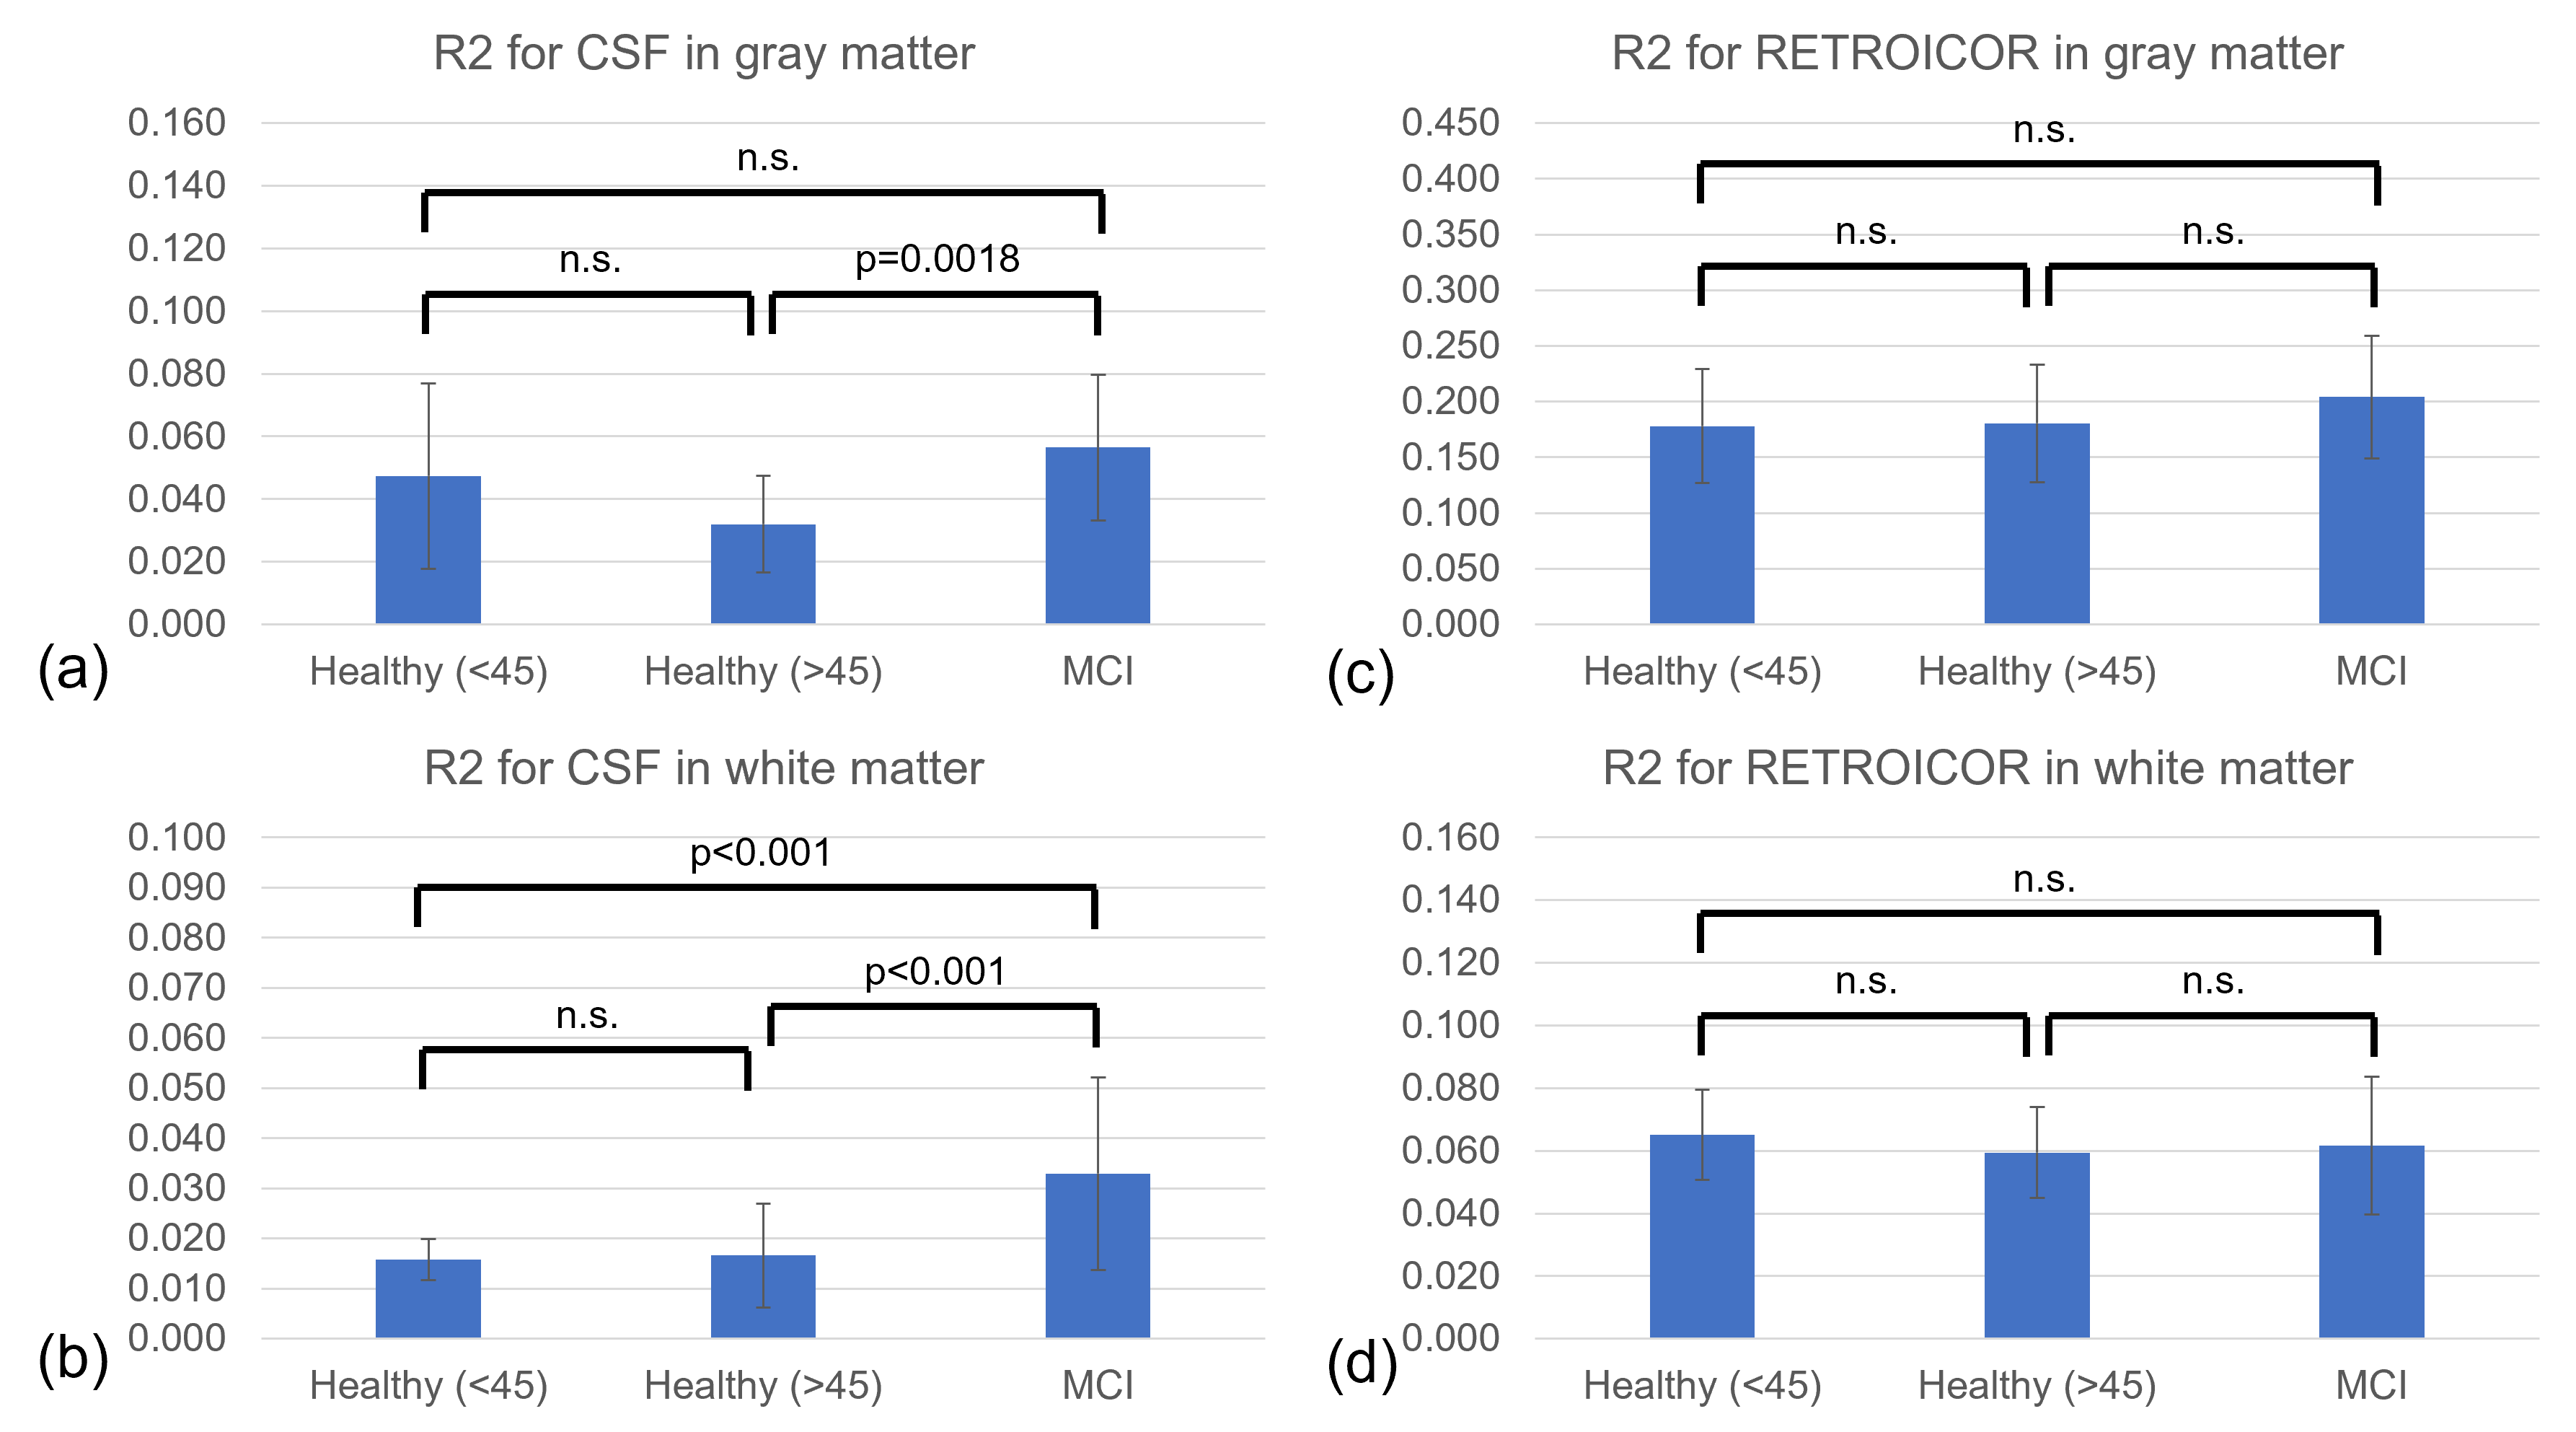
In Figure 4, average R2 for CSF in MCI group was significantly higher than those in the elderly healthy group in both GM and WM.
Discussion
In this work, we investigated the proportion of CSF components in GM and WM using R2 of the CSF regressor to assess PVS in awake subjects. With aging, the reduction in cortical thickness could potentially lead to an increased measurement of CSF signal in GM due to partial volume averaging of extracerebral CSF. However, our results showed decreasing GM CSF signal in elder healthy subjects suggesting that potential volume averaging may not significantly impact the estimation.Interestingly, MCI group exhibited a relatively higher proportion of CSF components, aligning with the prior report of dilated PVS in patients with MCI [4].
Notably, the R2 for RETROICOR appeared minimal correlation with aging and cognitive disorder. Further research is required to elucidate these observations.
Conclusion
The CSF-derived R2 value emerges as a promising indicator for quantifying CSF presence in rs-fMRI datasets. Moving forward, we aim to further investigate how this CSF metric correlates with glymphatic activity, potentially reflecting the state of PVS in both GM and WM.Acknowledgements
The authors sincerely acknowledge the assistance provided by Maria A Halverson and John A Felmlee in MRI data collection, as well as by Timothy L Waters, Erin M Gray and Melissa K Wang in subject recruitment and consent procedures. This research was funded by the National Institutes of Health (NIH) (Grant/Award Nos. U01 EB024450 and U01 EB026976) as well as Mayo Clinic Benefactors, Linse Bock Foundation, and Mayo Clinic Department of Internal Medicine (Divisions of Geriatric Medicine and Gerontology, and Hospital Internal Medicine).References
1. Taoka, T., et al., Evaluation of glymphatic system activity with the diffusion MR technique: diffusion tensor image analysis along the perivascular space (DTI-ALPS) in Alzheimer's disease cases. Jpn J Radiol, 2017. 35(4): p. 172-178.2. Fultz, N.E., et al., Coupled electrophysiological, hemodynamic, and cerebrospinal fluid oscillations in human sleep. Science, 2019. 366(6465): p. 628-631.
3. Han, F., et al., Reduced coupling between cerebrospinal fluid flow and global brain activity is linked to Alzheimer disease-related pathology. Plos Biology, 2021. 19(6).
4. Niazi, M., et al., Quantitative MRI of Perivascular Spaces at 3T for Early Diagnosis of Mild Cognitive Impairment. American Journal of Neuroradiology, 2018. 39(9): p. 1622-1628.
5. Banerjee, G., et al., MRI-visible perivascular space location is associated with Alzheimer's disease independently of amyloid burden. Brain, 2017. 140(4): p. 1107-1116.
6. Behzadi, Y., et al., A component based noise correction method (CompCor) for BOLD and perfusion based fMRI. Neuroimage, 2007. 37(1): p. 90-101.
7. Foo, T.K.F., et al., Lightweight, compact, and high-performance 3T MR system for imaging the brain and extremities. Magn Reson Med, 2018. 80(5): p. 2232-2245.
8. Kang, D., et al., Improved Resting-State Functional MRI Using Multi-Echo Echo-Planar Imaging on a Compact 3T MRI Scanner with High-Performance Gradients. Sensors (Basel), 2023. 23(9).
9. Jo, H.J., et al., Mapping sources of correlation in resting state FMRI, with artifact detection and removal. Neuroimage, 2010. 52(2): p. 571-82.
10. Glover, G.H., T.Q. Li, and D. Ress, Image-based method for retrospective correction of physiological motion effects in fMRI: RETROICOR. Magnetic Resonance in Medicine, 2000. 44(1): p. 162-167.
11. Cox, R.W., AFNI: software for analysis and visualization of functional magnetic resonance neuroimages. Comput Biomed Res, 1996. 29(3): p. 162-73.
12. Reuter, M., et al., Within-subject template estimation for unbiased longitudinal image analysis. Neuroimage, 2012. 61(4): p. 1402-18.
Figures