2469
Deep-learning segmentation of peri-sinus structures reveals changes across the human lifespan with implications for neurofluid circulation1Neurology, Vanderbilt University Medical Center, Nashville, TN, United States, 2Radiology and Radiological Sciences, Vanderbilt University Medical Center, Nashville, TN, United States, 3Psychiatry and Behavioral Sciences, Vanderbilt University Medical Center, Nashville, TN, United States
Synopsis
Keywords: Neurofluids, Neurofluids, Parasagittal dural space, arachnoid granulations, Cerebrospinal fluid
Motivation: Peri-sinus structures such as the parasagittal dural space (PSD) and intravenous arachnoid granulation (AG) play an important role in regulating the CSF circulation.
Goal(s): To investigate the volume of the PSD and AG in children and adults (age range=5-100 years).
Approach: We refined and applied a novel deep-learning algorithm to estimate volumetric measures of PSD and intravenous AG in a large dataset (n=1,815) using 3D T2-weighted MRI.
Results: Data confirm sex effects on PSD and AG volumes and indicate a more rapid growth in early life with an increase of 0.9 cm3 and 0.64 mm3 per year before plateauing in mid-adulthood.
Impact: Analysis provides new insight into PSD and AG changes in a large dataset of healthy control participants. Findings demonstrate developmental PSD and intravenous AG changes, which may serve as an exemplar for normal vs. unhealthy aging across the lifespan.
Introduction
The overarching goal of this work is to apply novel deep learning algorithms for segmentation of the parasagittal dural (PSD) space and arachnoid granulations (AG) in a large dataset of healthy control participants and to provide normative ranges of these structures across the pediatric and adult lifespan.CSF production occurs in the choroid plexus complexes with production of approximately 500 mL of CSF daily1. The majority of CSF produced in humans traverses the cerebral aqueduct en route to the 4th ventricle after which it enters and circulates along the subarachnoid space2,3, and is ultimately resorbed into the bloodstream. Intravenous AGs are herniations of the arachnoid membrane protruding the sinus lumen4–6. AGs, possibly fundamental to CSF clearance, have been reported to hypertrophy with age7. In addition, there is accumulating evidence that trans-arachnoid molecular clearance, and immune activity, can also occur in the PSD space, a region surrounding the dural sinuses8,9. Recently, a non-invasive MRI method was proposed to quantify PSD morphology in humans from high spatial resolution MRI and deep learning algorithms10, whereby it was reported that, using this method, PSD hypertrophies with age and is directly related to the total CSF volume within the CNS and CSF flow through the cerebral aqueduct. In a separate study using this same method, it was also shown that PSD volume correlates directly with beta-amyloid concentration in older adults with cognitive complaints11. As previous studies suffered from relatively small sample sizes, we applied this novel deep-learning model to a much larger dataset to provide a more complete perspective on volume changes of peri-sinus structures across the human lifespan.
Methods
Two datasets of healthy control participants were used in this study. All participants provided informed consent (see Figure 2). Acquisition. All scans were acquired at 3 Tesla MRI (Philips and Siemens) with body coil radiofrequency transmission using a 3D T2-weighted sequence with repetition time = 2500-3200 ms, echo time=331-564 ms, and spatial resolution=0.70-78x0.70-78x0.70-78mm. Preprocessing. T2w MRI images were corrected for field inhomogeneity12 and aligned to the MNI template using affine registration13. PSD and AG were automatically delineated a recent deep-learning model trained on 80 scans manually delineated by a neuroradiologist (software available at https://github.com/hettk/spesis). T1w MRI were processed with AssemblyNet to estimate brain volume14. Evaluation. PSD and AG volumes were assessed as percentage of intracranial volume. Generalized linear models were used to assess changes in PSD and AG volume across the adult human lifespan. Peri-sinus structure metrics (PSD volumes, AG volumes, and AG count) were used as separate dependent variables and age and sex as covariates as described; the interaction between age and sex were modeled using quadratic restricted splines. Goodness-of-fit was assessed using adjusted R2 scores.Results
In total, 1,815 scans, comprised of 833 male and 982 female participants, were used (Figure 2). PSD. Figure 3 shows the average PSD volume over the human lifespan. Quadratic models indicate an increase in PSD volume with age. Total PSD volume increases with age are larger in males compared to females with a linear interaction of gender and age equal to 0.9 cm3 per year (p<0.001). PSD volume reached a plateau near 70 years of age with a volume of 8 cm3 in male participants compared to 6.5 cm3 in female participants. AG. Figure 4 shows the evolution of proposed AG metrics across the human lifespan. An increase of AG volume was observed in the third to sixth decades of life, with a linear effect of age equal to 0.64 mm3 per year (p<0.001) for total AG volume, and 0.54 mm3 (p<0.001) for maximum AG volume, and one new AG every four years during the first two decades of life as estimated using the detected number of AG (p<0.001).Discussions & Conclusions
One useful aspect of the proposed methodology is that it can be applied to a commonly acquired non-contrasted brain MRI sequence. This facilitates investigation into how these structures evolve across the lifespan, which is not possible from focal, single-site studies with smaller samples. Experiments indicate an increase in volume related to age, with a faster increase in males compared to females in the first half of life. Of note, male participants have an average similar volume in early life compared to female participants. The findings suggest that differentiation of volume between males and females may occur during childhood and adolescence, which could be related to distinct developmental processes. This highlights the need to evaluate CSF dynamics in youth to understand how structures related to CSF production and egress evolve during brain development15.Acknowledgements
This work was supported in part by the U.S. Department of defense under Grant W81XWH-191-0812 and by the National Institute of Health (NIH) under Grants R01AG062574, R01AT11456, K24AG064114, and the Huntington Disease Society of America Human Biology Project fellowship. Research reported in this publication was also supported by the National Institute on Aging of the National Institutes of Health under Award Number U01AG052564 and by funds provided by the McDonnell Center for Systems Neuroscience at Washington University in St. Louis. The HCP-Aging 2.0 Release data used in this report came from DOI: 10.15154/1520707.
References
1. John E. Hall & Michael E. Hall. Guyton and Hall Textbook of Medical Physiology.
2. Tumani, H., Huss, A. & Bachhuber, F. The cerebrospinal fluid and barriers – anatomic and physiologic considerations. Handb. Clin. Neurol. 146, 21–32 (2018).
3. Sakka, L., Coll, G. & Chazal, J. Anatomy and physiology of cerebrospinal fluid. Eur. Ann. Otorhinolaryngol. Head Neck Dis. 128, 309–316 (2011).
4. Grossman, C. B. & Potts, D. G. Arachnoid Granulations: Radiology and Anatomy1. https://doi.org/10.1148/113.1.95 113, 95–100 (1974).
5. Wolpow, E. R. & Schaumburg, H. H. Structure of the human arachnoid granulation. J. Neurosurg. 37, 724–727 (1972).
6. Jayatilaka, A. D. P. Arachnoid granulations in sheep. J. Anat. 99, 315 (1965).
7. Radoš, M., Živko, M., Periša, A., Orešković, D. & Klarica, M. No Arachnoid Granulations—No Problems: Number, Size, and Distribution of Arachnoid Granulations From Birth to 80 Years of Age. Front. Aging Neurosci.13, 698865 (2021).
8. Absinta, M. et al. Human and nonhuman primate meninges harbor lymphatic vessels that can be visualized noninvasively by MRI. Elife 6, (2017).
9. Ringstad, G. & Eide, P. K. Cerebrospinal fluid tracer efflux to parasagittal dura in humans. Nat. Commun. 11, 1–9 (2020).
10. Hett, K. et al. Parasagittal dural space and cerebrospinal fluid (CSF) flow across the lifespan in healthy adults. Fluids Barriers CNS 1–33 (2022) doi:10.1186/s12987-022-00320-4.
11. Song, A. et al. Beta-amyloid burden and cerebrospinal fluid flow in adults with cognitive impairment. Brain Commun. (2023).
12. Tustison, N. J. et al. N4ITK: Improved N3 bias correction. IEEE Trans. Med. Imaging 29, 1310–1320 (2010).
13. Avants, B. B. et al. A reproducible evaluation of ANTs similarity metric performance in brain image registration. Neuroimage 54, 2033–2044 (2011).
14. Coupé, P. et al. AssemblyNet: A large ensemble of CNNs for 3D Whole Brain MRI Segmentation. Neuroimage219, 117026 (2019).
15. Huisman, T. A. G. M. Unraveling the Mystery of the Perivascular Spaces and Glymphatic System of the Neonatal Central Nervous System. Radiology 307, (2023).
Figures
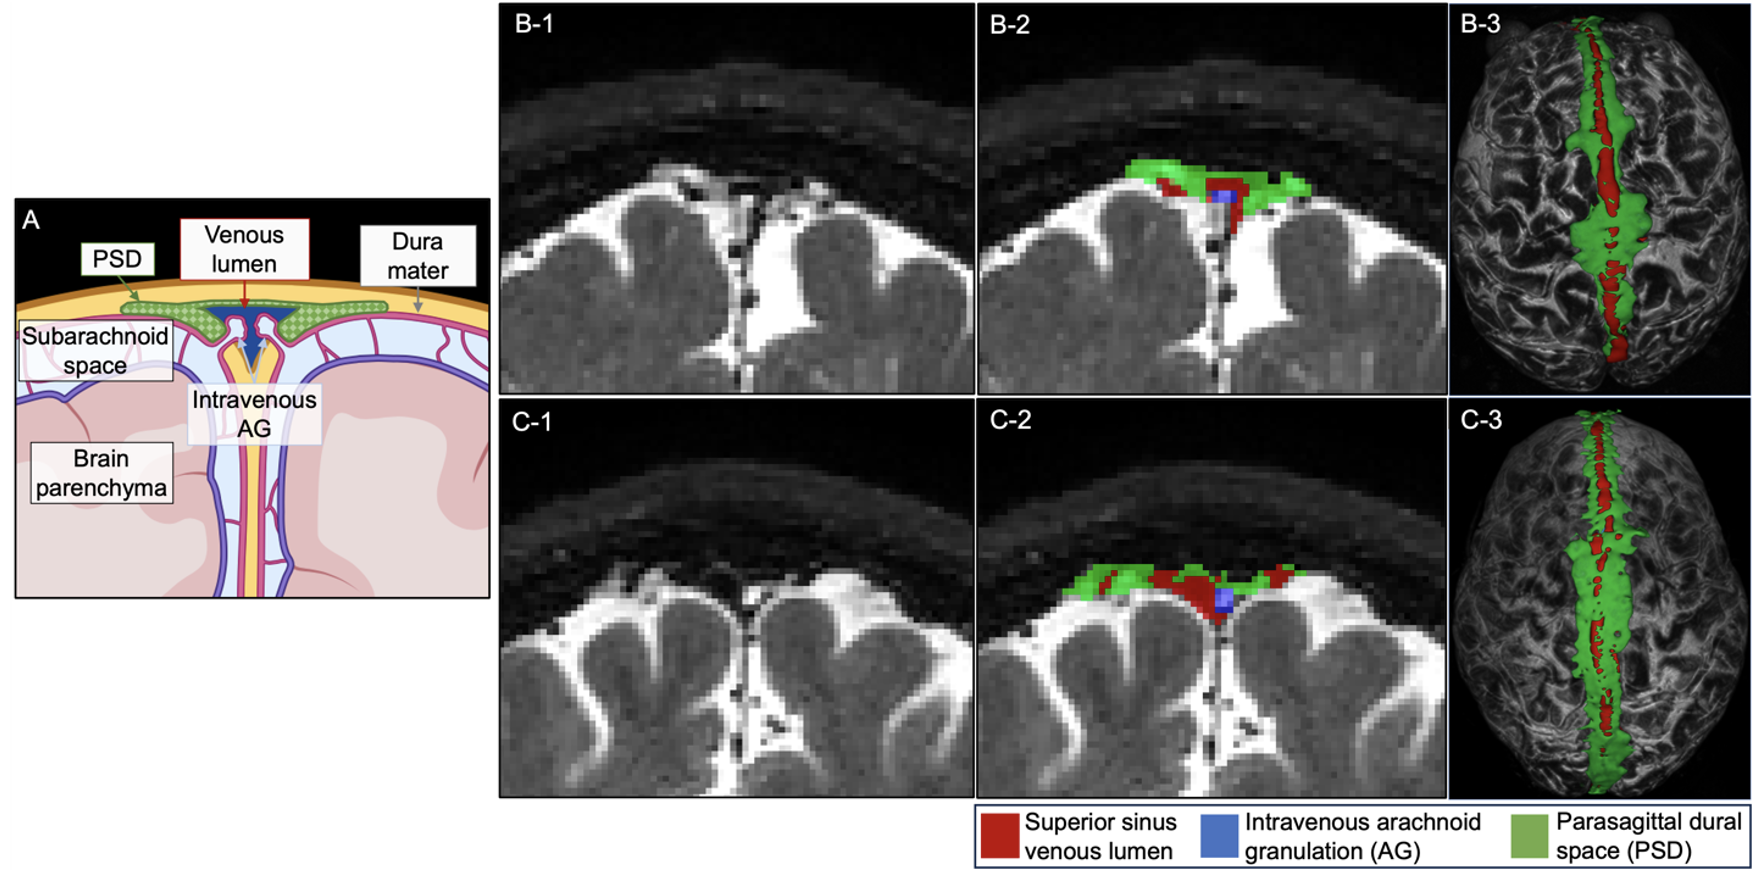
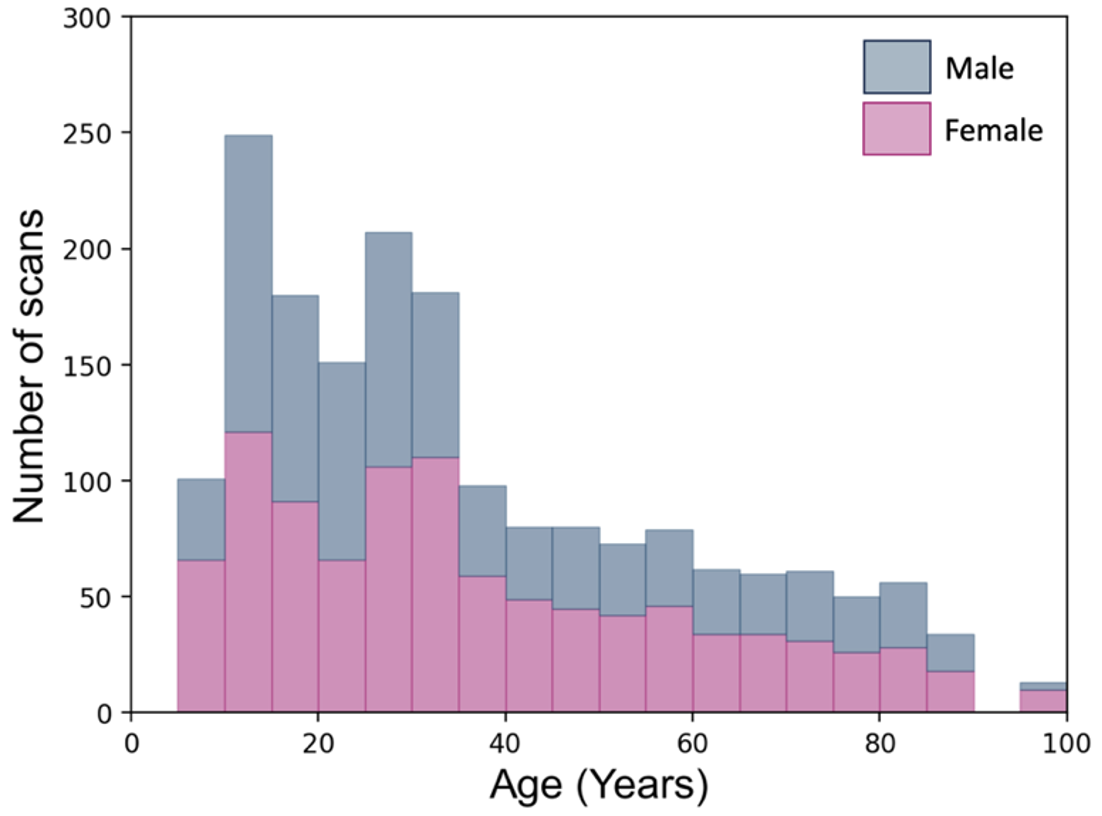
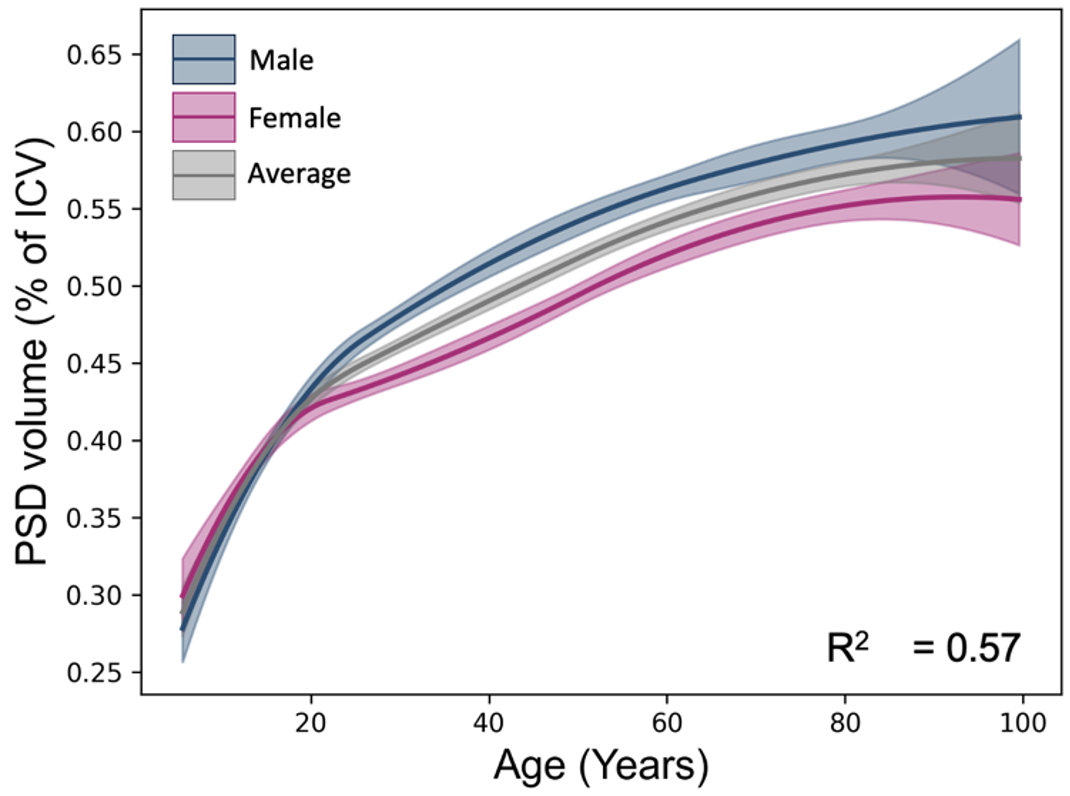
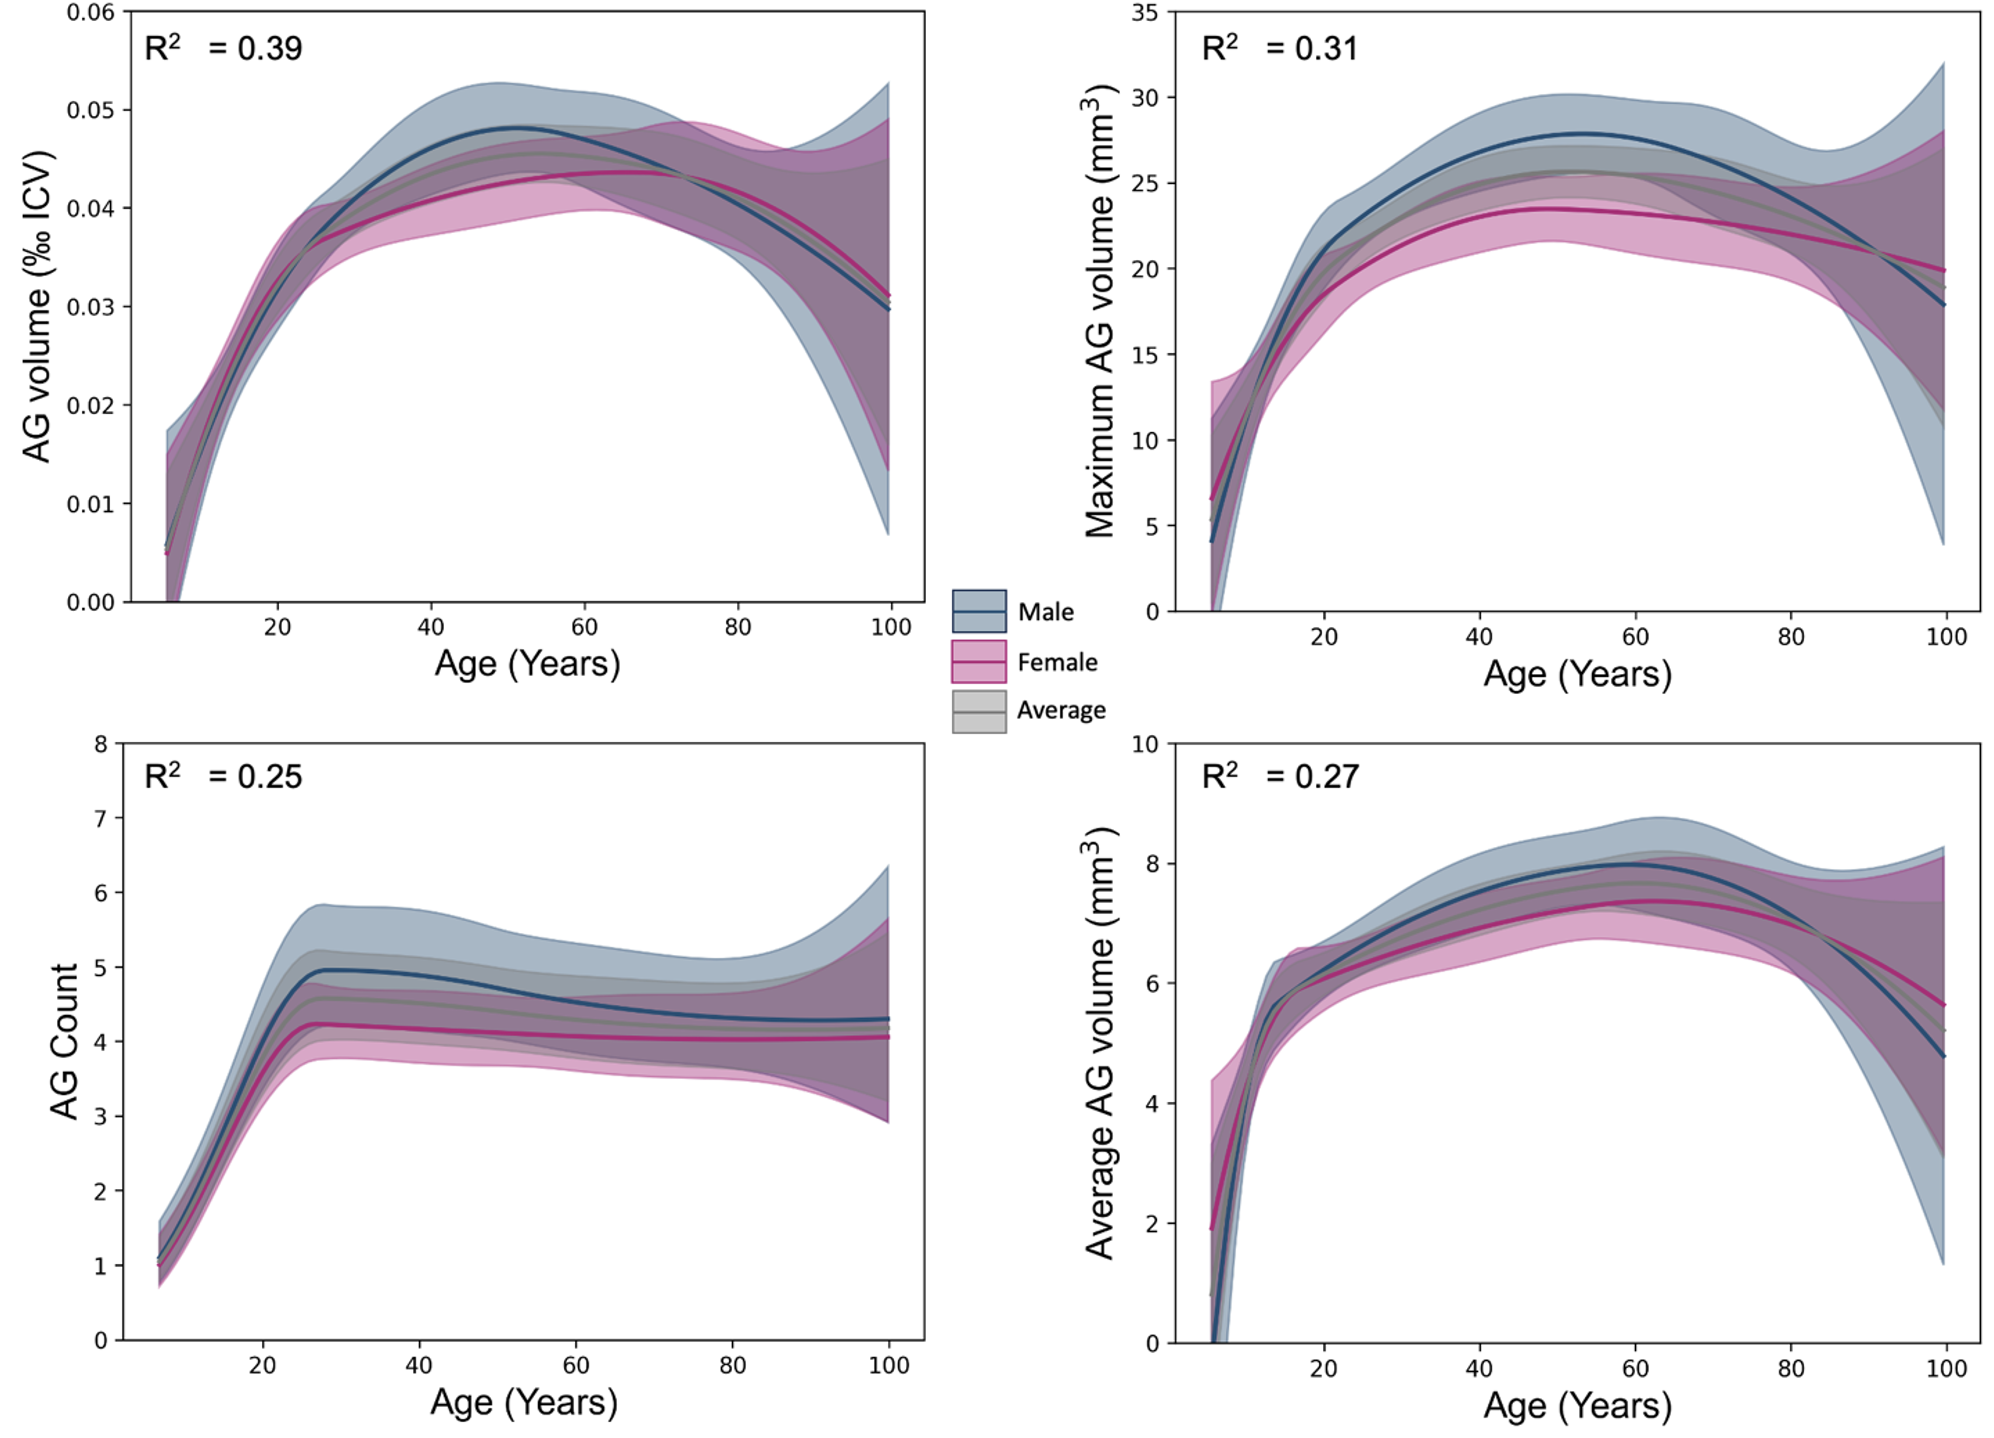
Figure 4. Modeling of the arachnoid granulation metrics of interest (i.e., total, maximum, average volume, and number) using restricted quadratic spline models. Blue and purple curves represent average AG measures in males and females, respectively. Gray curves represent the average of AG measures for both genders. Shaded areas represent the 95 percent confidence intervals.