2468
Improved PVS Segmentation using T1-weighted Image: Comparison with T2-weighted Image-Based Segmentation1Divison of Biomedical Engineering, Hankuk university of Foreign Studies, Yongin-si, Korea, Republic of, 2Department of radiology, Severance Hospital, Seoul, Korea, Republic of
Synopsis
Keywords: Neurofluids, Segmentation, Perivascular space, Glymphatic system
Motivation: In general, 3D T2 is more sensitive than 3D T1 in quantitatively assessing MR-visible perivascular space in the whole brain. However, in clinical practice, it is common to have 3D T1 but not 3D T2.
Goal(s): In this study, we introduce an improved method for PVS quantification using 3D T1 alone.
Approach: We used a cascaded model to sequentially improve perivascular space visibility and segmentation accuracy using 3D T1 alone.
Results: The result of the proposed method, using the T1w approach, demonstrates high similarity to the results obtained with only T2w data.
Impact: This study introduces a method to segment perivascular spaces using T1-weighted images when T2-weighted images are not available. The method involves cascaded models and shows the potential for results similar to T2w-based segmentation.
Introduction
Perivascular spaces (PVS), also known as Virchow-Robin spaces, are vital structures surrounding brain blood vessels [1]. They are typically assessed with 3D T2-weighted (T2w) or a combination of T1-weighted (T1w) and T2w imaging [2-5]. However, acquiring 3D T2w images for PVS assessment could be challenging in a clinic or open dataset. Our study introduces a new segmentation method using only T1w images, overcoming the limitations of T2w availability. We propose a two-step algorithm for enhancing visibility and creating a PVS mask, comparing its results with the traditional T2w-based approach, offering an alternative for PVS quantification.Methods
[Dataset and Preprocessing]In this study, we used 3T 3D T1w and T2w images of the Human Connectome Project (HCP) dataset( HCP-Young Adult,22-35 years) [6]. We used 927 subjects for model training and 45 subjects for model tests. Also, additional external validation was performed on an independent dataset (N=18, young adults) obtained from 3T Philips MRI. For training, enhanced T1w targets were generated by performing a pixel-wise division of T1w by T2w(T1w/T2w) after confirming the accuracy of co-registration.
[Network]
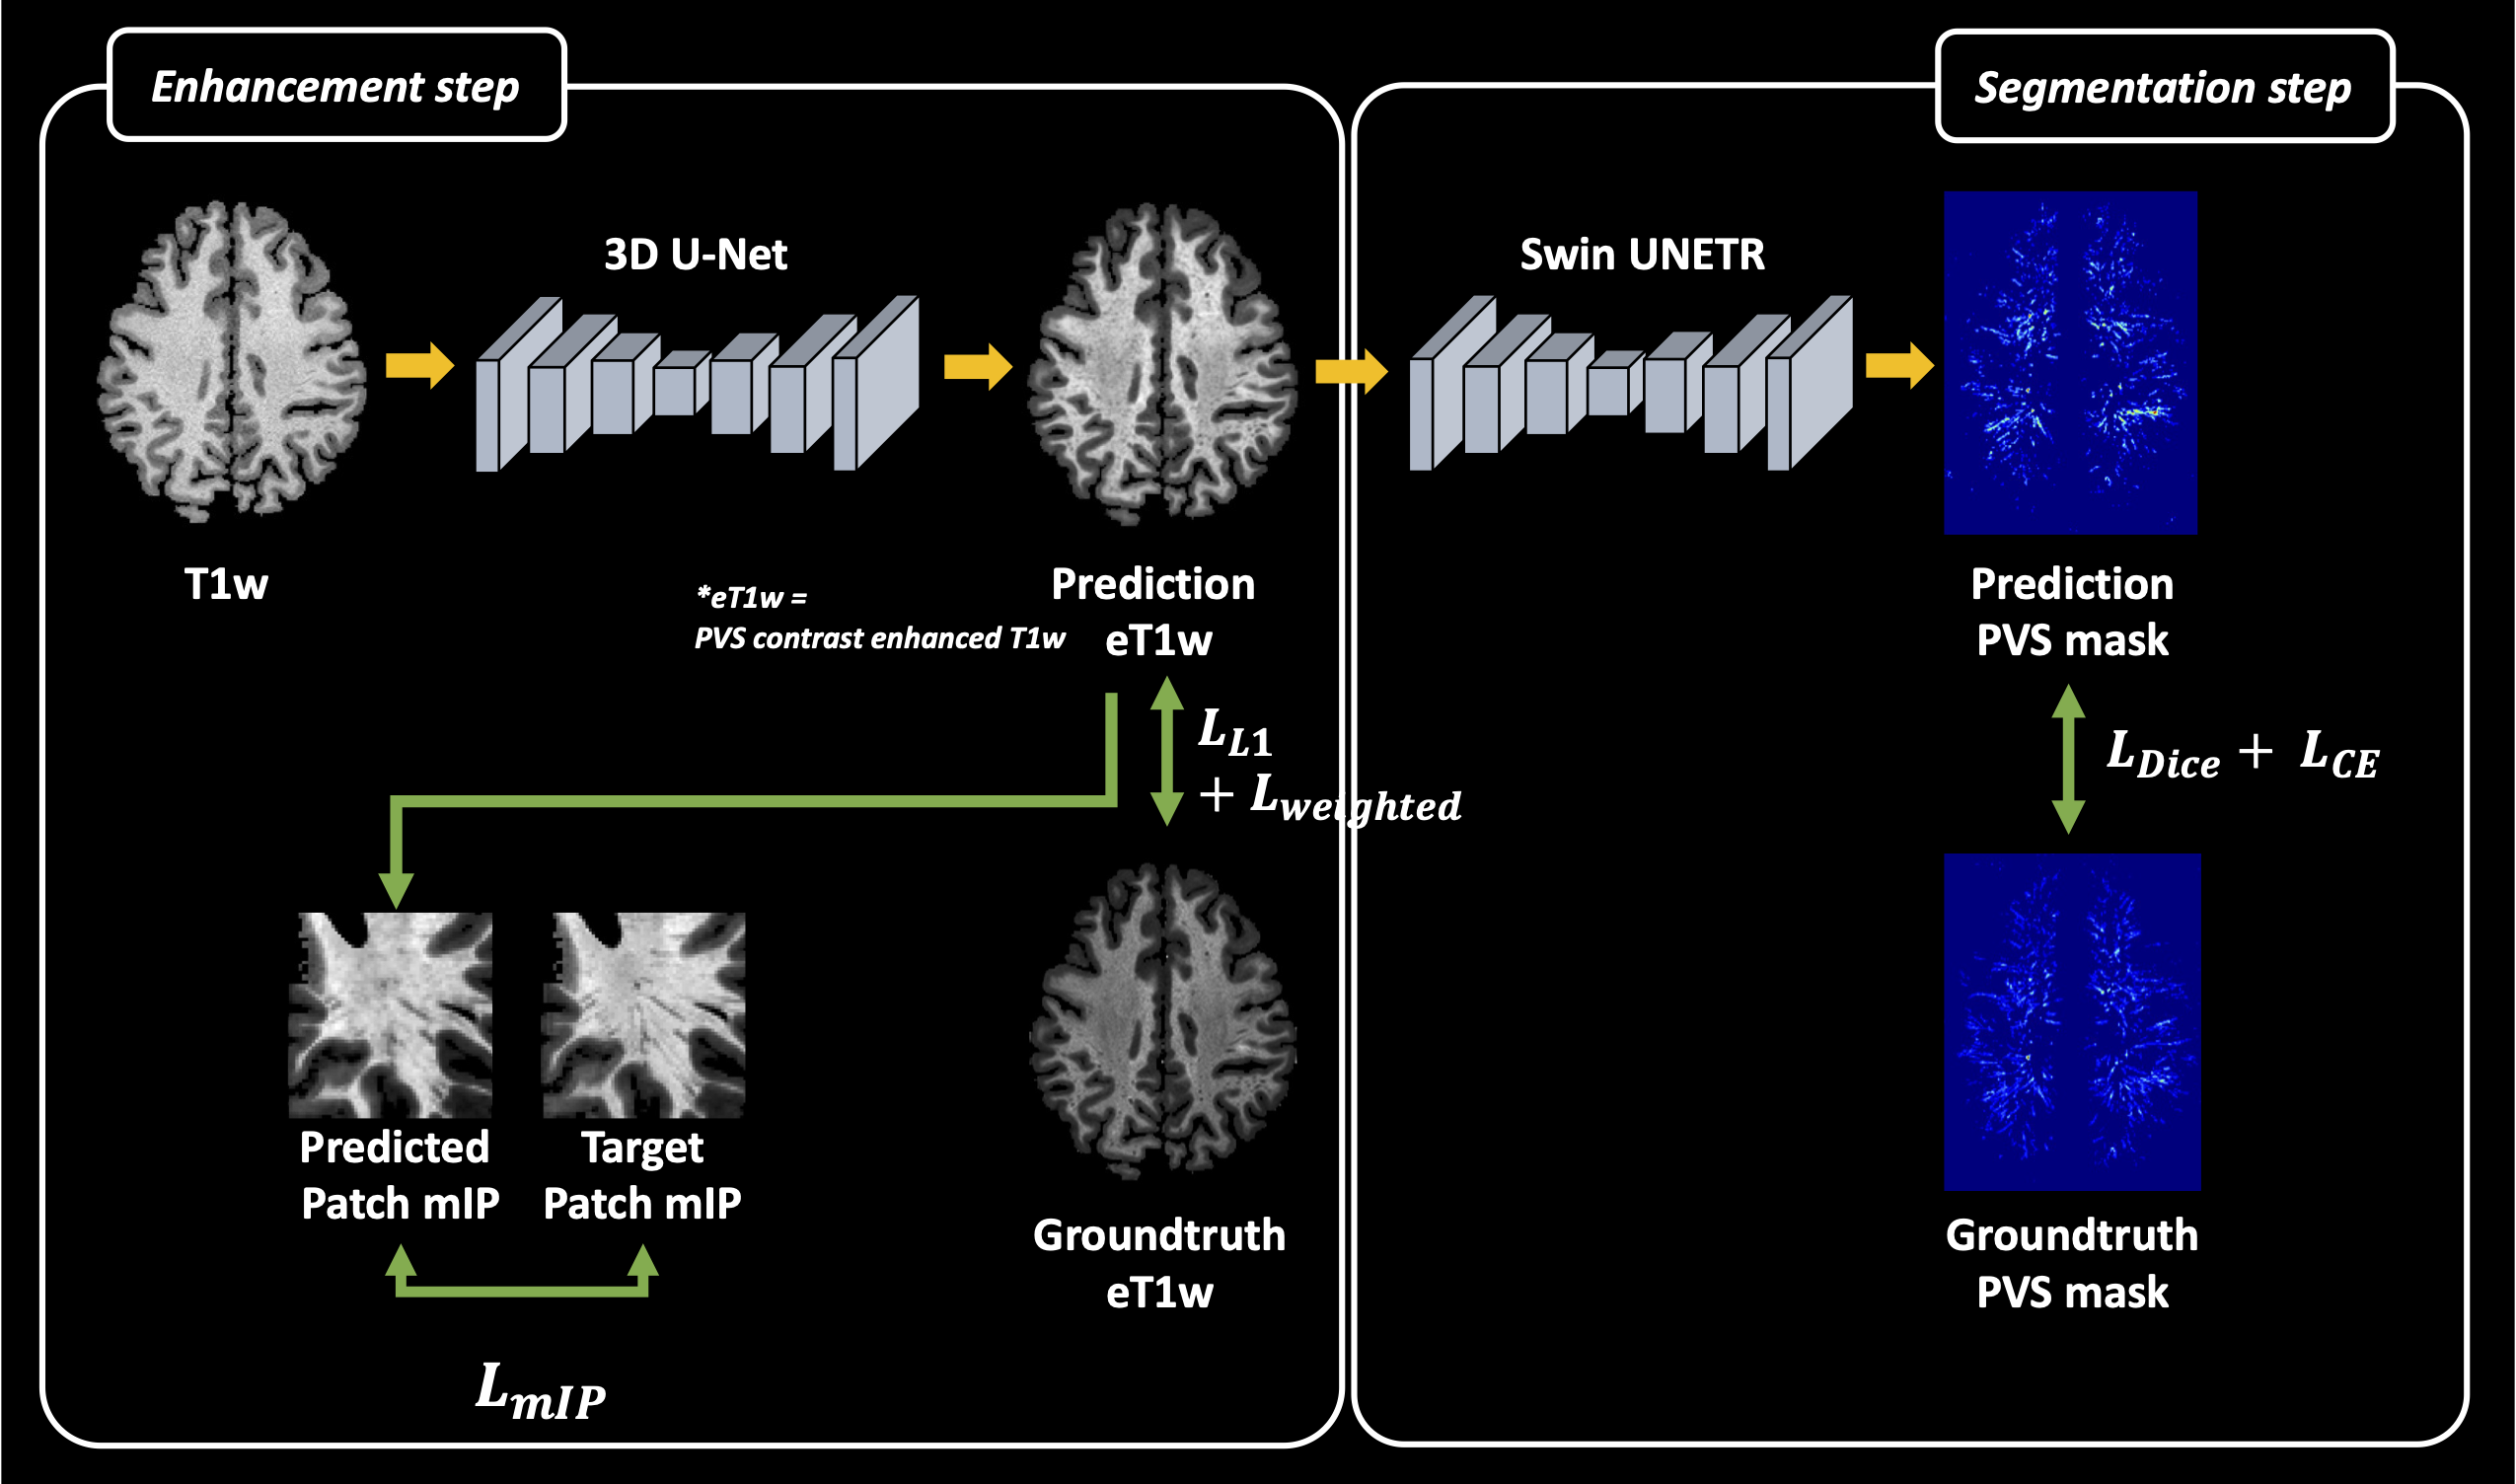
Our T1w-based segmentation method consists of two deep learning models as described in Figure 1.The first model enhances PVS visibility by synthesizing the target, while the second model segments PVS voxels using the output of the first model as input data. We utilized 3D U-Net and SwinUNetR [7] as the synthetic model and segmentation model, respectively.
To update the model, we used a combination of multiple loss functions (Eq1.). For the enhancement step, we randomly selected consecutive 6 slices from the entire volume and performed the minimum intensity projection (mIP) to both the output and target images, followed by L1 Loss(Eq2, Eq3). Also, we calculated L1 with a PVS weighted map(Eq2). For the segmentation step, we used a combination of Dice and cross entropy loss function(Eq4.).
$$ Equation 1: L_{total} = L_{Recon}+L_{Seg} \\Equation 2: L_{Recon} = L_1 + \lambda_{1}L_{mIP}+\lambda_{2} L_{weighted} \\Equation 3: L_{mIP} = L_1(mIP(\widehat{y}), mIP(f(y))) \\Equation 4: L_{Seg} = L_{Dice}+L_{CE} $$
[Evaluation]
For comparison, we also trained SwinUNetR using single contrast (T2w or T1w) input. To evaluate the results, the total volume of PVS segmentation and the number of connected components of PVS segmentation were calculated. And then, we calculated Pearson correlation coefficients between the results of models to measure the similarity.
Results
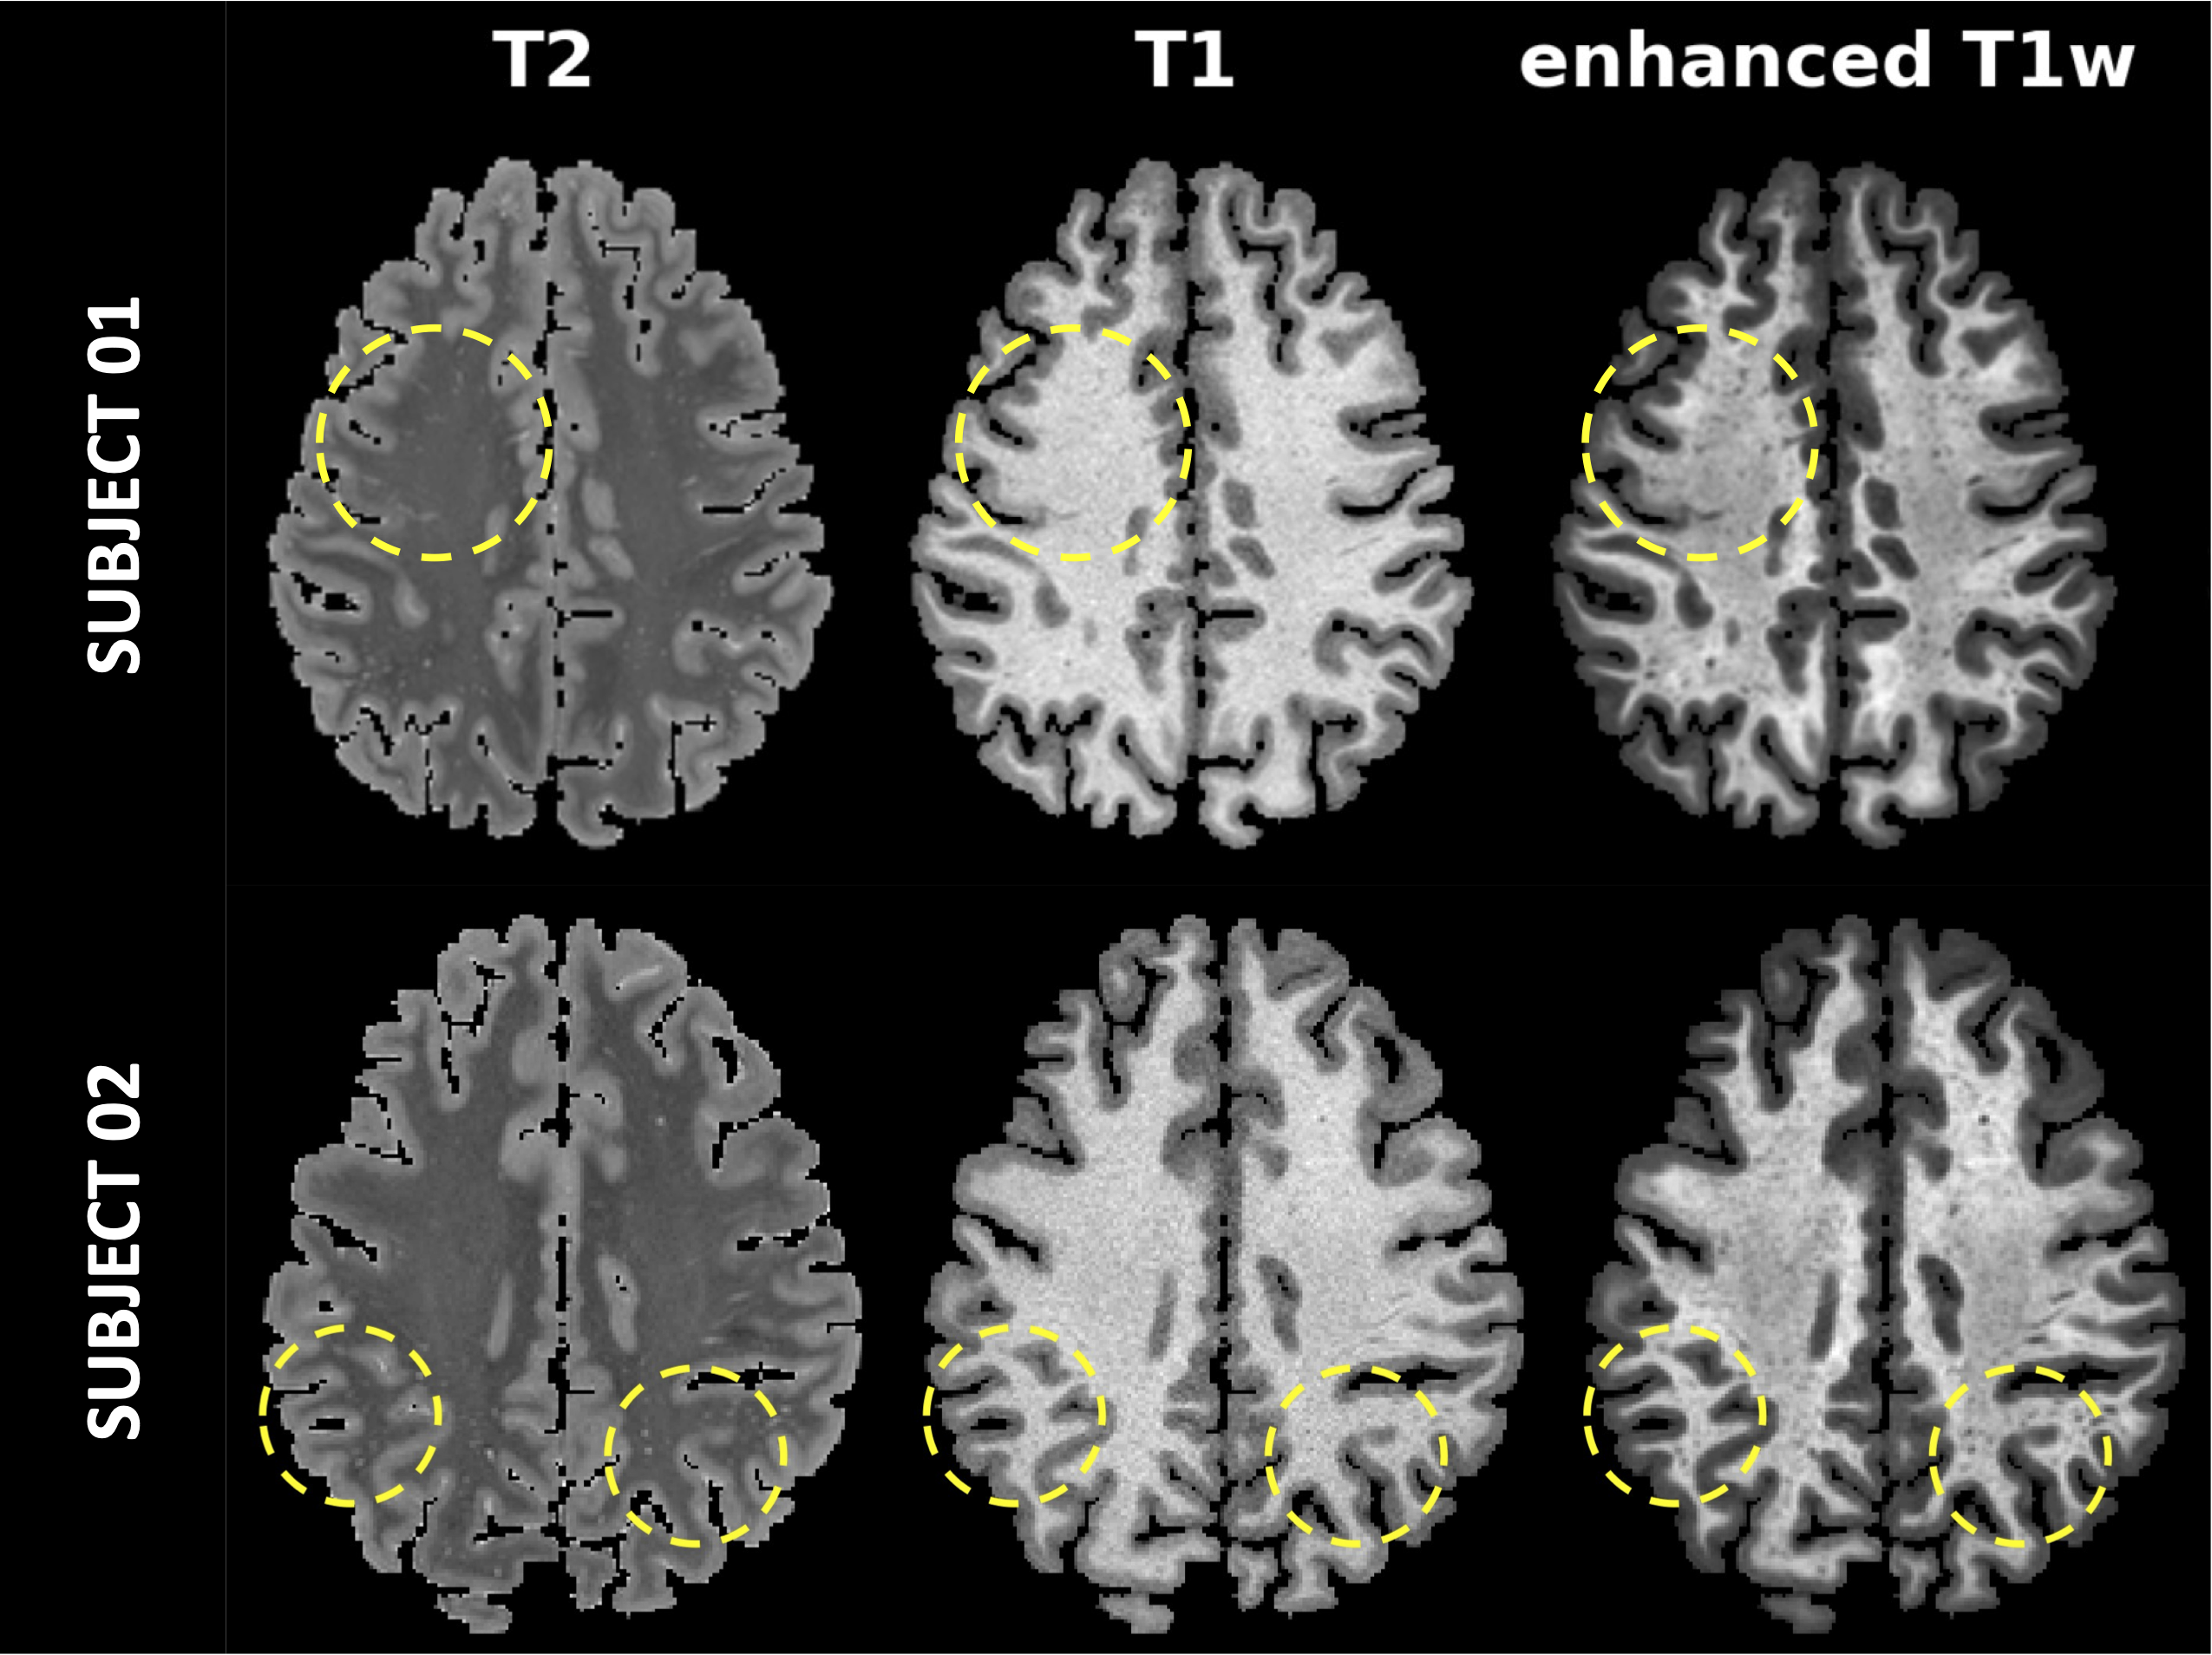
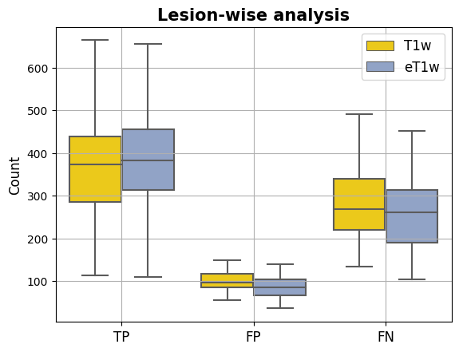
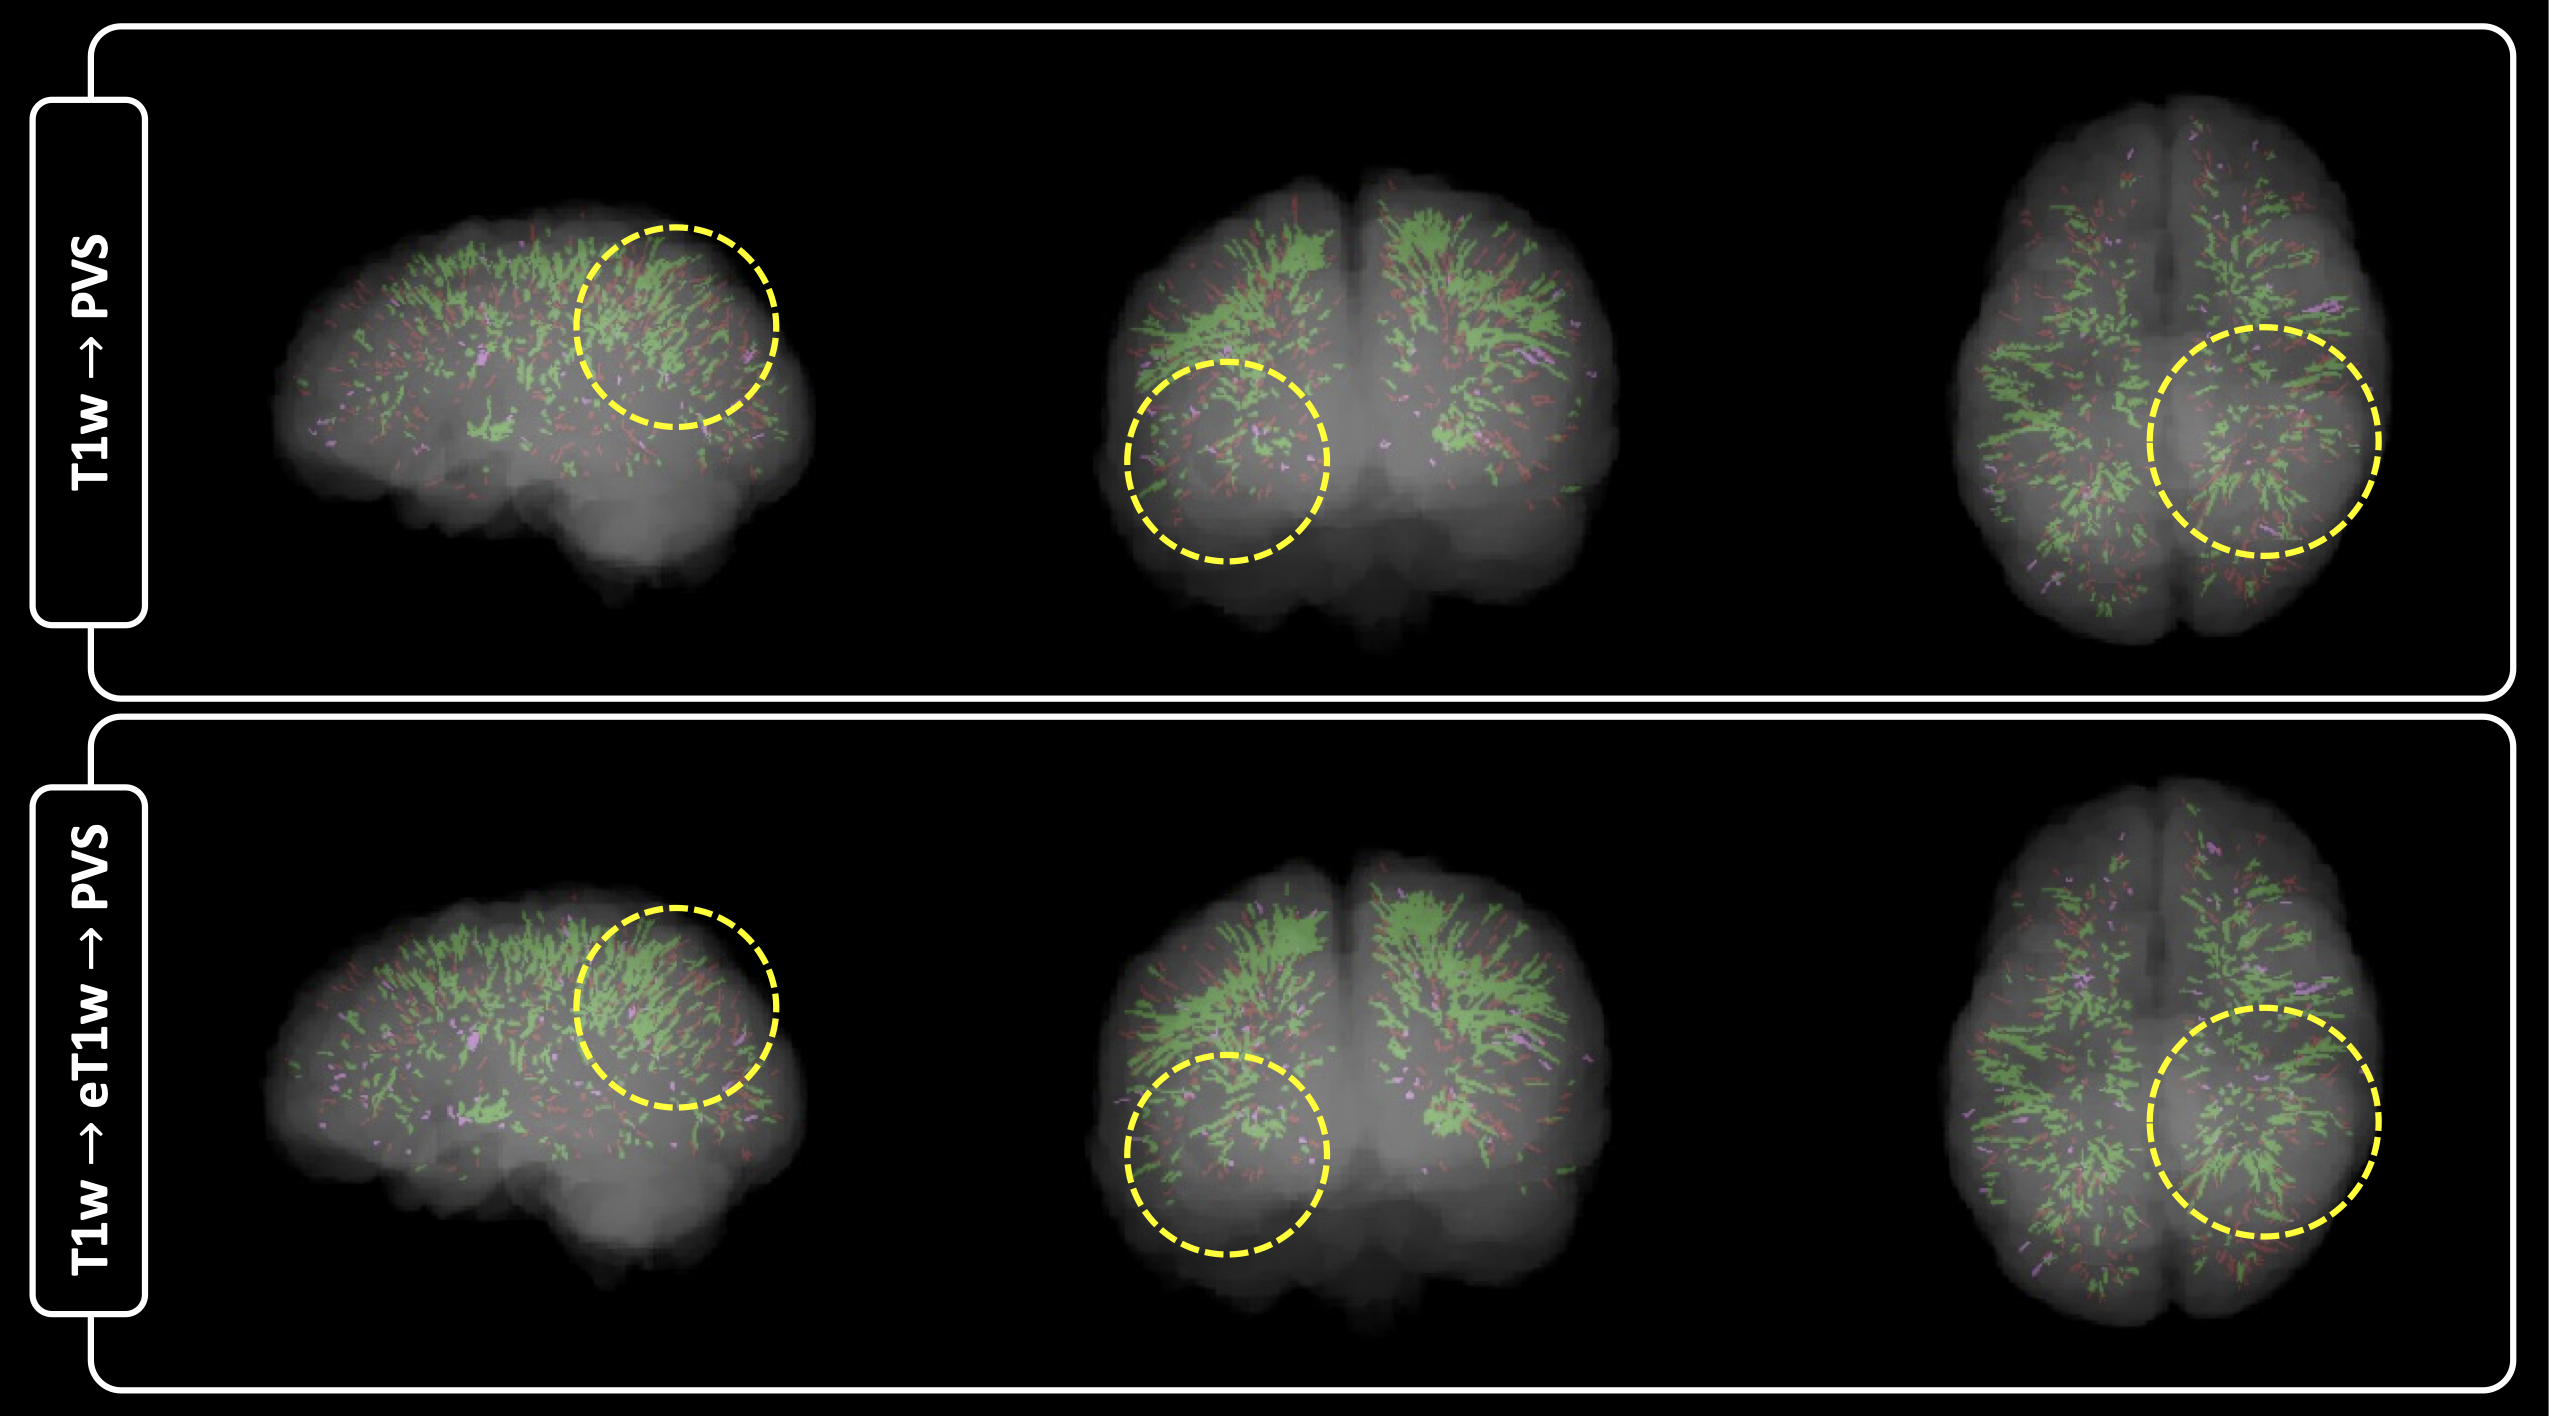
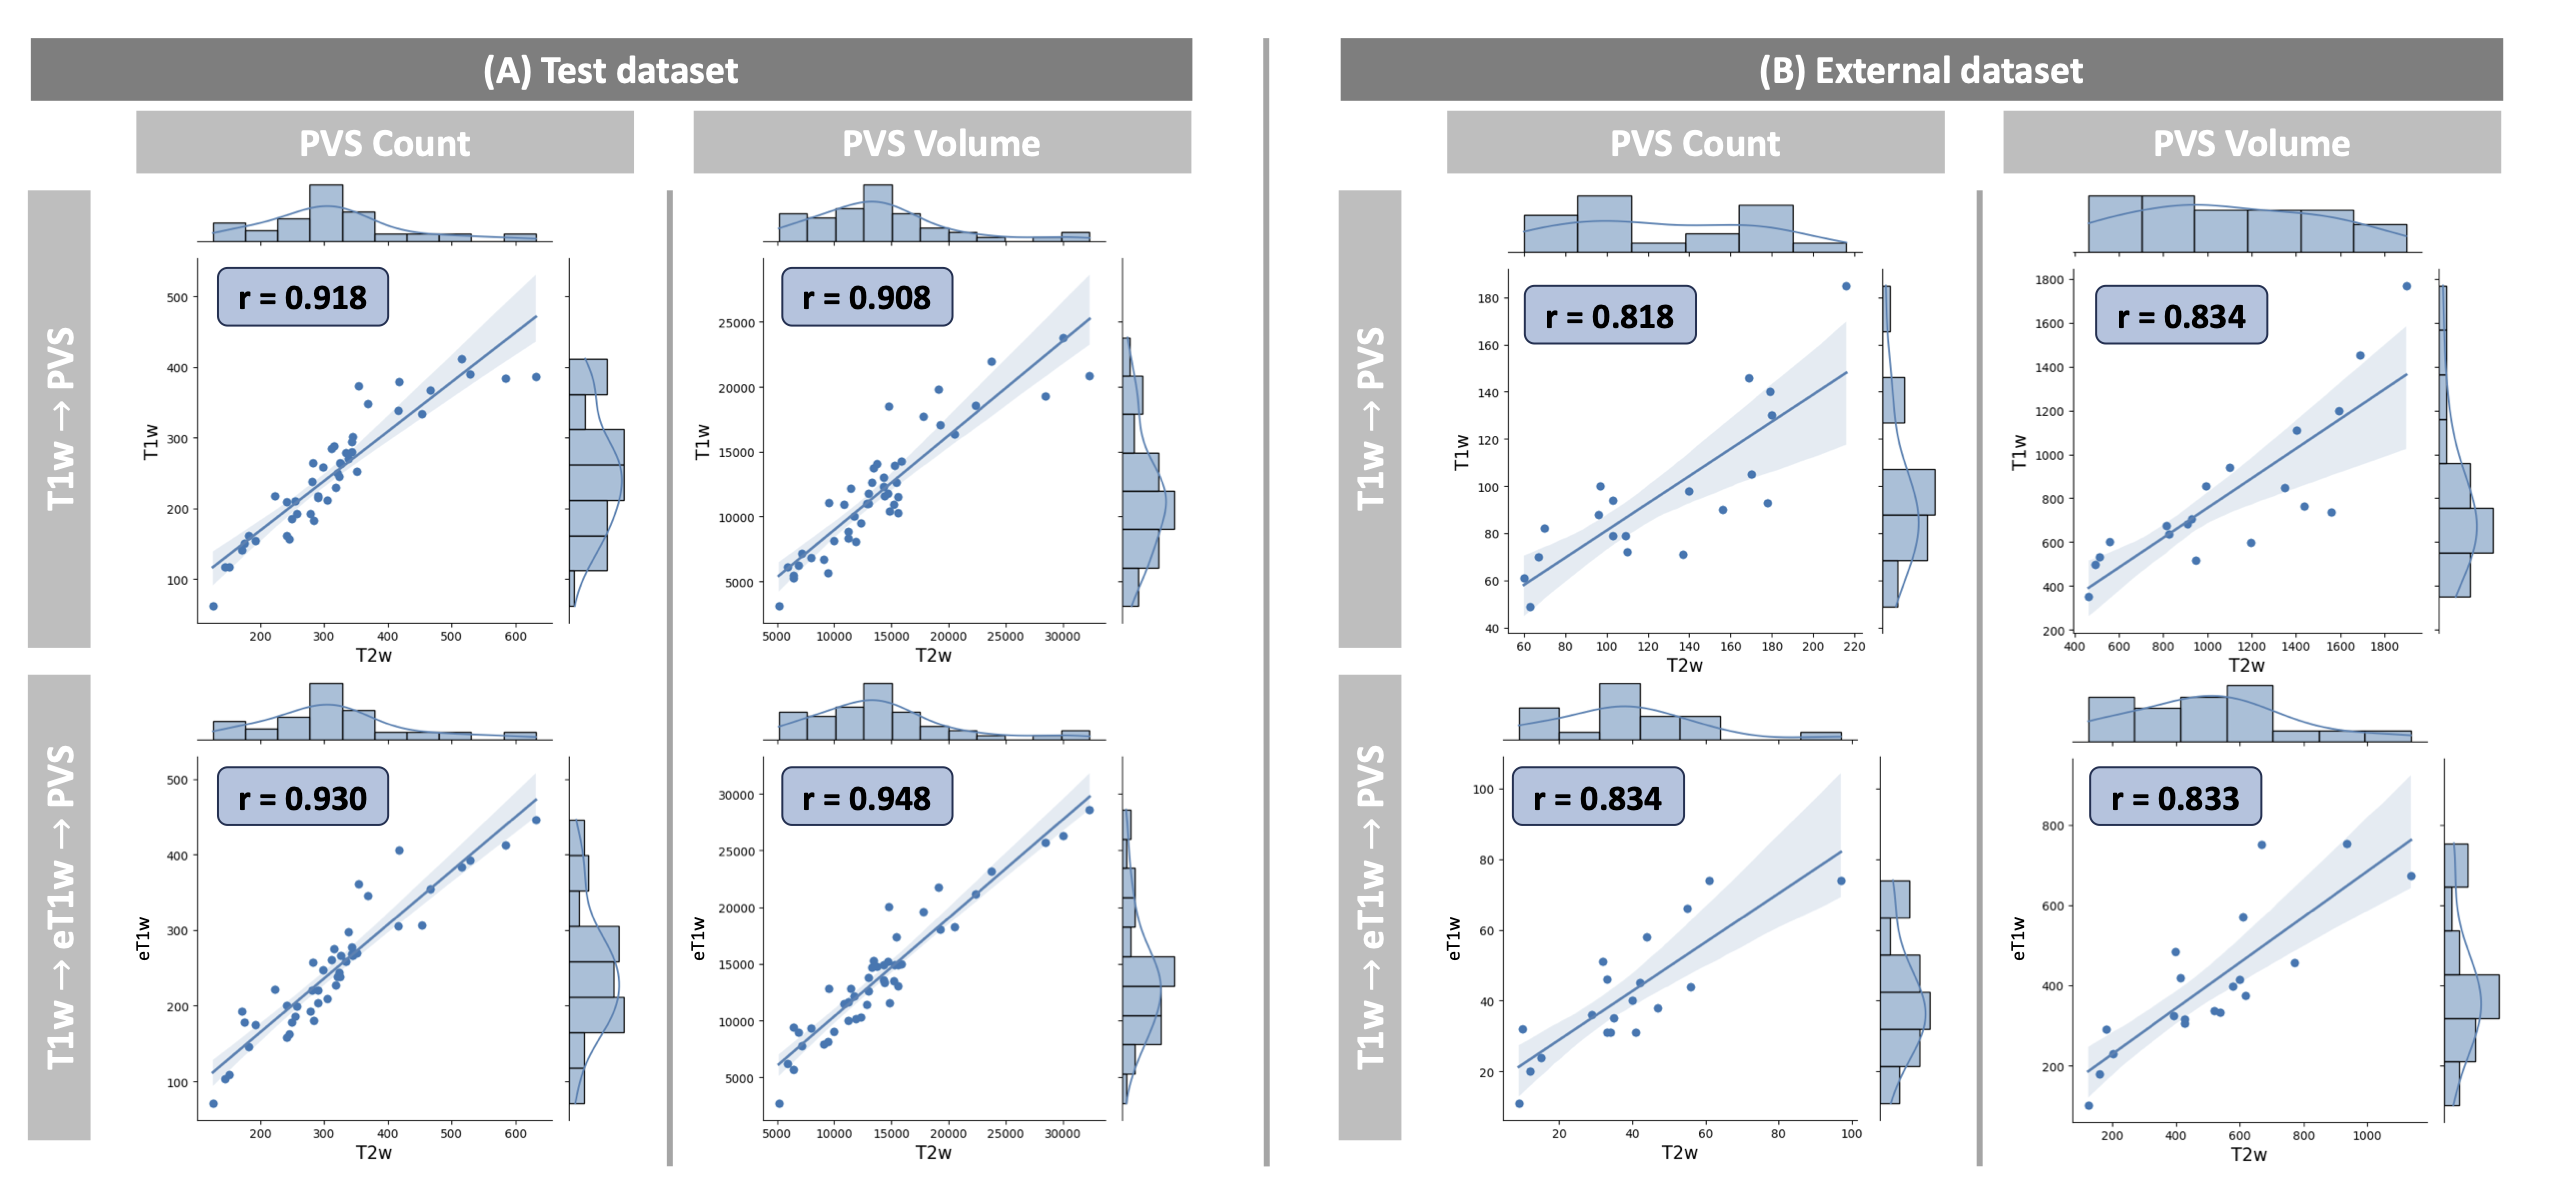
Figure 2 shows the improved visibility of PVS compared to the original T1w image as shown in the yellow circle. Figure 3 summarizes the true positive (TP), false positive (FP), and false negative (FN) for the segmentation results of the test set. The results indicate that our approach effectively reduces FPs, and false negatives (FN), and increases true positives (TP). Figure 4 shows the representative volume rendering images including the TP(Green), FP(red), and FN(pink) regions of two methods. Figure 5 summarizes the calculated PVS volumes and numbers from the segmentation results. In the proposed method, the correlation coefficients were improved from 0.91 to 0.95 for PVS volume and from 0.92 to 0.93 for PVS count, showing closer results to those from T2w in figure 5a. For the external test set, there were no significant differences in terms of volume, but an improvement was observed in terms of PVS count as shown in figure 5b.Conclusion
In this study, we presented the PVS segmentation method utilizing only 3D T1w images. The results of the proposed T1-based method showed a high similarity to the results of T2w for PVS volume and count in the brain. Our approach is expected to increase the clinical value of PVS quantification through 3D T1w images.Acknowledgements
This work was supported by the National Research Foundation of Korea(NRF) grant funded by the Korea government(MSIT) (No. RS-2023-00248100).References
[1] B. Durcanova, J. Appleton, N. Gurijala, V. Belov, P. Giffenig, E. Moeller, M. Hogan, F. Lee, M. Papisov, The configuration of the perivascular system transporting macromolecules in the CNS, Frontiers in Neuroscience. 13 (2019) 511.
[2] Y. Choi, Y. Nam, Y. Choi, J. Kim, J. Jang, K.J. Ahn, B. Kim, N. Shin, MRI‐visible dilated perivascular spaces in healthy young adults: A twin heritability study, Hum. Brain Mapp. 41 (2020) 5313-5324.
[3] H. Lan, K.M. Lynch, R. Custer, N. Shih, P. Sherlock, A.W. Toga, F. Sepehrband, J. Choupan, Weakly supervised perivascular spaces segmentation with salient guidance of Frangi filter, Magnetic Resonance in Medicine. 89 (2023) 2419-2431.
[4] T. Rashid, H. Liu, J.B. Ware, K. Li, J.R. Romero, E. Fadaee, I.M. Nasrallah, S. Hilal, R.N. Bryan, T.M. Hughes, Deep learning based detection of enlarged perivascular spaces on brain MRI, Neuroimage: Reports. 3 (2023) 100162.
[5] H.G. Kim, N. Shin, Y. Nam, E. Yun, U. Yoon, H.S. Lee, K.J. Ahn, MRI-visible dilated perivascular space in the brain by age: The human connectome project, Radiology. 306 (2022) e213254.
[6] D.C. Van Essen, K. Ugurbil, E. Auerbach, D. Barch, T.E. Behrens, R. Bucholz, A. Chang, L. Chen, M. Corbetta, S.W. Curtiss, The Human Connectome Project: a data acquisition perspective, Neuroimage. 62 (2012) 2222-2231.
[7] A. Hatamizadeh, V. Nath, Y. Tang, D. Yang, H.R. Roth, D. Xu, Swin unetr: Swin transformers for semantic segmentation of brain tumors in mri images, (2021) 272-284.
Figures